2509
Cardiac mechanical function and metabolism during hyperpolarized 13C experiments1Medical Physics, University of Wisconsin-Madison, Madison, WI, United States, 2Medicine, University of Wisconsin-Madison, Madison, WI, United States, 3Pediatrics, University of Wisconsin-Madison, Madison, WI, United States, 4Biomedical Engineering, University of Wisconsin-Madison, Madison, WI, United States, 5Radiology, University of Wisconsin-Madison, Madison, WI, United States
Synopsis
We investigated the relationship between contractile function and hyperpolarized (HP) [1-13C]pyruvate metabolism in a small animal model. We demonstrated significant functional changes in cardiac contractile function between pre- and post-infusion of [1-13C]pyruvate. The combined effect of infusion volume and pyruvate substrate likely explains most of the augmentation in myocardial mechanical function seen in these experiments. These data indicate the most appropriate time to image myocardial contractile function is soon as possible after HP 13C pyruvate infusion.
Introduction
In the setting of heart disease, cardiac metabolic changes precede overt pump dysfunction 1. However, in most clinical scenarios, metabolism and function are not typically assessed together. The purpose of this study was to develop novel methodology to study the dynamic relationship between contractile function and metabolism using HP [1-13C]pyruvate in a preclinical rat model. The volume needed for sufficient pyruvate signal to be detected in the myocardium is proportionally large to the animal’s body mass based on previous works 2–6. Indeed, the volumes generally used can be up to 10% of the rat’s total blood volume based on established calculations 7. Furthermore, pyruvate itself has inotropic effects on the heart 8. Taken together, it is important to consider the potential volume load and the inotropic effects of pyruvate when performing hyperpolarized 13C-pyruvate cardiac metabolic and functional experiments.Methods
Eight separate Sprague Dawley rats (40-130 grams) were imaged in compliance with our Institutional Animal Care and Use Committee regulations. Rats were anesthetized using 3% isoflurane in oxygen (1 L/min) and maintained at 1-2% isoflurane in oxygen (1 L/min) throughout imaging. Intravenous injection of hyperpolarized [1-13C]pyruvate during imaging was performed via a cannula placed in the tail vein. Body temperature and respiratory rate were monitored with a fiber optic temperature probe and respiratory pad placed under the rats. A warm air blower was used to maintain body temperature at approximately 37°C throughout imaging.
Dynamic nuclear polarization (HyperSense, Oxford Instruments, UK) was used to polarize 40-μL samples of [1-13C]pyruvate (Cambridge Isotope Laboratories Inc., Tewksbury, MA) doped with 15 mM trityl radical (Oxford Instruments, Concord, MA). Following solid-state polarization, the sample was rapidly heated with a 6-mL solvent containing 1.5 mL of 426 mM NaOH, 2.3 mL of 400 mM Tris base, and 2.2 mL of 250 mg/L EDTA. 10 μL/g of sample was injected into the tail vein ~20 s after the start of imaging 9,10. Liquid-state polarization ranged from 16 – 20% at the time of injection.
Just prior to each injection, ECG and respiratory gated dynamic k-t spiral MRSI 11 was started with the following parameters: oversampling factor=3 or 7, nominal FOV=40×40 mm2, nominal matrix=16×16, slice thickness=5 mm, TR/TE1/ΔTE=50/1.0-6.4/0.743 ms, NE=5-8, flip angle=10-15°, and receiver bandwidth=250 kHz. Additionally, bipolar gradients were implemented prior to spiral readout to dephase blood pool signal (Gmax,z: 26-36 G/cm; Gmax,x and Gmax,y: 4 – 8 G/cm, lobe duration=1.5-2.0 ms, lobe separation=0 ms). Images were reconstructed using a direct-IDEAL approach 11.
ECG and respiratory gated 1H cine images covering the entire heart (FA = 45⁰, FOV=40×40 mm2, matrix=128×128, slice thickness=1 mm, TR/TEeff=6.9/1.4 ms, cardiac phases=24) were acquired both pre- and post-injection of [1-13C]pyruvate to determine cardiac hemodynamics. All imaging was performed on a 4.7T small animal scanner (Agilent Technologies, Santa Clara, CA) using a dual-tuned 1H/13C volume coil (Doty Scientific, Columbia, SC).
Results
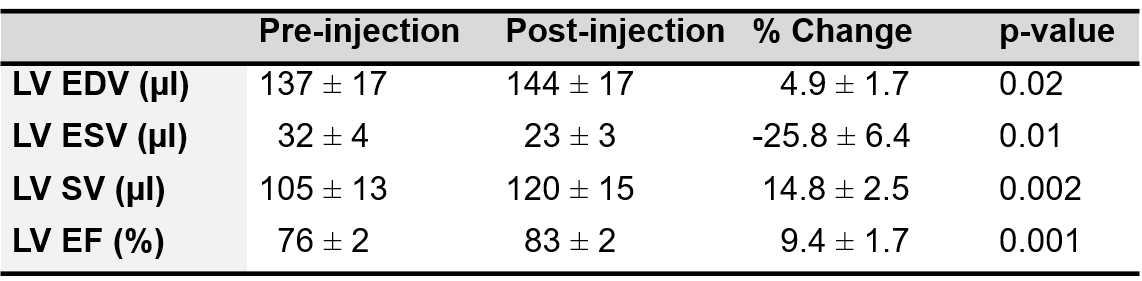
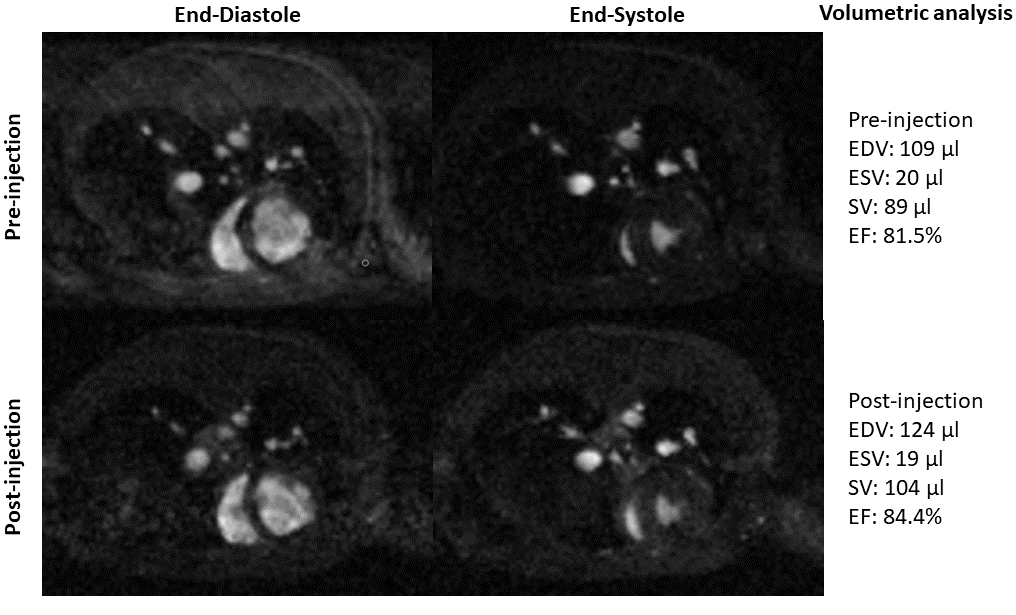
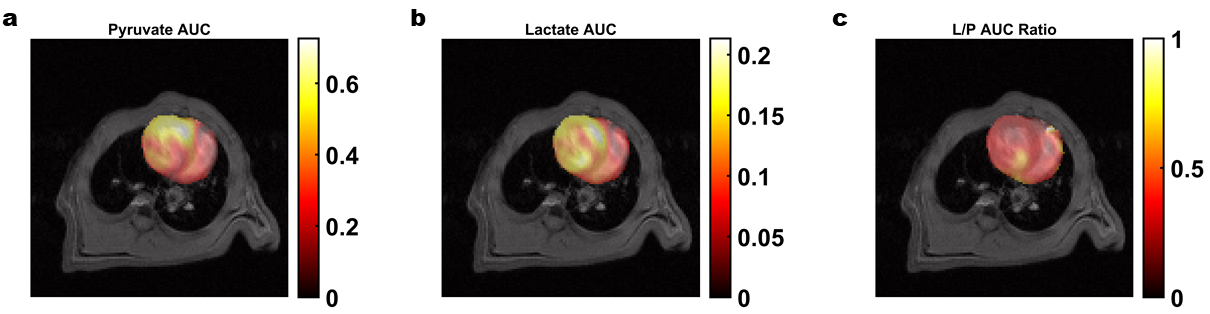
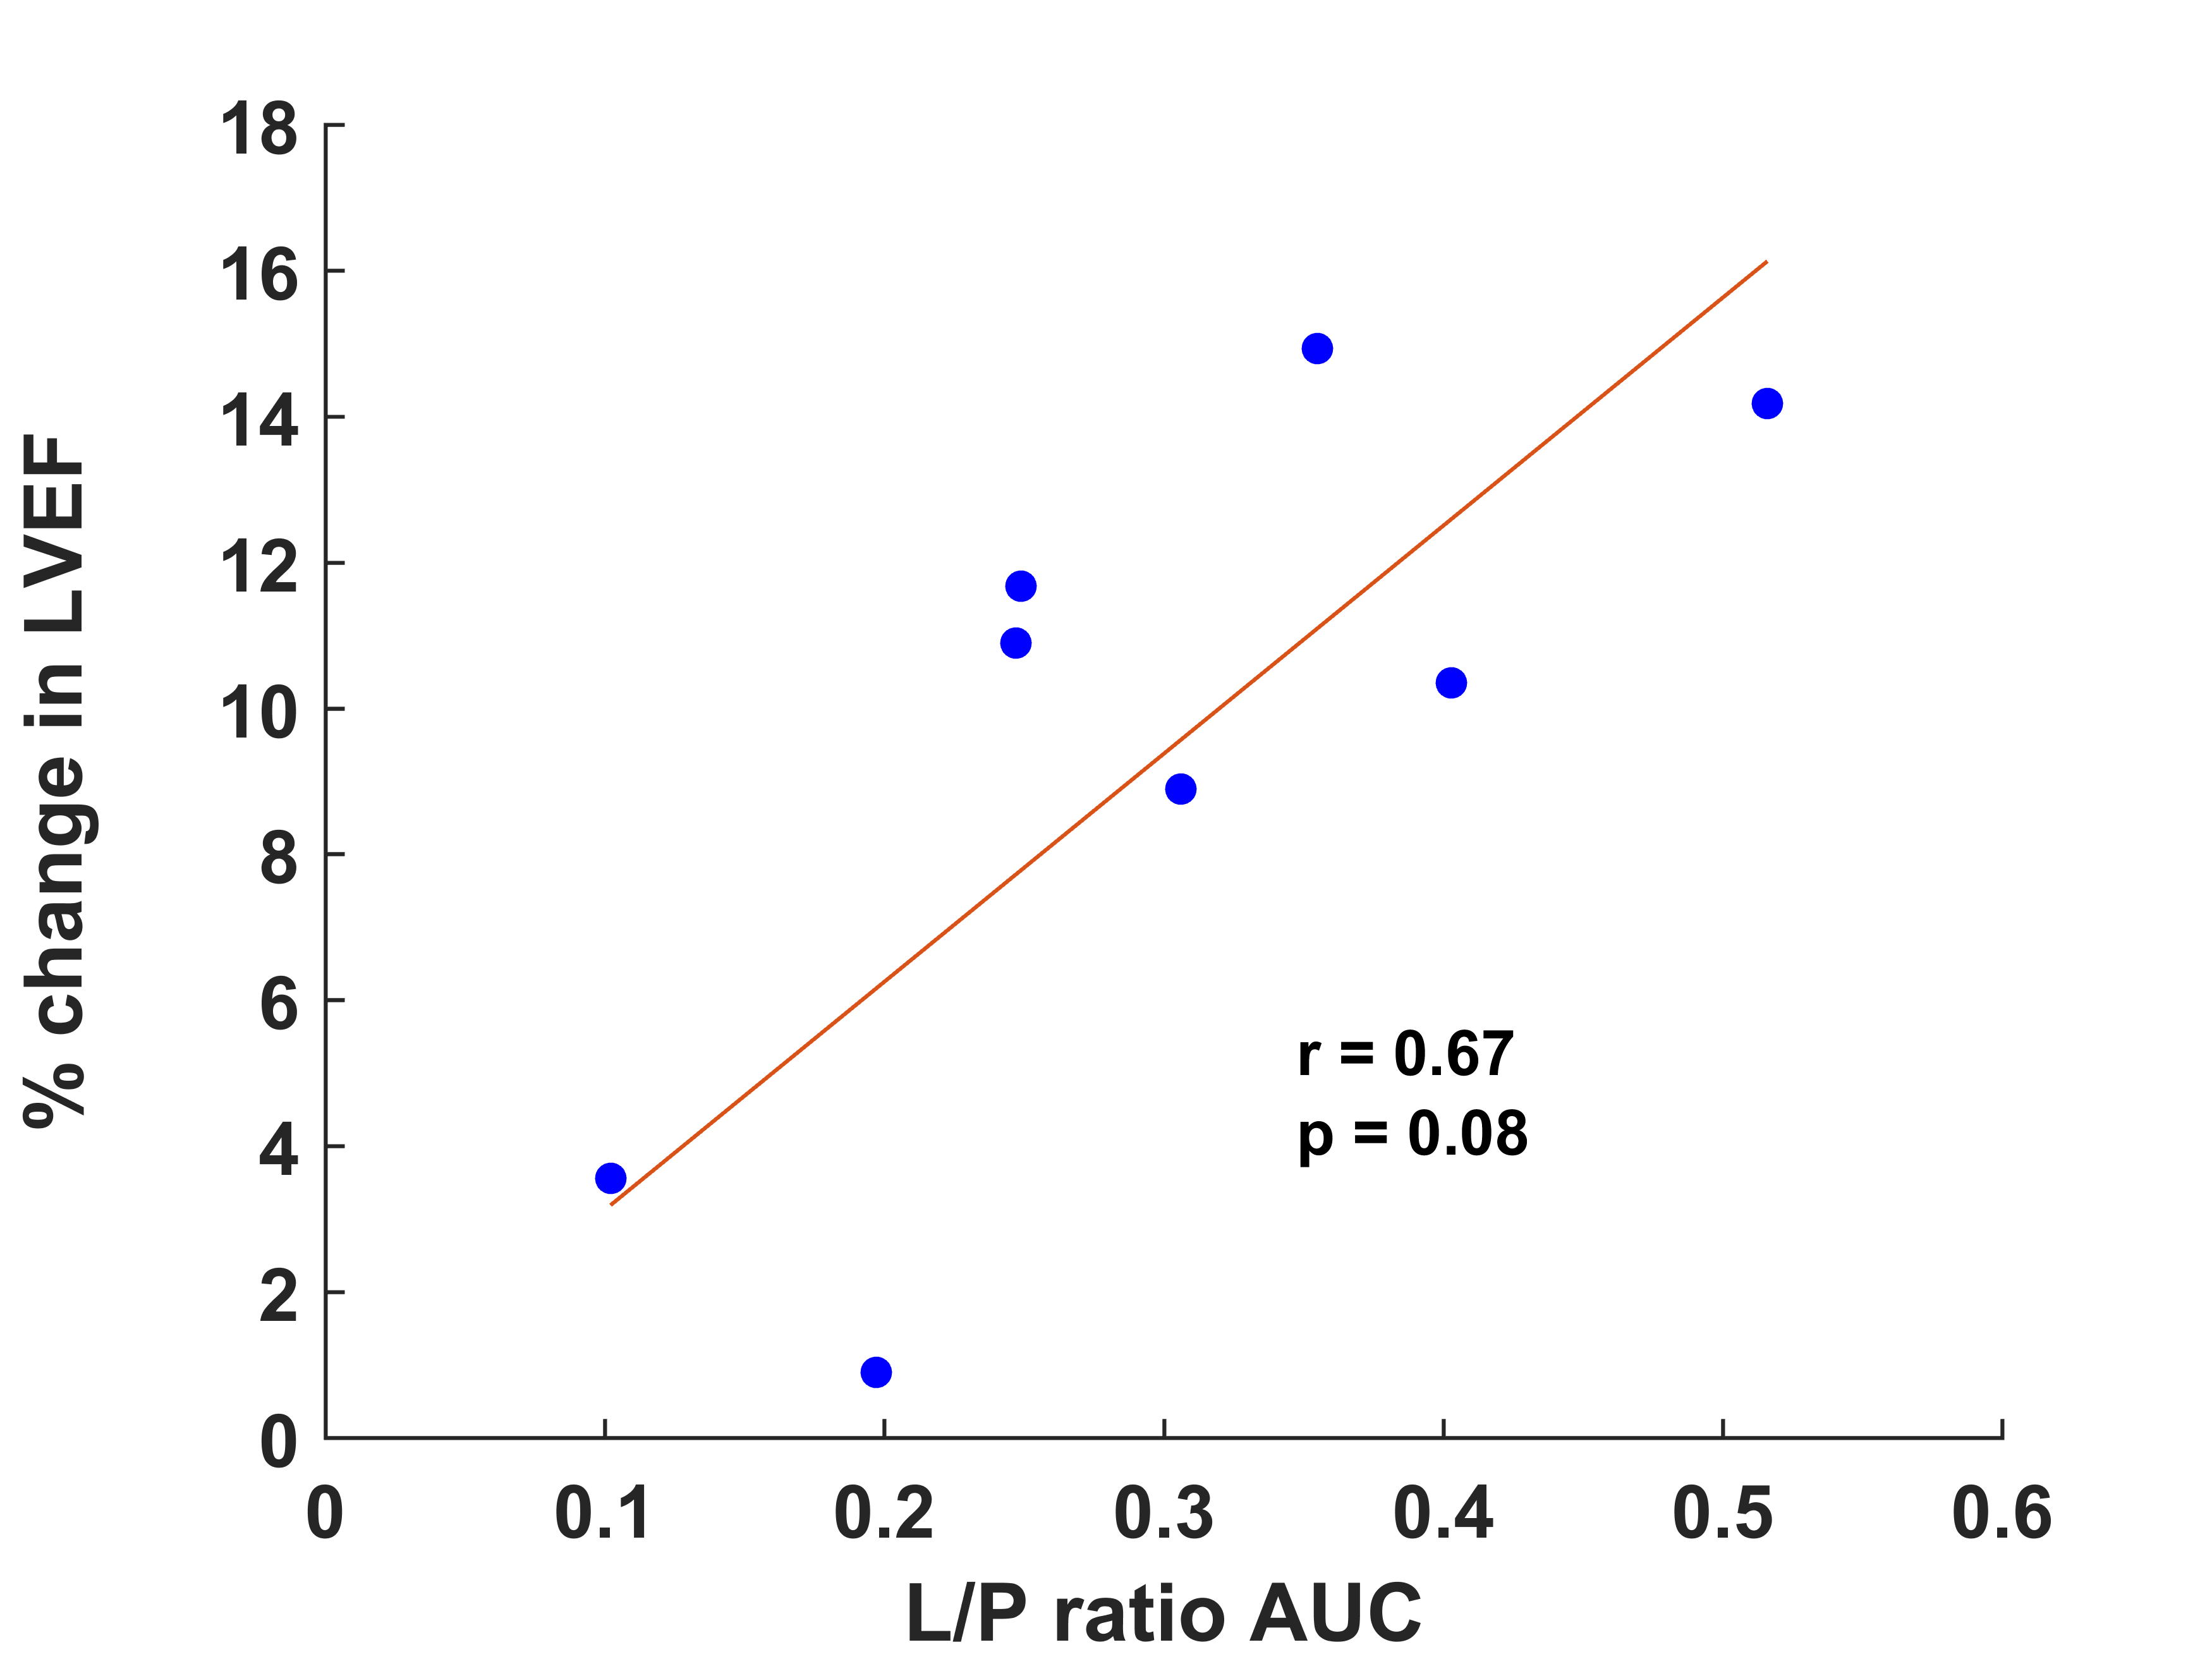
Following [1-13C]pyruvate injection, there was an increase in end-diastolic volume (EDV), stroke volume (SV), LV ejection fraction (EF) and a decrease in end-systolic volume (ESV) (p < 0.05) as shown in Figures 1 and 2. Overall, there was a 4.9% increase in EDV, while SV increased 14.9%, suggesting something other than an increase in EDV from pre- to post-injection could account for the increased SV. There is a moderate to strong relationship between the downstream metabolic conversion of pyruvate to lactate and the cardiac mechanical function response to the combined effects of the volume load and pyruvate (Figure 3 and 4).
Discussion
The HP [1-13C]pyruvate injections impacted the resulting cardiac functional measures in these studies. The combination of the infused volume and the [1-13C]pyruvate likely explain the increases in SV and EF that were observed. The Frank-Starling mechanism dictates that an increase in preload will be accompanied by an associated increase in SV, which is proportional to the increased EDV. Secondly, pyruvate has been shown to augment cardiac mechanical function by increasing Gibbs free energy for ATP hydrolysis (ΔGATP) and enhanced Ca2+ cycling from the sarcoplasmic reticulum within the myocytes 8. Therefore, the timing of contractile functional imaging should occur very soon after HP injection to best capture the combined effects of volume overload and pyruvate’s inotropic effects. In addition, looking at the change in cardiac mechanical function from pre- to post-infusion may add valuable information that is complementary to metabolic imaging measures, by stimulating a mild stress response between healthy and diseased myocardium.Acknowledgements
No acknowledgement found.References
1. Doenst, T. et al. Decreased rates of substrate oxidation ex vivo predict the onset of heart failure and contractile dysfunction in rats with pressure overload. Cardiovasc. Res. 86, 461–70 (2010).
2. Atherton, H. J. et al. Role of pyruvate dehydrogenase inhibition in the development of hypertrophy in the hyperthyroid rat heart: a combined magnetic resonance imaging and hyperpolarized magnetic resonance spectroscopy study. Circulation 123, 2552–2561 (2011).
3. Dodd, M. S. et al. In vivo mouse cardiac hyperpolarized magnetic resonance spectroscopy. J. Cardiovasc. Magn. Reson. 15, 19 (2013).
4. Lau, A. Z., Miller, J. J., Robson, M. D. & Tyler, D. J. Simultaneous assessment of cardiac metabolism and perfusion using copolarized [1- 13 C]pyruvate and 13 C-urea. Magn. Reson. Med. 77, 151–158 (2017).
5. Lau, A. Z., Miller, J. J., Robson, M. D. & Tyler, D. J. Cardiac perfusion imaging using hyperpolarized (13)C urea using flow sensitizing gradients. Magn Reson Med 75, 1474–1483 (2016). 6. Josan, S. et al. In vivo investigation of cardiac metabolism in the rat using MRS of hyperpolarized [1-13C] and [2-13C]pyruvate. NMR Biomed. 26, 1680–1687 (2013).
7. Lee, H. B. & Blaufox, M. D. Blood volume in the rat. J. Nucl. Med. 26, 72–6 (1985).
8. Mallet, R. T., Olivencia-Yurvati, A. H. & Bünger, R. Pyruvate enhancement of cardiac performance: Cellular mechanisms and clinical application. Exp. Biol. Med. 243, 198–210 (2018).
9. Gordon, J. W., Niles, D. J., Adamson, E. B., Johnson, K. M. & Fain, S. B. Application of flow sensitive gradients for improved measures of metabolism using hyperpolarized (13) c MRI. Magn Reson Med 75, 1242–1248 (2016).
10. Niles, D. J. et al. Evaluation of renal metabolic response to partial ureteral obstruction with hyperpolarized13C MRI. NMR Biomed. 31, e3846 (2018).
11. Gordon, J. W., Niles, D. J., Fain, S. B. & Johnson, K. M. Joint spatial-spectral reconstruction and k-t spirals for accelerated 2D spatial/1D spectral imaging of 13C dynamics. Magn. Reson. Med. 71, 1435–1445 (2014).
Figures