2508
An Optimized PRESS Sequence for the Detection of 13C4-Glutamate at 9.4 T1Department of Oncology, University of Alberta, Edmonton, AB, Canada, 2Department of Medical Physics, Cross Cancer Institute, Edmonton, AB, Canada
Synopsis
Glutamate (Glu) incorporates 13C label on its C4 carbon (13C4-Glu) following a 13C-labelled glucose (Glc) infusion, resulting in a ≈2.51ppm proton “satellite” peak that provides an indirect measure of 13C4-Glu. Quantification of the satellite peak is complicated at short echo time (TE) due to overlap with the ≈2.49ppm N-acetylaspartate (NAA) peak. A PRESS, point resolved spectroscopy, (TE1, TE2) combination of (20ms, 106ms) was found to be suitable for resolving the ≈2.51ppm 13C4-Glu proton peak from that of NAA at 9.4T by exploiting differences in J-coupling evolution. The efficacy of the technique is verified on rat brain during a [U-13C6]-Glc infusion.
Introduction
Indirect 13C magnetic resonance spectroscopy (MRS) measures 13C signal through the coupled protons, exploiting the higher 1H sensitivity. Following a 13C-labelled glucose infusion, glutamate (Glu) incorporates 13C label on its C4 carbon (13C4-Glu), the time course of which provides a rate for the tricarboxylic acid cycle.1 A 3T short echo time (TE) 1H MRS point resolved spectroscopy (PRESS) sequence was used to measure 13C4-Glu indirectly, without the need for a 13C channel.2 This was achieved by measuring “satellite” peaks resulting from the ≈2.35 ppm 12C4-Glu proton resonance splitting into two (separated by ≈127Hz) due to heteronuclear J-coupling. The technique employs subtraction to eliminate overlapping signals. The field strength of 9.4T is used for preclinical studies of animal models. At 9.4T, the 13C4-Glu proton satellite peaks are at ≈2.19ppm and ≈2.51ppm. Their quantification is complex at short TE due to the ≈2.49ppm N-acetylaspartate (NAA) peak overlapping the ≈2.51ppm peak, and signals from the C3 Glu protons, N-acetylaspartylglutamate, 13C3-Glu, 13C2-GABA (γ-aminobutyric acid), and macromolecules overlapping the ≈2.19ppm peak. In this work, we find, at 9.4T, an optimal PRESS TE combination that retains sufficient ≈2.51ppm 13C4-Glu proton signal while suppressing overlapping ≈2.49ppm NAA signal by exploiting differences in J-coupling evolution. The ≈2.19ppm peak was not targeted for optimization because it is obscured by more signals. The technique resolves the ≈2.51ppm resonance without the need for subtraction editing. The efficacy of the optimized standard proton PRESS sequence is verified in vivo in rat brain during infusion of uniformly-labelled-13C-glucose ([U-13C6]-Glc).Methods
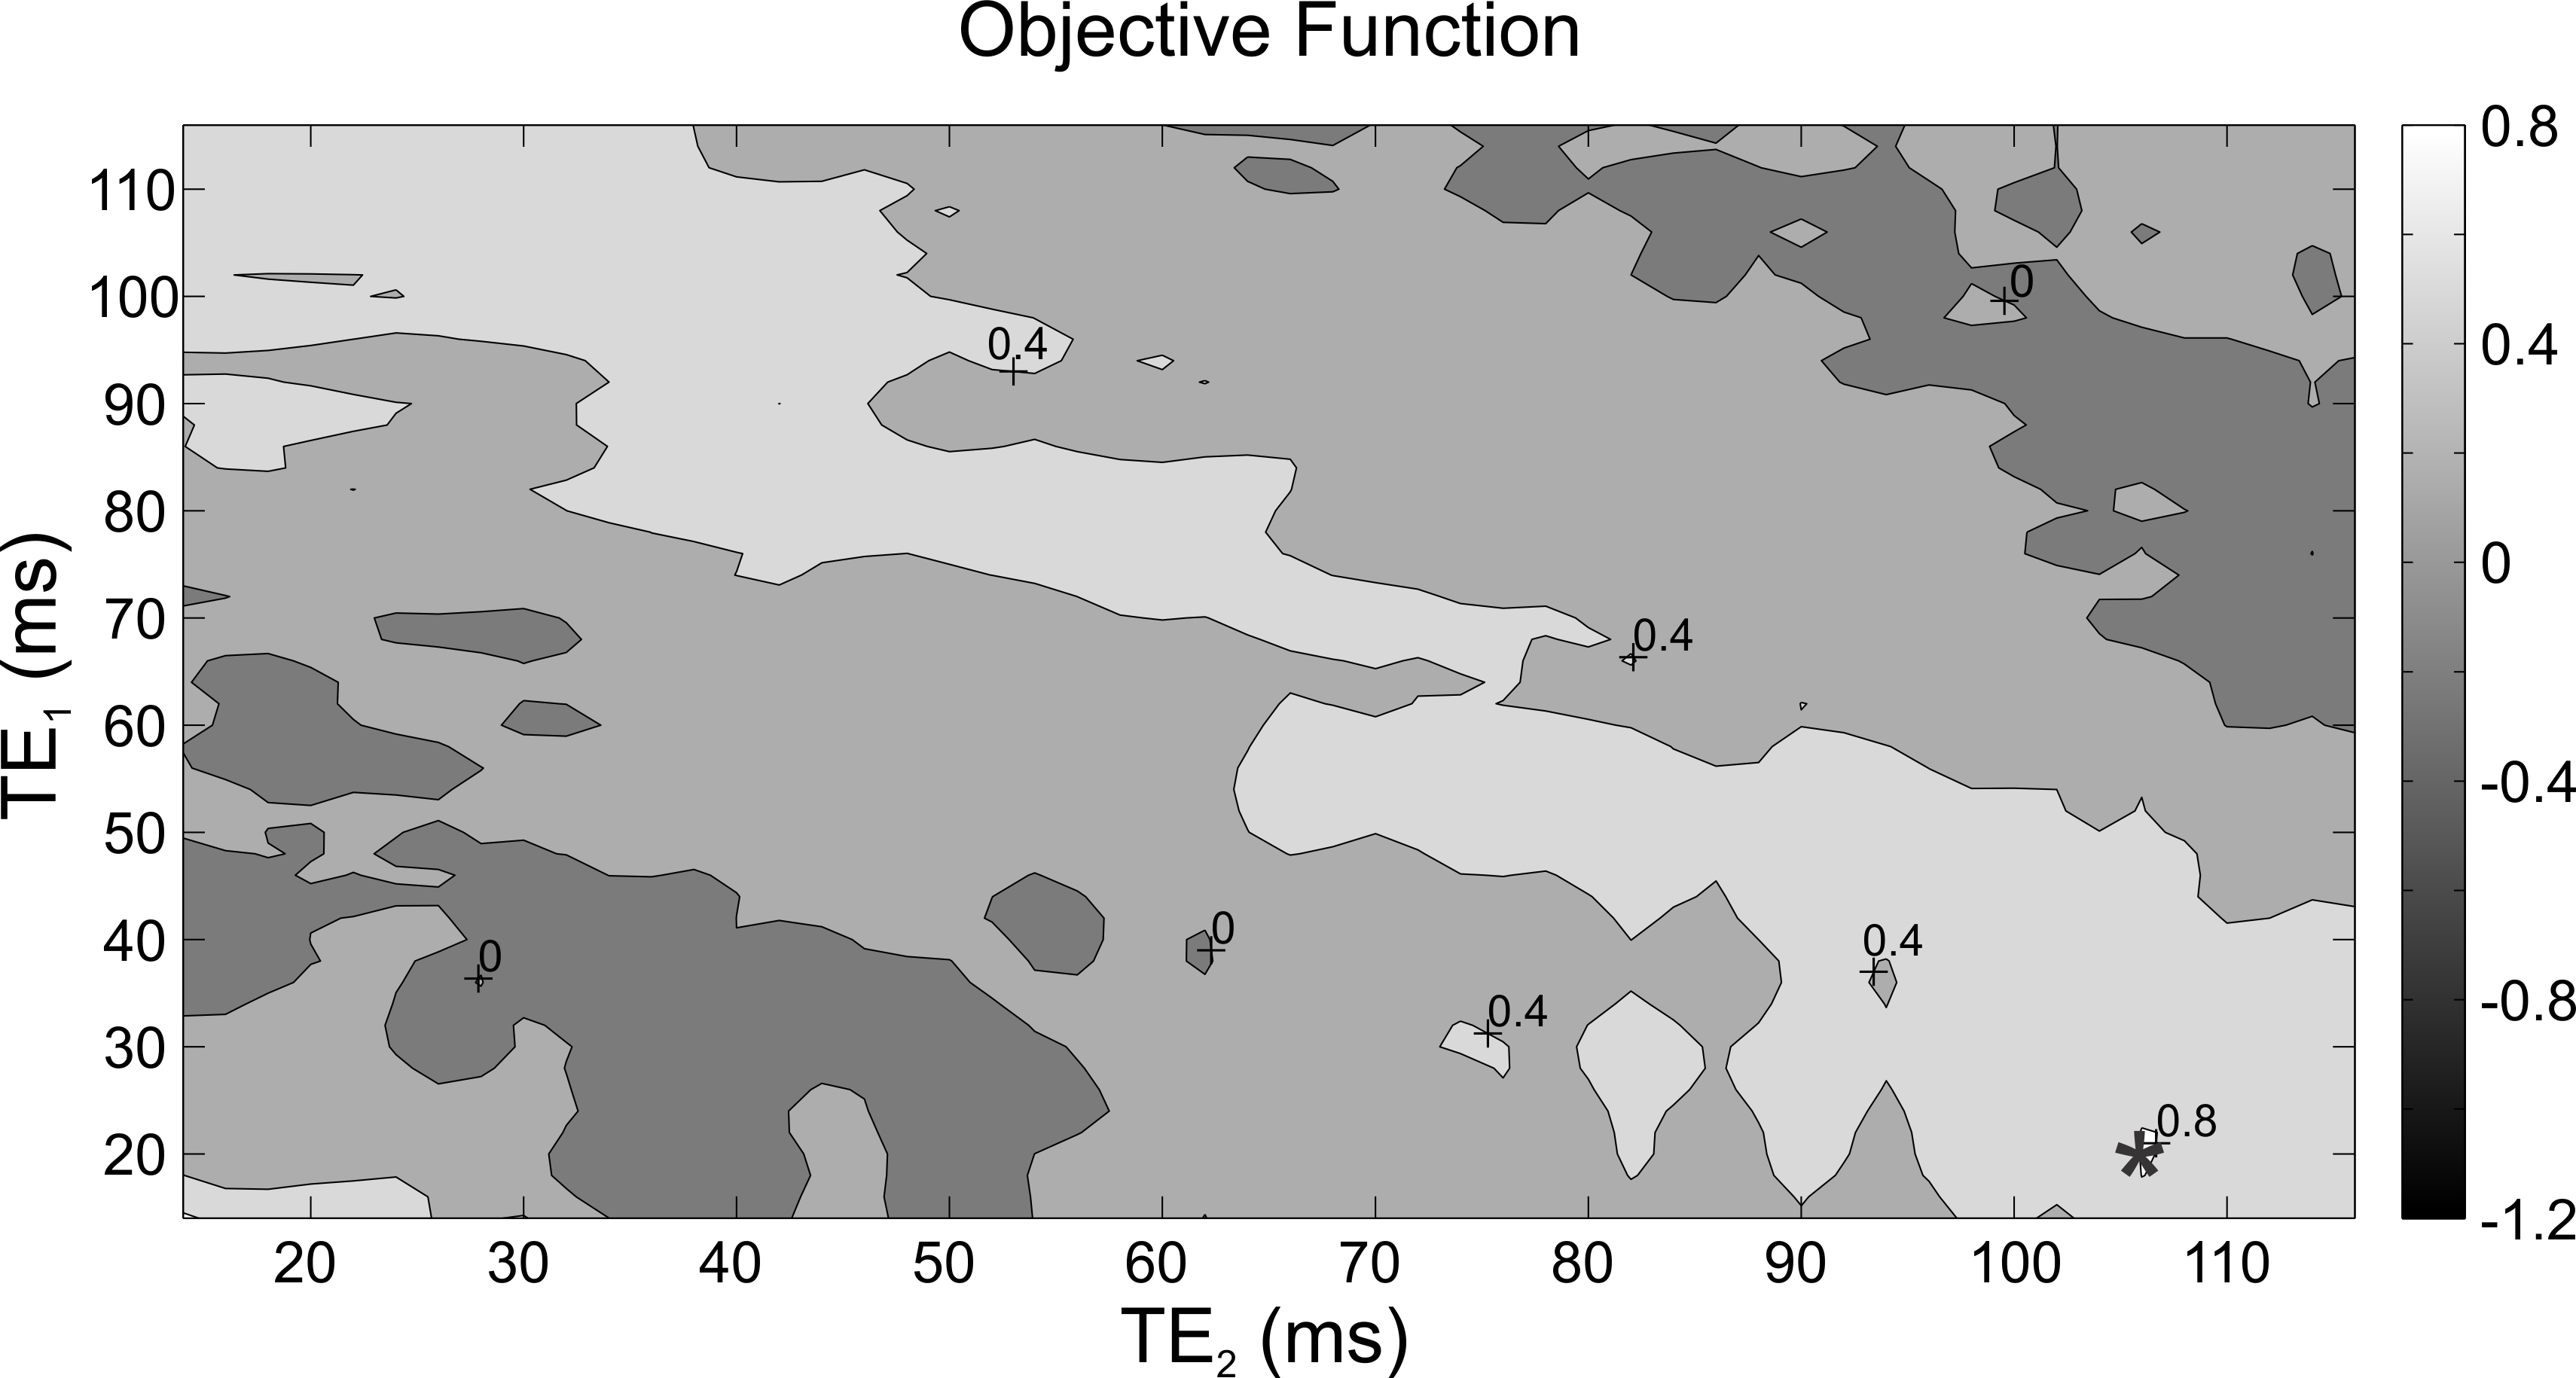
NAA, 13C4-Glu, glutamine (Gln), and Glu proton response as a function of PRESS TE1 and TE2 (2:130 ms in steps of 2ms) were calculated numerically.3,4 Normalized peak areas were found by integrating the signal in the 2.45-2.55ppm region and dividing it by the (TE1, TE2) of (2ms, 2ms) value. An objective function was created by subtracting the normalized peak area of NAA from that of 13C4-Glu.
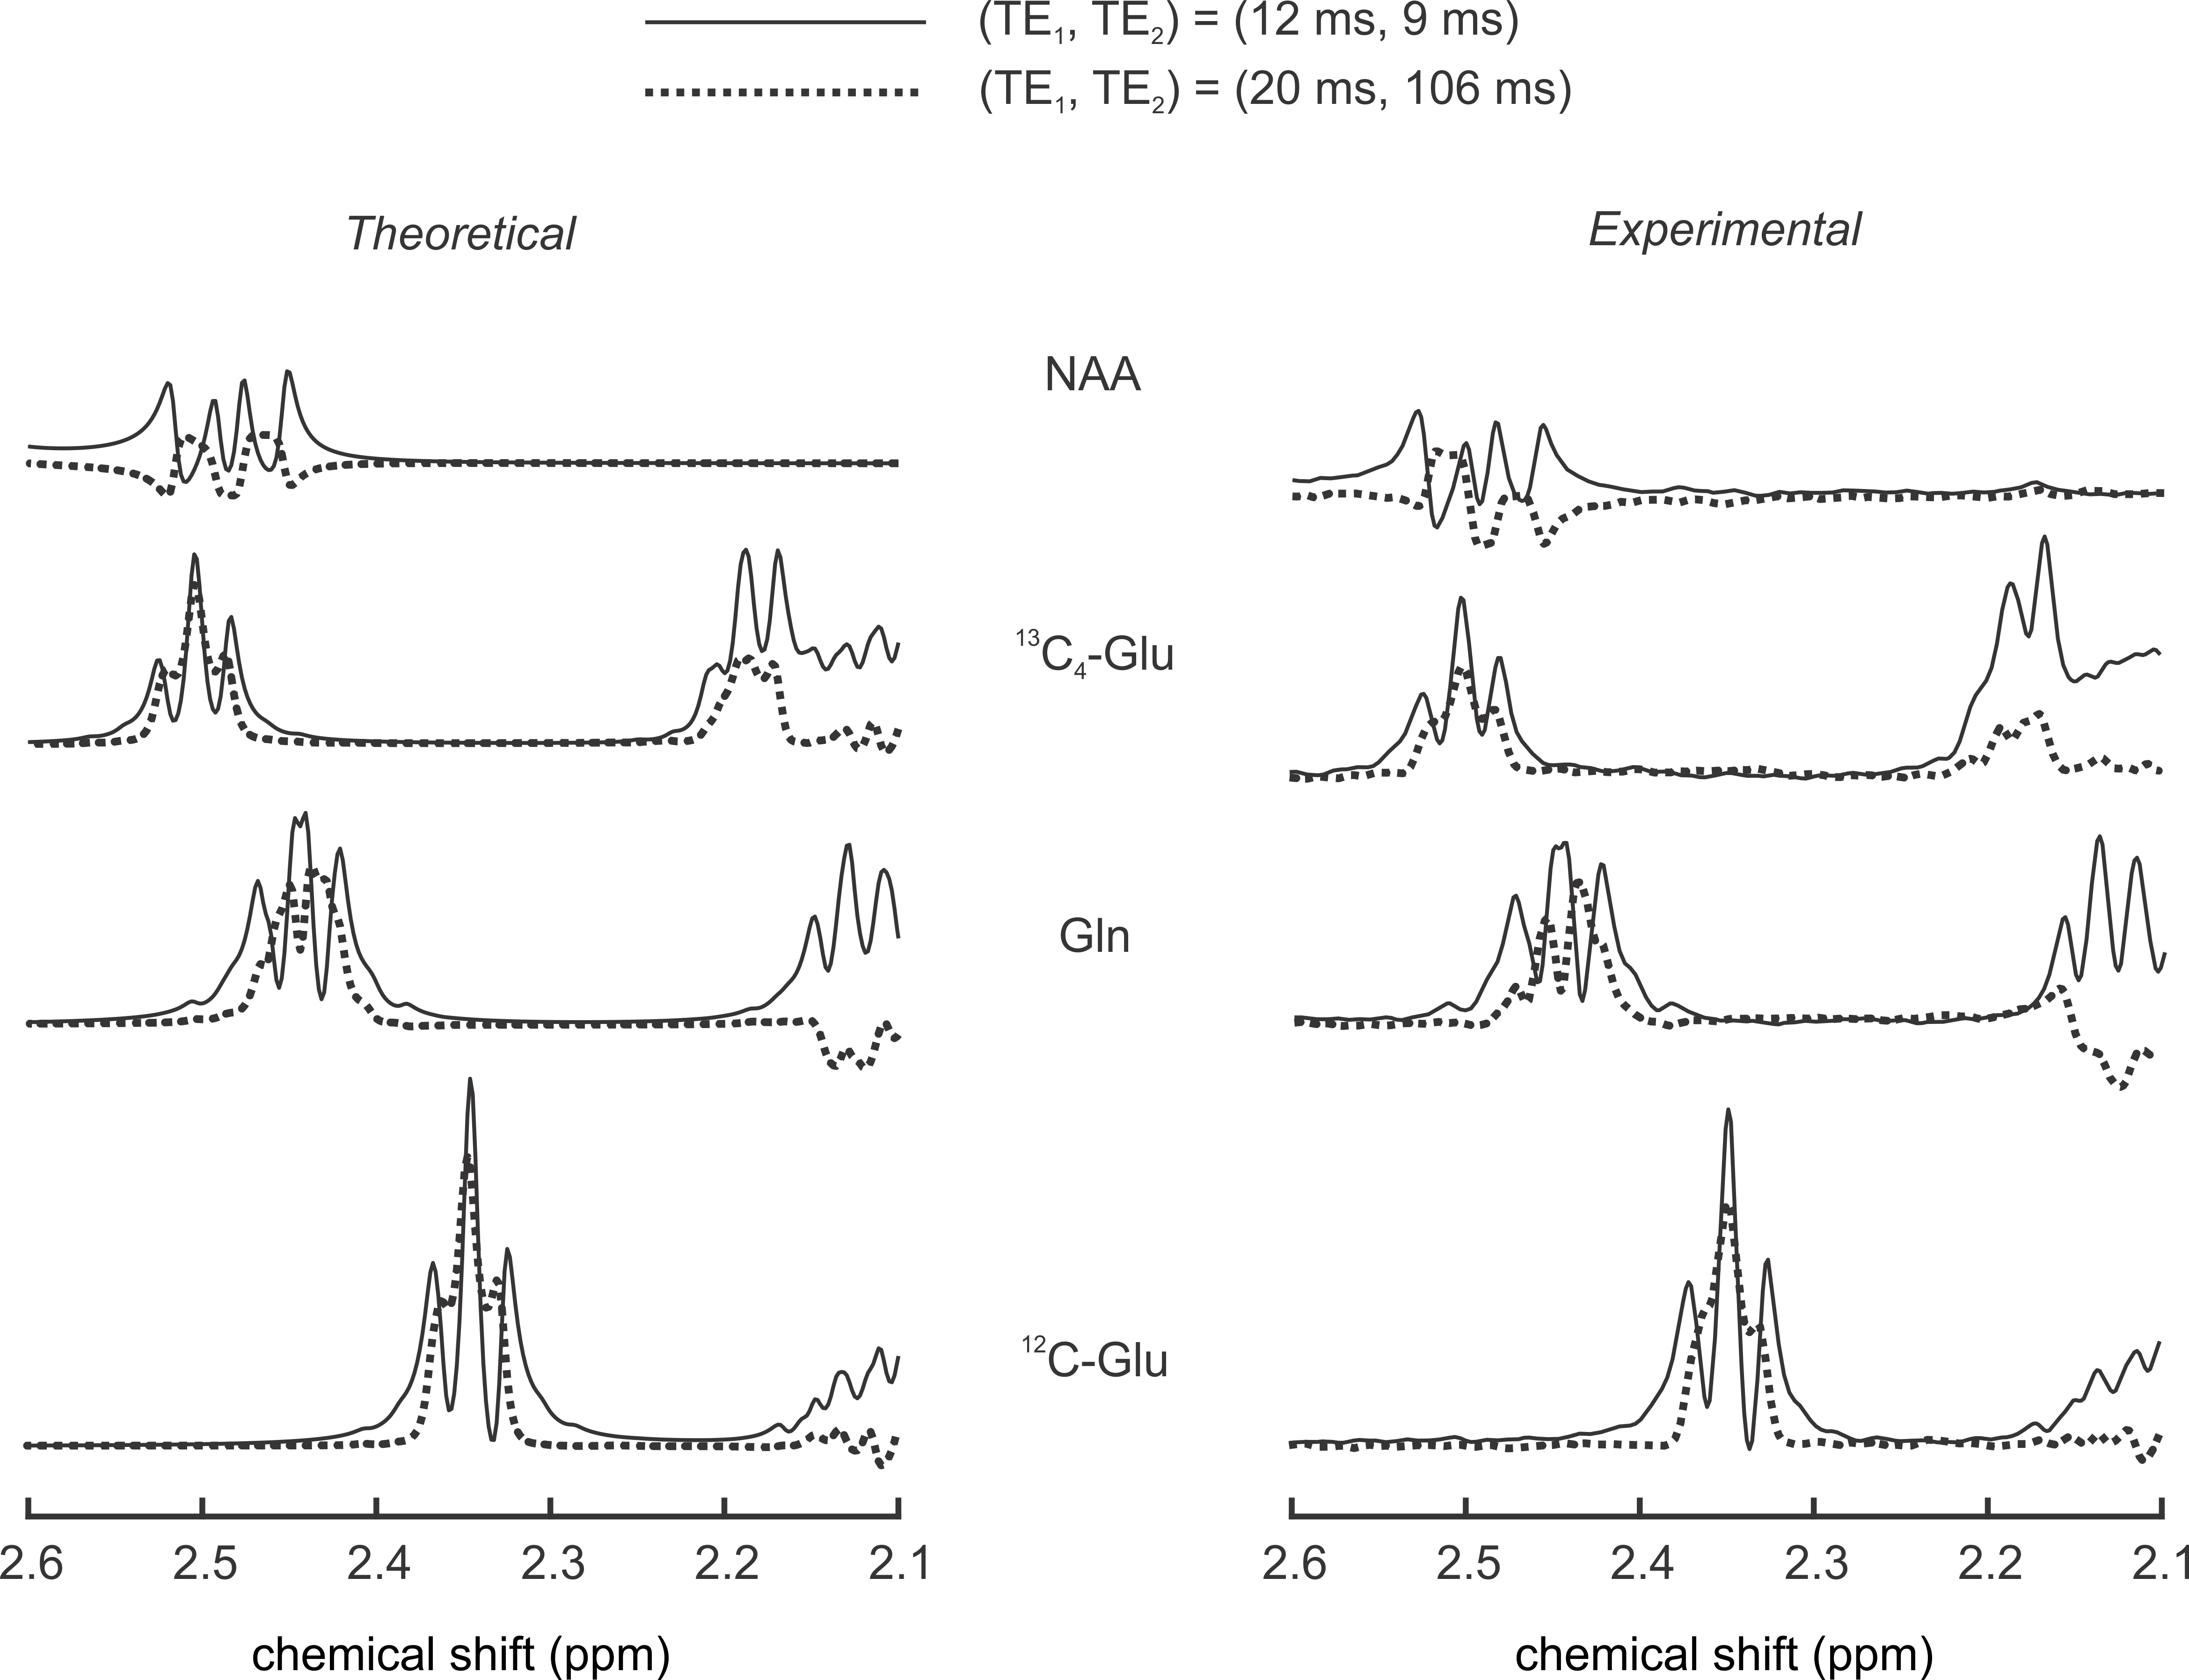
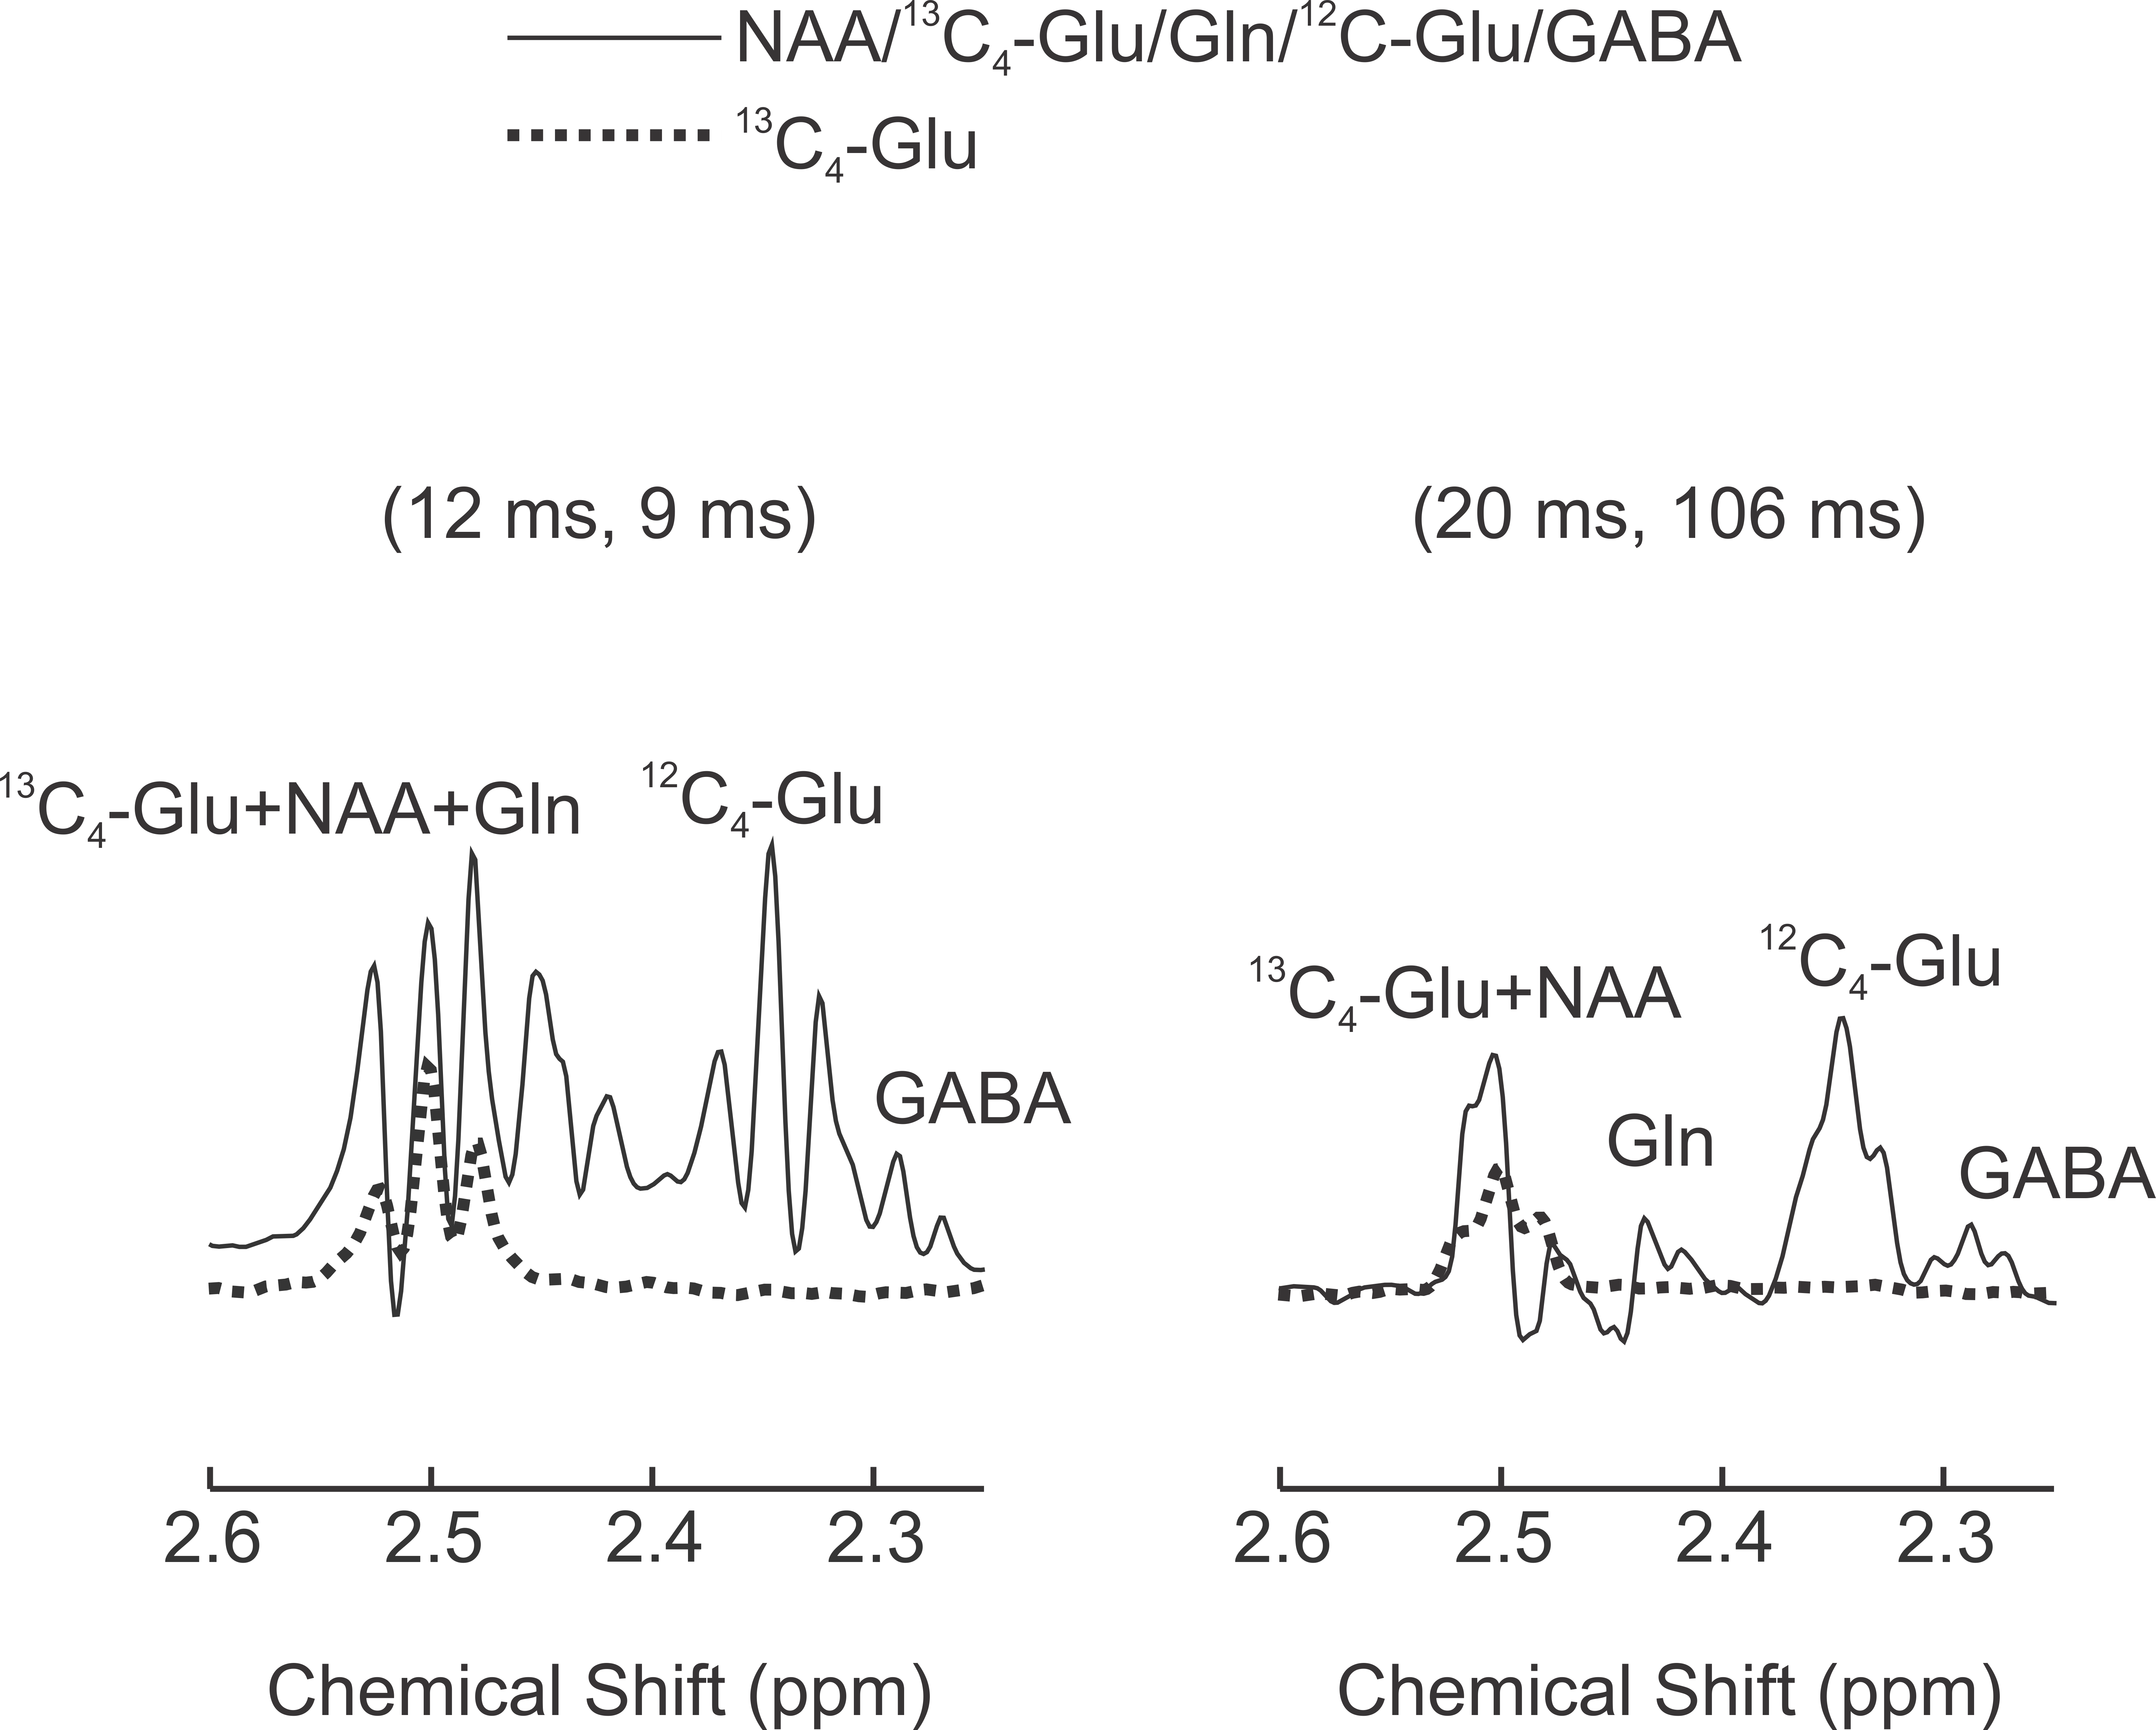
Spectra were acquired with a 9.4T, animal MRI scanner. A birdcage RF coil was used for phantoms while a surface coil was employed for in vivo scans. Phantom spectra were obtained from 50mM solutions of NAA, 99% enriched 13C4-Glu, Gln, and Glu. In addition, spectra were acquired from a phantom containing NAA, 13C4-Glu, Gln, Glu, and GABA, with concentration ratios found in vivo in rat brain.5 PRESS spectra were acquired with the determined optimal TE and with a short TE of (12ms, 9ms). Peak areas in the 2.45-2.55ppm region were found by direct integration.
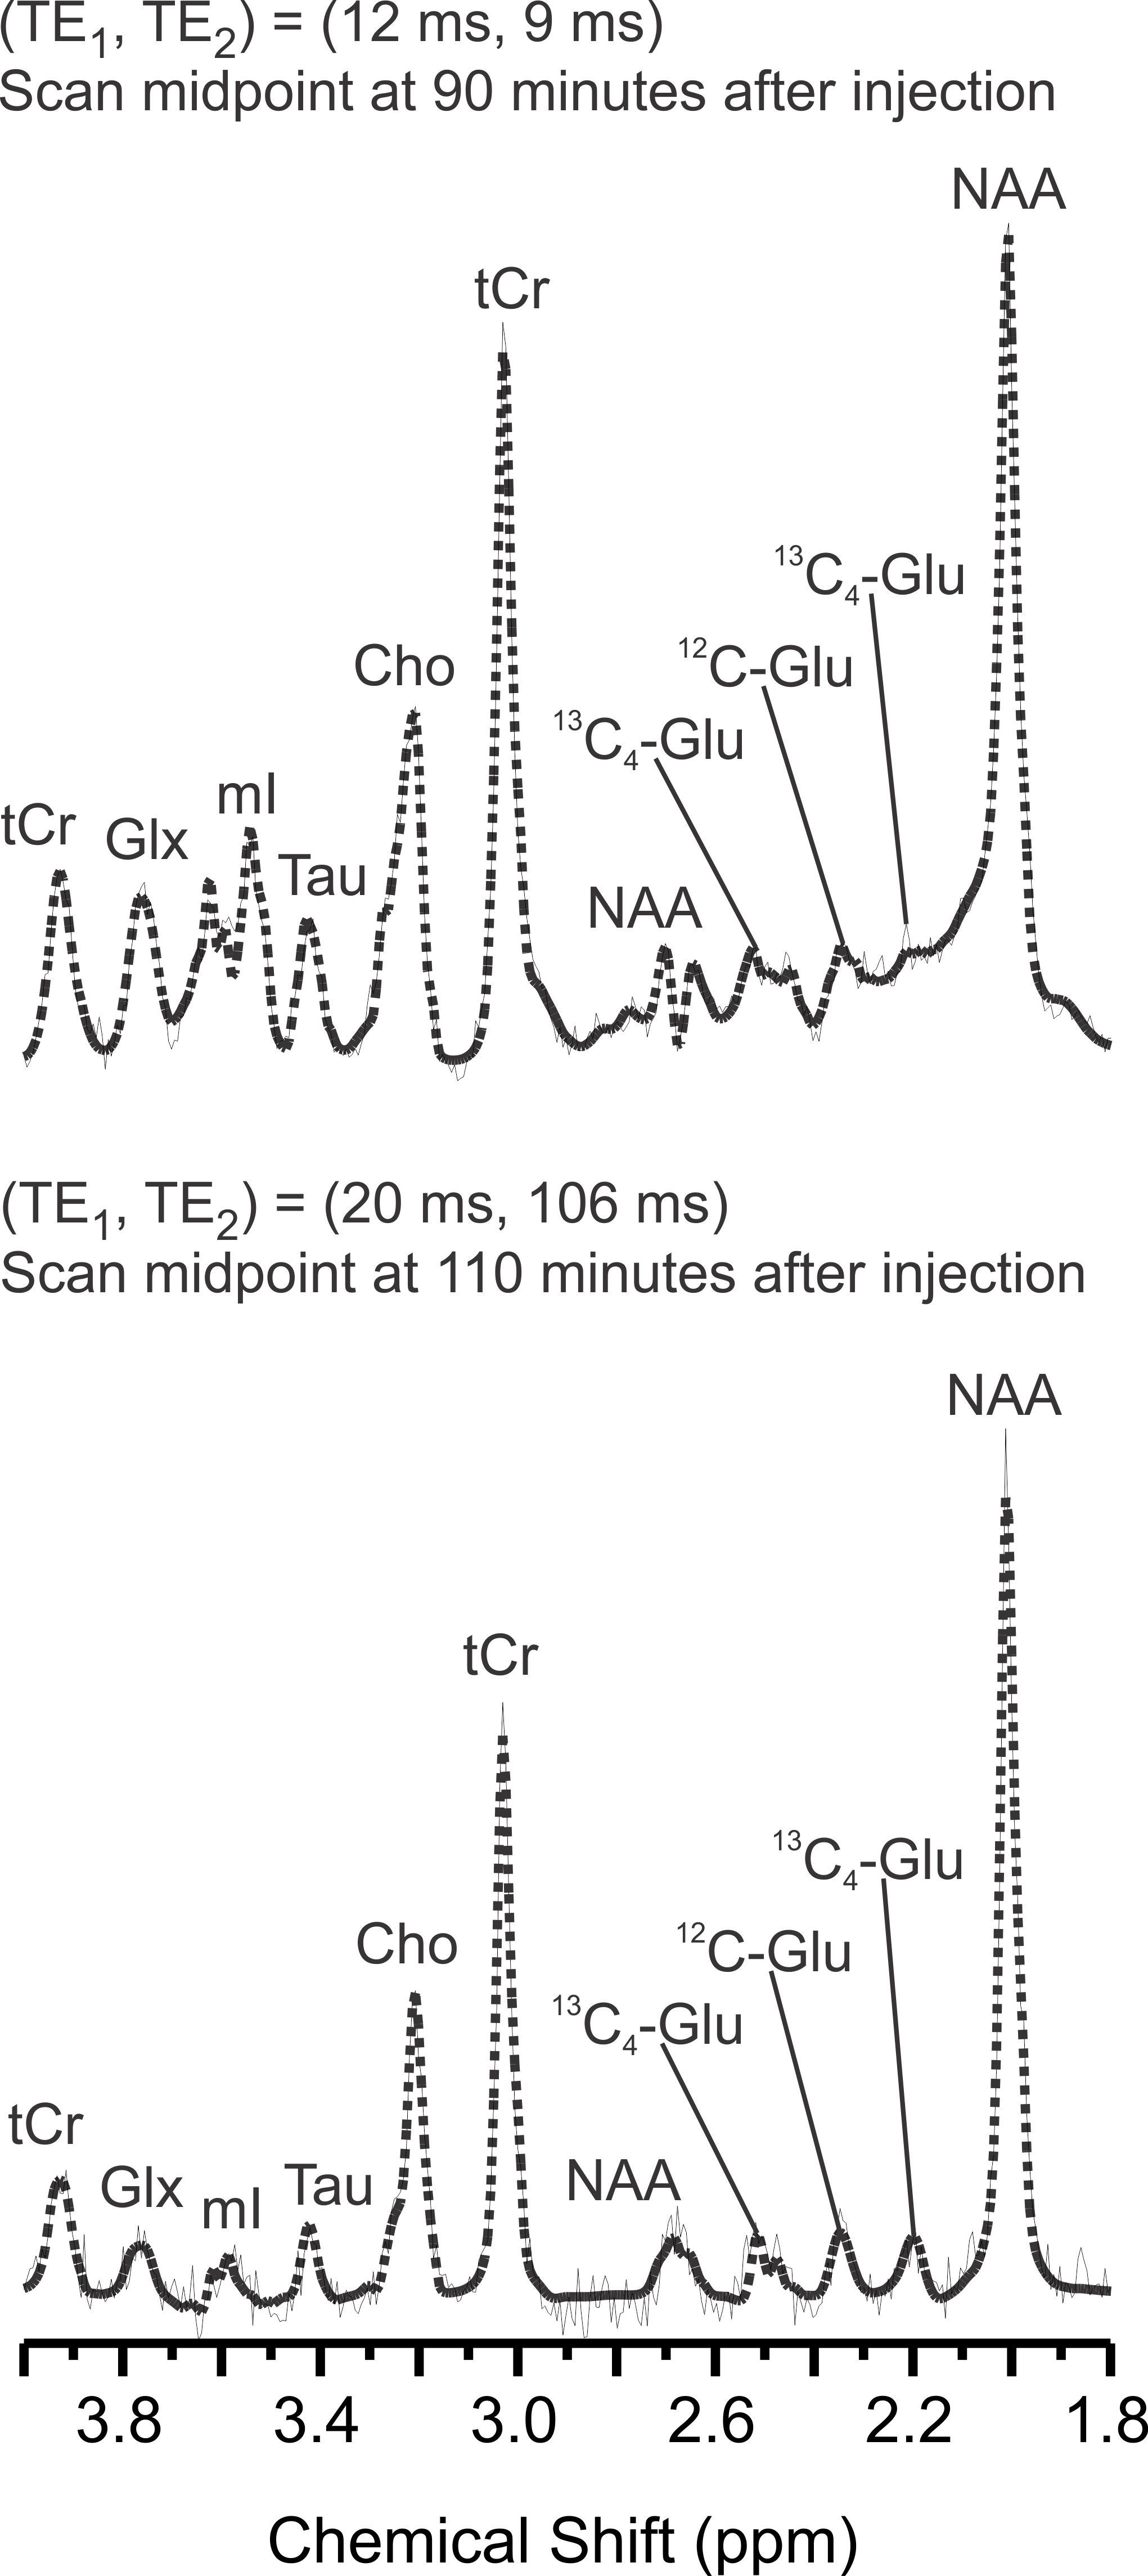
In vivo spectra were acquired in 256 averages with a repetition time of 3 s from the brains of two Sprague-Dawley rats during an infusion of 99% enriched [U-13C6]-Glc. Six spectra were obtained with the determined long TE, one pre-infusion and others at time points indicated in Figure 4 (times correspond to midpoint of acquisition). One (12ms, 9ms) short TE spectrum was also acquired post infusion. In vivo spectra were fit with LCModel 6 with numerically simulated basis sets.
Results
The optimal TE combination was determined to be (20ms, 106ms), which yielded an objective function value of 0.811 (Figure 1) and simulated peak areas of 58.7% and -2% for 13C4-Glu and NAA, respectively, relative to their corresponding (2ms, 2ms) values. Figure 2 demonstrates close agreement between calculated and experimentally acquired spectra. Figure 3 shows significant contamination of the ≈2.51ppm 13C4-Glu resonance from NAA and Gln in the short TE spectrum. The long TE spectrum shows a simplified peak in the region. The short TE peak area of the mixed phantom in the 2.45-2.55ppm spectral region was 176% higher than that of the phantom with 13C4-Glu alone. This value was reduced to 36% with the determined long TE value (LCModel is relied upon to account for residual NAA signal). Figure 4 shows LCModel fitted brain spectra from one of the rats during the 13C labelled glucose infusion; a clear peak at ≈2.51ppm with the optimal TE is visible. Spectra acquired throughout the experiment showed an increase in the 13C4-Glu satellite peaks, along with a decrease in the ≈2.35ppm 12C-Glu peak. Figure 5 shows short TE and optimal TE in vivo spectra. The contamination of 13C4-Glu is improved at the optimal TE, resulting in lower LCModel Cramér-Rao Lower Bounds of 7% and 8% for the two rats (compared to 15% and 23% obtained at short TE).Conclusion
A PRESS (TE1, TE2) combination of (20ms, 106ms) is suitable for resolving the ≈2.51ppm 13C4-Glu proton peak from that of NAA at 9.4T. The technique can be used for quantifying 13C4-Glu in rat brain during a [U-13C6]-Glc infusion.Acknowledgements
We gratefully acknowledge the Natural Sciences and Engineering Research Council of Canada (NSERC) for grant funding.References
1. Henry, P. G., Lebon, V., Vaufrey, F., et al. (2002). Decreased TCA cycle rate in the rat brain after acute 3‐NP treatment measured by in vivo 1H‐{13C} NMR spectroscopy. Journal of neurochemistry, 82(4), 857-866.
2. Boumezbeur, F., Besret, L., Valette, et al. (2004). NMR measurement of brain oxidative metabolism in monkeys using 13C‐labeled glucose without a 13C radiofrequency channel. Magnetic Resonance in Medicine, 52(1), 33-40.
3. Yahya, A., & Allen, P. S. (2005). Effect of strong homonuclear proton coupling on localized 13C detection using PRESS. Magnetic resonance in medicine, 54(6), 1340-1350.
4. Thompson, R. B., & Allen, P. S. (1999). Sources of variability in the response of coupled spins to the PRESS sequence and their potential impact on metabolite quantification. Magnetic Resonance in Medicine, 41(6), 1162-1169.
5. Pfeuffer, J., Tkáč, I., Provencher, S. W., et al. (1999). Toward an in vivo neurochemical profile: quantification of 18 metabolites in short-echo-time 1H NMR spectra of the rat brain. Journal of magnetic resonance, 141(1), 104-120.
6. Provencher, S. W. (1993). Estimation of metabolite concentrations from localized in vivo proton NMR spectra. Magnetic resonance in medicine, 30(6), 672-679.
Figures