2503
Dependence of 31P MRS Redox Ratio on T1 Saturation1National Institutes of Health, Bethesda, MD, United States
Synopsis
31P measurement of the oxidized (NAD+) and reduce form (NADH) of nicotinamide adenine dinucleotide has been applied to in vivo assessment of the redox state of the brain. Since uridine diphosphate glucose (UDPG) overlaps with the nicotinamide adenine dinucleotide peaks we examined the effect of changes in the relative intensities of the UDPG basis components on quantification of the redox ratio. We found that the fitted redox ratio is significantly dependent on the UDPG basis whose chemically distinct components are subject to different T1 saturation effect in vivo.
Introduction
In vivo measurement of the oxidized (NAD+) and reduce form (NADH) of nicotinamide adenine dinucleotide in human brain at high fields has become a new approach to study brain redox state.1-4 Because 31P signals of NAD+ and NADH overlap each other to a large extent, dedicated spectrum fitting methods have been developed to determine the redox ratio ([NAD+]/[NIDH], RR).1-4 Recently, uridine diphosphate glucose (UDPG) has also been included into the fitting for measuring RR because of its significant contribution to the total NAD signals.5-7 The goal of this study is to evaluate the effect of T1 saturation on quantification of phosphate metabolite signals and especially on the feasibility of measuring RR.Methods
31P spectra of human brain were acquired using Siemens 3T and 7T scanners. 3T and 7T coils were built in-house, each includes a 7-cm i.d. 31P surface coil and a shielded quadrature half-volume proton coil. 31P spectra of the occipital lobe of healthy human subjects were acquired using an excite-acquire sequence. 3T spectra (n=6) were acquired with TR = 2 s, NA = 128 and TR = 25 s, NA = 64. 7T spectra (n=5) were acquired with TR = 3 s, NA = 64 and TR = 30 s, NA = 32.
jMRUI8 and Amares9, 10 were used to fit 7T spectra to calculate RR. a-ATP was fitted by two peaks, NADH by a single peak, NAD+ by four peaks and UDPG by four peaks. The width of all line components was set equal. The a-ATP signal was used as an internal reference to normalize NAD+, NADH and UDPG. Chemical shifts and relative signal amplitudes of NAD+ and NADH were obtained from the literature1,10. The relative amplitudes of the four UDPG components were assigned either to our phantom results (0.77, 0.97, 1.0, and 0.96 acquired at TR = 3 s) or to equal values (1.0, 1.0, 1.0, and 1.0). To evaluate T1 saturation effect on PCr, LCModel11 was used to fit all metabolites. The saturation effect was quantified by comparing PCr/total-ATP and PCr/total phosphate at long TR with respect that at short TR. The same comparison was performed for other 31P metabolites.
Results
Fig. 1 shows jMRUI fitting of a spectral region containing a-ATP, NAD+, NADH and UDPG acquired at 7T (TR = 3 s). Fig. 2 show the fitting results from all subjects. Arrows show changes of fitted mean values due to changes of UDPG basis amplitudes from phantom values to equal amplitudes. Black lines are for TR = 3s and red for TR = 30 s. Fig. 2a shows that NADH/a-ATP is sensitive to assumed UDPG basis values. Although RR appears less dependent on TR (Fig. 2c), its high sensitivity on the assumed UDPG basis values makes it highly dependent on the shape of the UDPG basis.
Fig 3 shows 3T spectra (NA = 128) at TR = 2 s (A) and TR = 25 s (B); and 7T spectra (NA = 64) at TR = 3 s (C) and TR = 30 s (D). LCModel fitting of a typical 7T spectrum is shown in Fig 4 where all 31P metabolites were included except UDPG. The ratios of metabolites (e.g. PCr/total-ATP and PCr/total-phosphate) at short and long TRs were calculated for each subject. The results are listed in Table 1.Discussion
Overall, our fitting results show that the relative signal intensities of NADH (Fig 2a) at long and short TR values are consistent for individual volunteers and higher for long TR values. They were markedly affected by changes in the UDPG amplitude ratios. NAD+ (Fig 2b) showed less consistency with respect to changes in TR values. UDPG showed no significant changes with the two different TR values. In contrast, PE had the largest relative signal increase at longer TR, which is consistent with its very long T1.12 In general, the average RR values in Fig. 2c at either TR value was in agreements with previous reports3-6.Conclusion
Since uridine diphosphate glucose (UDPG) overlaps with the total NAD signals it is necessary to consider it in measuring RR. Although RR appears less dependent on T1 saturation, its high sensitivity to the assumed relative signal intensities of the peaks in the UDPG basis makes it highly dependent on all changes in basis signals (T2 relaxation, T1 saturation with possible intramolecular differences, and amplitude ratios of its components).Acknowledgements
This work is supported by the Intramural Program of National Institute of Mental Health .References
1. Lu M, Zhu XH, Zhang Y, et al. Intracellular redox state revealed by in vivo 31P MRS measurement of NAD+ and NADH contents in brains. Magn. Reson. Med. 2014;71:1959-1972.
2. Zhu XH, Lu M. Lee BY, et al. In vivo NAD assay reveals the intracellular NAD contents and redox state in healthy human brain and their age dependences. PANS 2015;112:2876-2881.
3. Lu M, Zhu XH, Chen W. In vivo 31P assessment of intracellular NAD metabolites and NAD+/NADH redox state in human brain at 4 T. NMR Biomed. 2016;29:1010-1017.
4. Chouinard VA, Kim SY, Valeri L, et al. Brain Bioenergetics and redox state measured by 31P magnetic resonance spectroscopy in unaffected siblings of patients with psychotic disorders. Schizophrenia Research. 2017;187:11-16.
5. de Graaf RA, De Feyter HM, Brawn PB et al. Detection of cerebral NAD+ in humans at 7T. Magn. Reson. Med. 2017;78:828-835.
6. Kim SY, Cohen BM, Chen Xi, et al. Redox dysregulation in schizophrenia revealed by in vivo NAD+/NADH measurement. Schizophrenia Bulletin. 2017;43:197-204.
7. Xin L, Ipek O, Beaumont M, et al. Nutritional ketosis increases NAD+/NADH ratio in healthy human brain: an in vivo study by 31P MRS. Frontiers in Nutrition. 2018; doi: 10.3389/fnut.2018.00062
8. Naressi A, Couturier C, Devos JM, et al. Java-based graphical user interface for the MRUI quantitation package. MAGMA 2001;12:141-153.
9. Vanhamme L, van den Boogaart A, Van Huffel S. Improved method for accurate and efficient quantification of MRS data with use of prior knowledge. J. Magn. Reson. 1997; 129: 35–43.
10. Deelchand DK, Nguyen TM, Zhu XH, et al. Quantification of in vivo 31P NMR brain spectra using LCModel. NMR Biomed. 2015; 28: 633–641
11. Provencher SW. Estimation of metabolite concentrations from localized in vivo proton NMR spectra. Magn. Reson. Med. 1993;30:672-679.
12. Ren J, et al. 31P-MRS of healthy human brain: ATP synthesis, metabolite concentrations, pH, and T1 relaxation times. NMR Biomed. 2015;28:1455-1462.
Figures
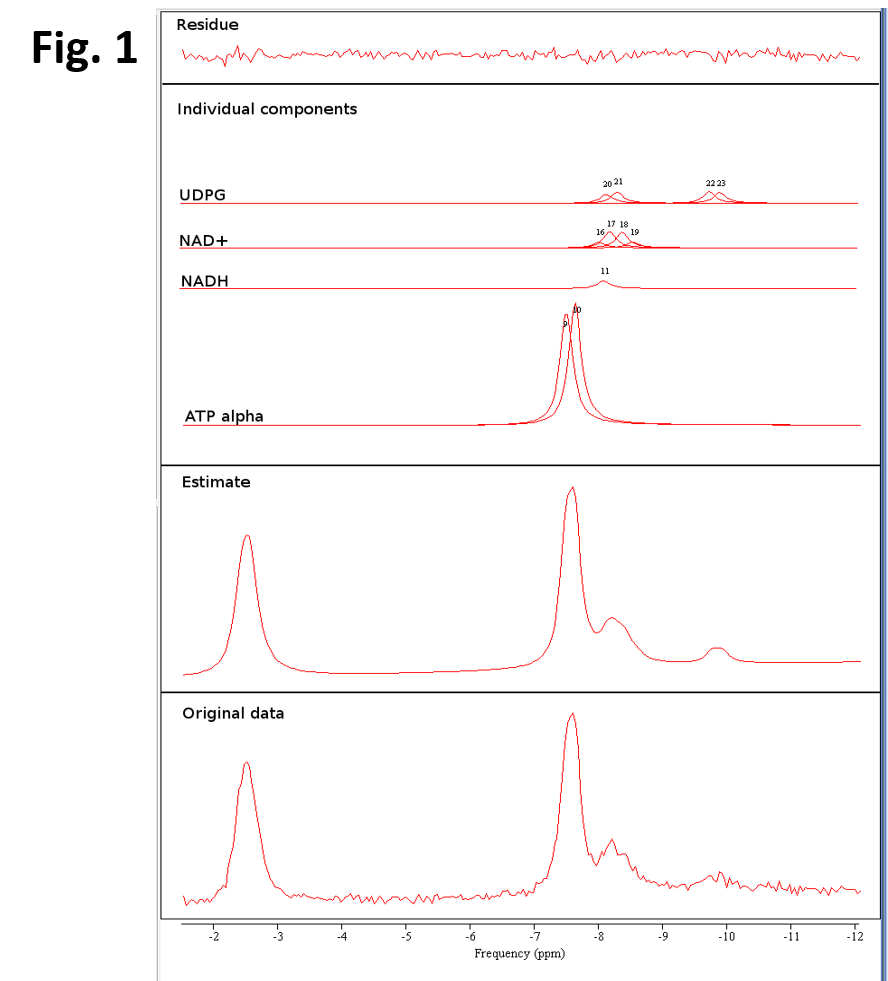
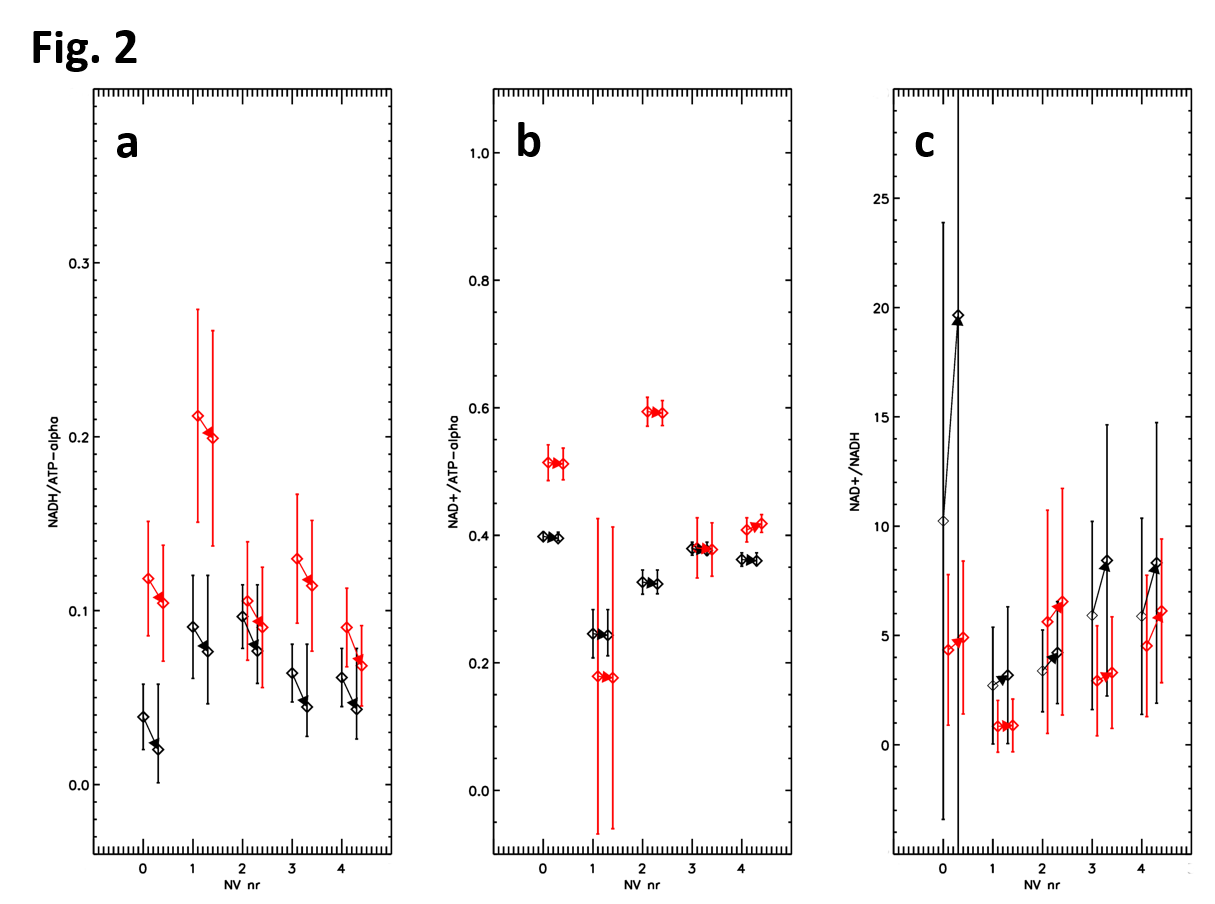
Fig. 2 Fitting results (n= 5) for NAHD/a-ATP (a, left), NAD+/a-ATP (b, middle) and NAD+/NADH (c, right) with two UDPG amplitude sets and two TR values. Black: TR = 3 s; Red: TR = 30 s. Arrows show changes of mean due to changes in UDPG amplitude from phantom values (0.77, 0.97, 1.0, and 0.96) to equal amplitude (1.0, 1.0, 1.0, and 1.0).
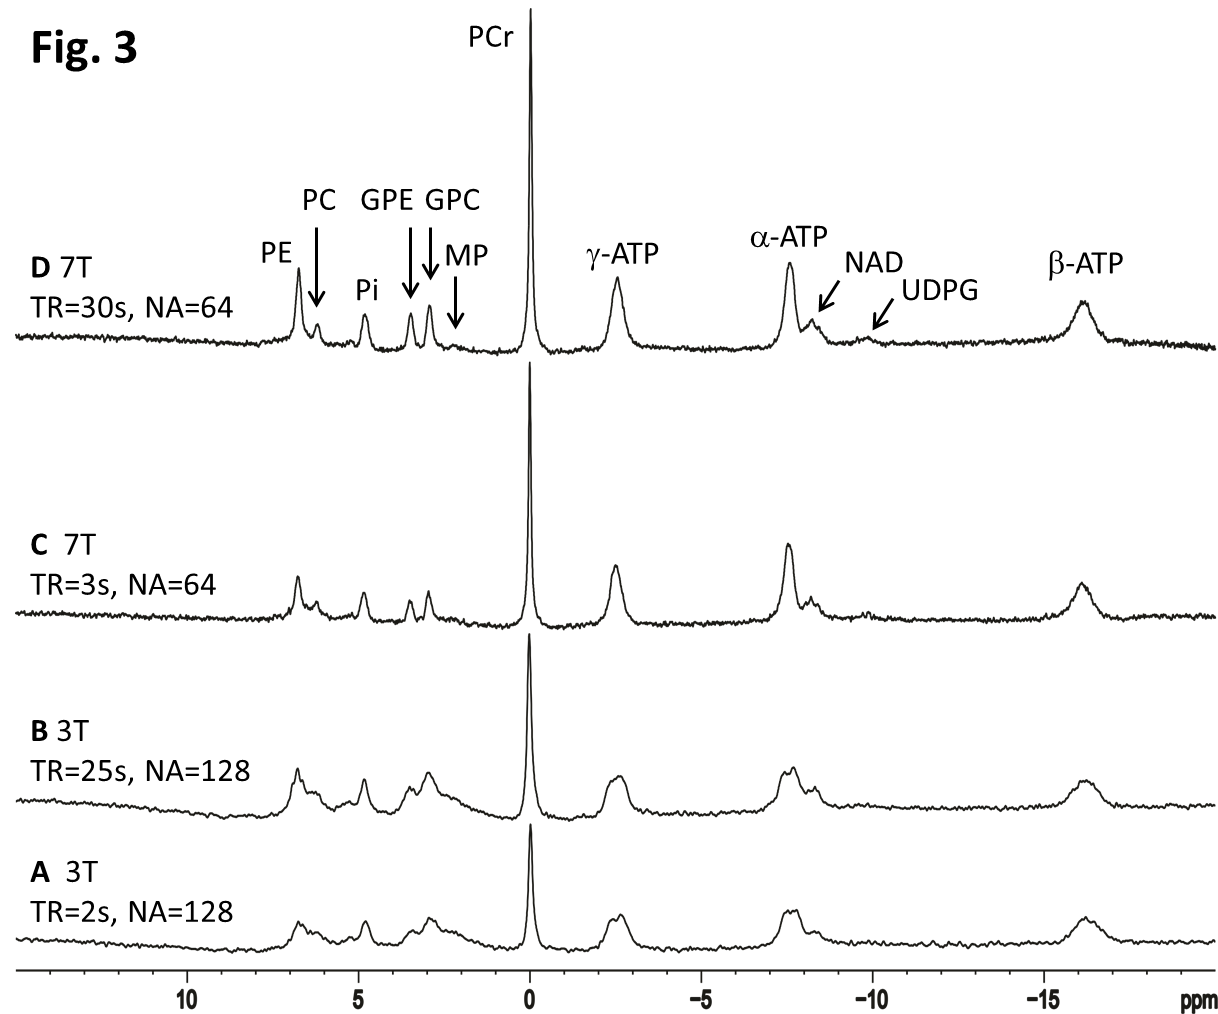
Fig. 3. (A) and (B) were acquired at TR = 2 s and TR = 25 s (B), respectively, at 3 T. (C) and (D) were acquired at TR = 3 s and TR = 30 s, respectively, at 7 T. PCr: phosphocreatine, PE: phosphoethanolamine, PC: phosphocholine, Pi: inorganic phasphate, GPE: glycerophosphosethanolamine, GPC: glycerophosphocholine, MP: macromolecualr phosphate, g-, a-, b-ATP: g-, a- b-adenosine triphosphate, NAD: nicotinamide adenine dinucleotide, UDPG: uridine diphosphate glucose.
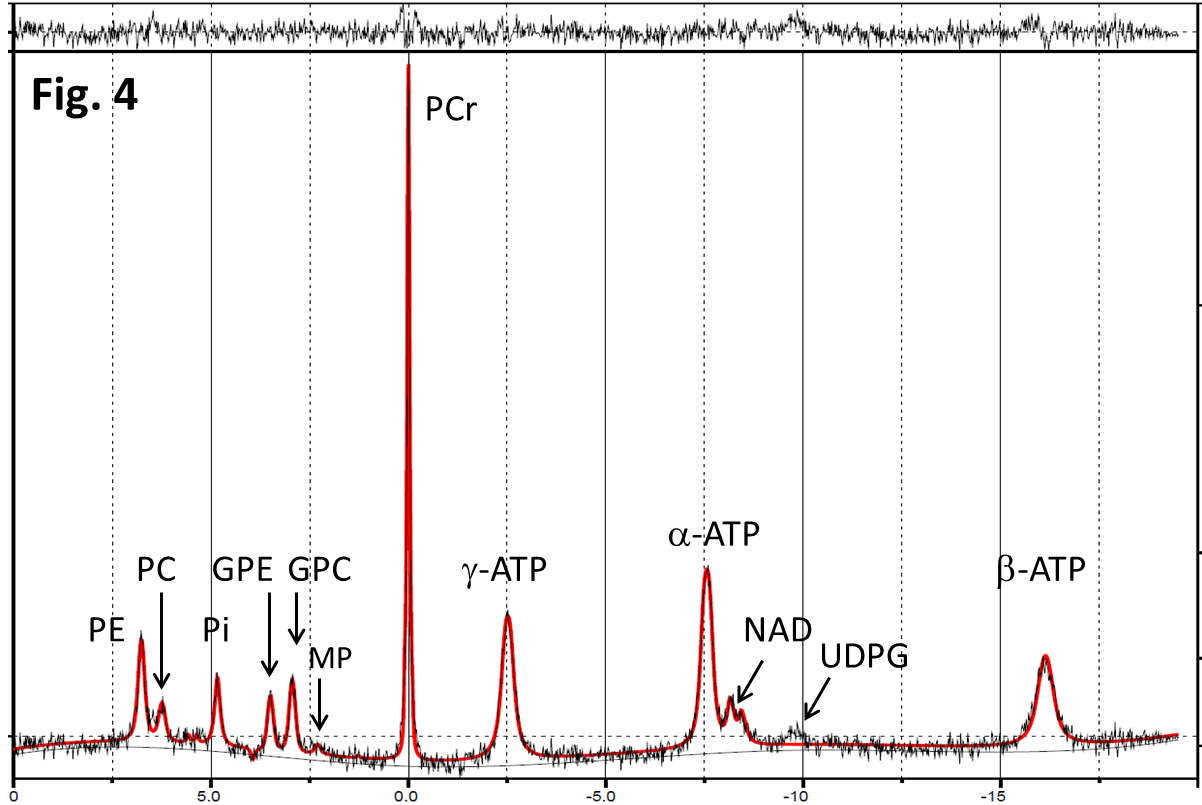

Table 1. T1 Saturation effect on 31P metabolites measured by relative ratios of metabolite to total ATP and total phosphate at short and long TRs.