2502
Dynamic 31P-MRSI of Human Calf Muscles using Compressed Sensing and a Low Rank ReconstructionAlejandro Santos Diaz1,2, Diana Harasym1,2, and Michael Noseworthy1,2,3
1School of Biomedical Engineering, McMaster University, Hamilton, ON, Canada, 2Imaging Research Center, St. Joseph's Healthcare, Hamilton, ON, Canada, 3Electrical and Computing Engineering, McMaster University, Hamilton, ON, Canada
Synopsis
Dynamic 31P-MRSI experiments require temporal resolution on the order of seconds to concurrently assess metabolic change in different muscles. In this study we developed a pulse sequence using a flyback-EPSI readout combined with compressed sensing (CS) to achieve a 9 second temporal resolution and tested it in 11 healthy volunteers during an exercise-recovery challenge of the lower leg muscles. Our results showed that the sequence was capable of assessing PCr depletion/recovery and intracellular pH at rest and following exercise, of multiple muscle groups simultaneously, using a clinical 3T MR system.
Introduction
Phosphorus magnetic resonance spectroscopy and spectroscopic imaging (31P-MRS/MRSI) are non-invasive methods capable of assessing in vivo skeletal muscle energy metabolism. Further to the analysis of resting spectra, metabolic studies can be performed in a dynamic fashion through an exercise-recovery challenge and thus assess mitochondrial function1,2. Such experiments require temporal resolution on the order of seconds to concurrently assess different muscles. In this this study we developed a highly accelerated 31P-MRSI sequence combining flyback-EPSI and compressed sensing capable of tracking dynamic calf muscle metabolism.Methods
All experiments were performed using a 60cm bore 3T GE MR750 (GE Healthcare, Milwaukee, WI) scanner and home-designed undersampled pulse sequence built on a flyback-EPSI sequence3 (fig.1). The compressed sensing approach was implemented through the inclusion of pseudo-randomly distributed blips in the ky direction during the flyback readout to sample multiple ky-kt lines within the same phase encoding step4,5,thus achieving a temporal resolution of 9 seconds. The Flyback-EPSI trajectory was designed to achieve 2.25x2.25cm2 resolution over an 18x18cm2 field of view (i.e.8x8 voxels), using 1420Hz spectral bandwidth and 512 points. The sub-sampling scheme was designed to acquire an entire 2D-MRSI dataset (one frame) using three excitations. Dynamic experiments were performed in 11 healthy volunteers through an exercise-recovery challenge using a home made ergometer6 and an in-house designed/built 31P-tuned (51.705 MHz), 7.62cm diameter surface coil matched specifically for calf muscles. During the experiment, volunteers were lying on the ergometer in a supine position with the coil placed below the right gastrocnemius. The region of interest was shimmed on a set of T2-weighted proton images used as anatomical reference. The dynamic protocol consisted of 16 baseline frames at rest (9sec x 16 = 2.4 minutes, TR=1.5s), followed by three minutes of plantar flexion with a frequency of 0.5Hz, extended knee and acting on a load of 40%-50% maximum voluntary contraction (MVC). Subsequently, 32 frames (4.8 minutes) were acquired during recovery with no acquisition during the exercise. Slice thickness, number of averages and flip angle were set to 4cm, 2 and 40°, respectively. All data processing and reconstruction was performed using MATLAB R2015b (The Mathworks, Natick, MA, USA) as follows. First, data were re-shaped from the raw blipped acquisition to a 4D matrix of k-space data with dimensions kt-kx-ky-#frame. The missing k-space samples were determined using a modified 2D implementation of an iterative low-rank Hankel matrix completion reconstruction algorithm7. To assess metabolism of different muscle groups, four voxels were selected an analyzed containing mostly tissue from the gastrocnemius lateralis (GL), gastrocnemius medialis (GM), soleus (SOL) and a mixture of muscles (MIX). Spectral fitting was performed using the OXSA toolbox8. Values for the time constant of PCr recovery rate (τPCr), PCr drop percentage (dPCr) and intracellular pH at rest (pHrest) and the end of exercise (pHend) were calculated. Statistical analysis was performed to compare dPCr and pH values.Results
Fig.2 depicts an example of different muscle groups analyzed and the evolution of the fitted amplitudes for PCr and Pi signals. The visually different metabolic responses stress the importance of spatial localization in these types of experiments. A statistically significant difference was found between the percent PCr drop of SOL when compared to GM, GL and MIX but not between the later three. Sample spectra for each muscle group taken during baseline and end of exercise are depicted in figs.3a-d. Fig.3e shows spectra acquired over time during baseline and recovery for the GM, where the PCr depletion is clearly depicted. Fig.4 summarizes the results of the exercise-recovery experiment including the calculated values for pHi (pHrest and pHend) and τPCr.Discussion
In this study we present a highly accelerated 31P-MRSI pulse sequence capable of simultaneously tracking the exercise-induced evolution of PCr and intracellular pH, within multiple muscle groups using a clinical field strength (3T). Our sequence was capable of assessing multiple muscle groups simultaneously as shown in the results of figs2-4. Calculated values for τPCr and pHi are in agreement with previous reports in healthy volunteers9,10.Conclusion
We presented a highly accelerated 31P-MRSI sequence that combines a flyback-EPSI readout with compressed sensing capable to assess energy metabolism of multiple muscle groups from the lower leg simultaneously during an exercise-recovery challenge, using a clinical 3T MR system.Acknowledgements
Thank you to Dr. Peder Larson from UCSF and Dr. Rolf Schulte from GE Healthcare for their help and insight in regard the implementation of the subsampling scheme. Funding was provided through a CONACYT (Mexico) scholarship granted to ASD (CVU: 304930) and a NSERC Discovery Grant (RPGIN-2017-06318) to MDN.References
- Kemp GJ, Ahmad RE, Nicolay K, Prompers JJ. Quantification of skeletal muscle mitochondrial function by 31P magnetic resonance spectroscopy techniques: a quantitative review. Acta Physiol (Oxf). 2015;213(1):107-144.
- Valkovič L, Chmelík M, Krššák M. In-vivo 31P-MRS of skeletal muscle and liver: A way for non-invasive assessment of their metabolism. Anal Biochem. 2017;529:193-215.
- Santos-Díaz A, Obruchkov SI, Schulte RF, Noseworthy MD. Phosphorus magnetic resonance spectroscopic imaging using flyback echo planar readout trajectories. Magn Reson Mater Physics, Biol Med. 2018;31(4):553-564.
- Hu S, Lustig M, Chen AP, et al. Compressed sensing for resolution enhancement of hyperpolarized 13C flyback 3D-MRSI. J Magn Reson. 2008;192(2):258-264.
- Hu S, Lustig M, Balakrishnan A, et al. 3D compressed sensing for highly accelerated hyperpolarized 13C MRSI with in vivo applications to transgenic mouse models of cancer. Magn Reson Med. 2010;63(2):312-321.
- Rockel C, Akbari A, Kumbhare DA, Noseworthy MD. Dynamic DTI (dDTI) shows differing temporal activation patterns in post-exercise skeletal muscles. Magn Reson Mater Physics, Biol Med. 2017;30(2):127-138.
- Qu X, Mayzel M, Cai JF, Chen Z, Orekhov V. Accelerated NMR spectroscopy with low-rank reconstruction. Angew Chemie - Int Ed. 2015;54(3):852-854.
- Purvis LAB, Clarke WT, Biasiolli L, Valkovič L, Robson MD, Rodgers CT. OXSA: An open-source magnetic resonance spectroscopy analysis toolbox in MATLAB. PLoS One. 2017;12(9):e0185356.
- Valkovic L, Chmelik M, Meyerspeer M, et al. Dynamic 31P MRSI using spiral spectroscopic imaging can map mitochondrial capacity in muscles of the human calf during plantar flexion exercise at 7T. NMR Biomed. 2016;29(12):1825-1834.
- Niess F, Fiedler GB, Schmid AI, et al. Dynamic multivoxel-localized 31P MRS during plantar flexion exercise with variable knee angle. NMR Biomed. 2018;e3905.
Figures
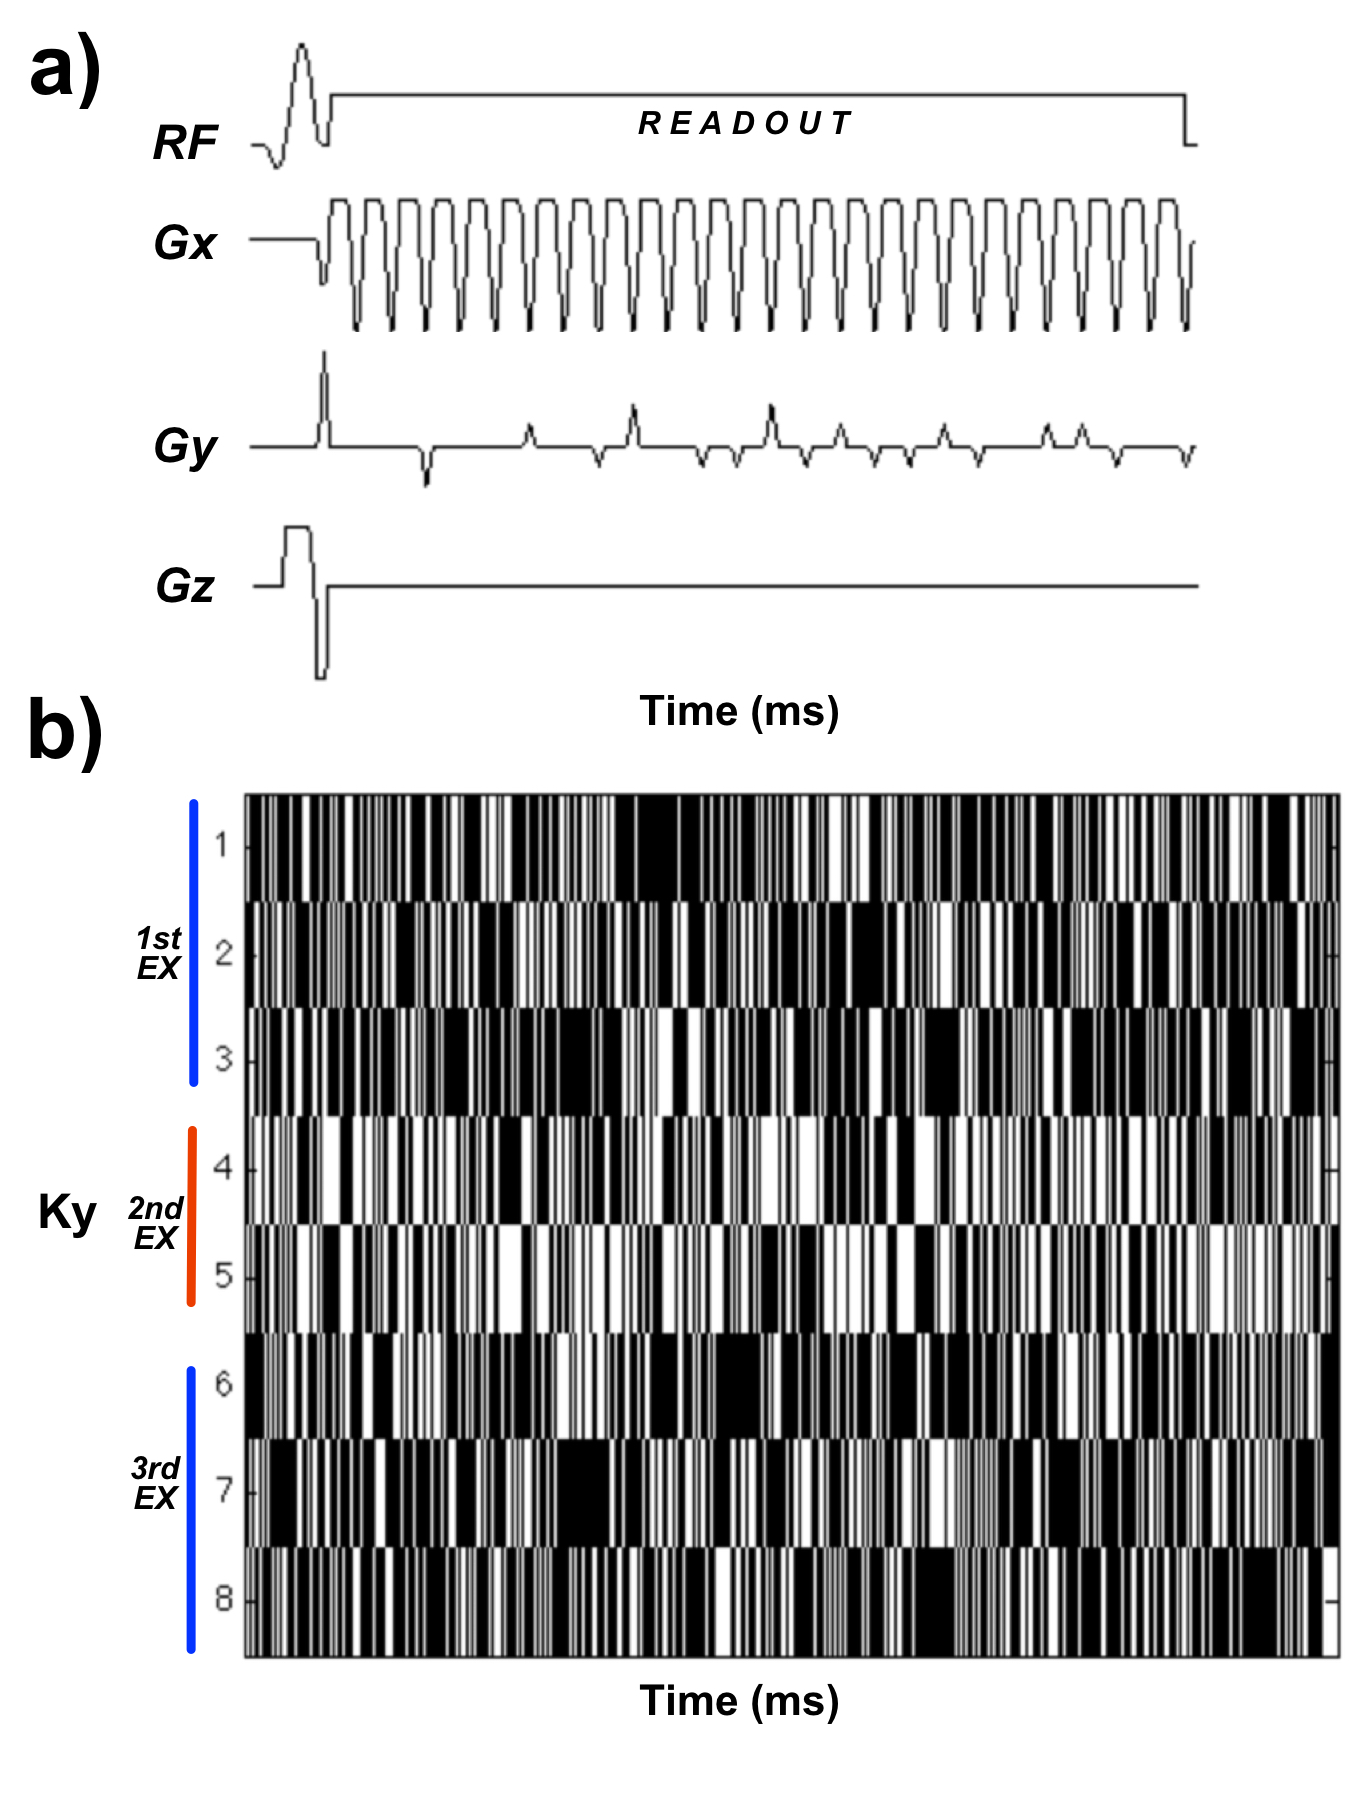
Figure 1. (a) Pulse sequence diagram
showing the flyback-EPSI readout and randomly distributed blips in the Gx and
Gy logical gradient axes respectively. (b)
Sub-sampling schedule for the sequence (i.e. white spaces indicate location of
samples, black are absence) to achieve a 2D-MRSI dataset (frame). The first
excitation acquires the first three Ky-Kt
lines whereas the second and third acquire the two central and three bottom
k-space lines. The Kx
dimension is fully sampled by the flyback-EPSI readout.
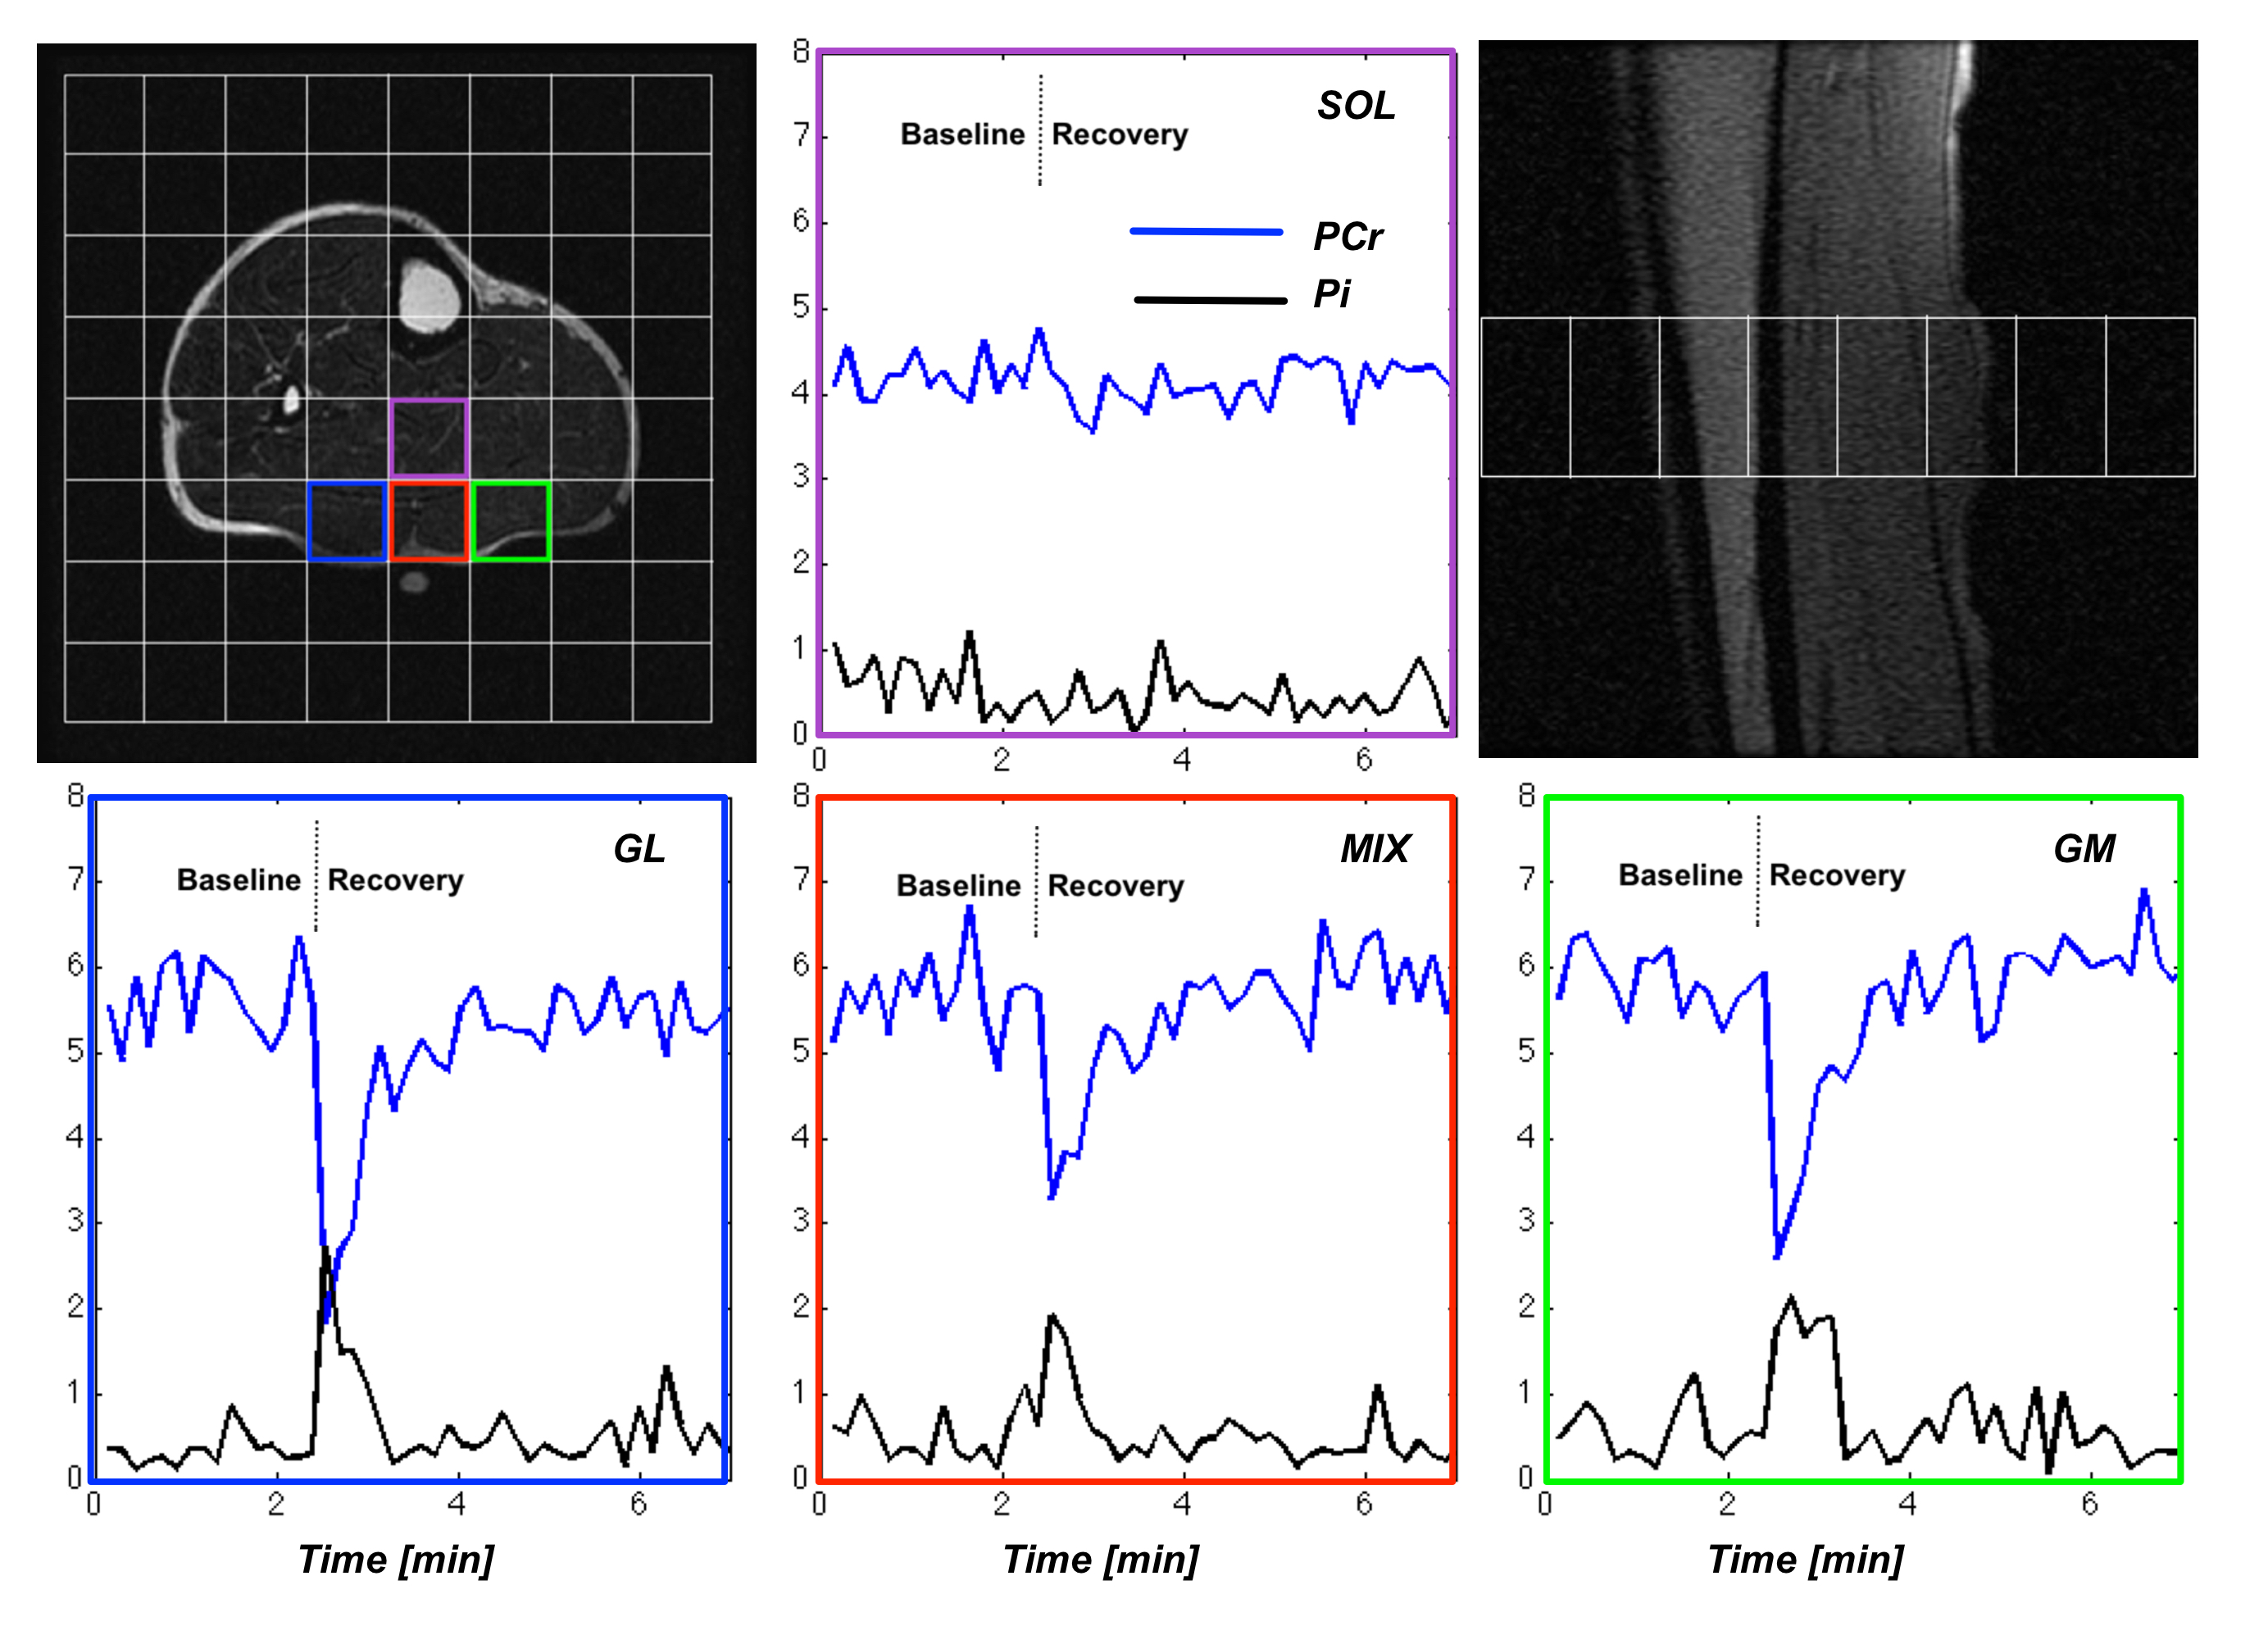
Figure 2. Data
acquisition matrix on the axial plane of an anatomical image (top left).
Sagittal image showing the slice profile (top right). Temporal evolution of the
PCr and Pi signals for different muscle groups analyzed. Units of amplitude were
normalized to the same reference. Voxels were selected to include in the
analysis gastrocnemius lateralis (GL), gastrocnemius medialis (GM), soleus
(SOL) and a mixture of muscles (MIX).
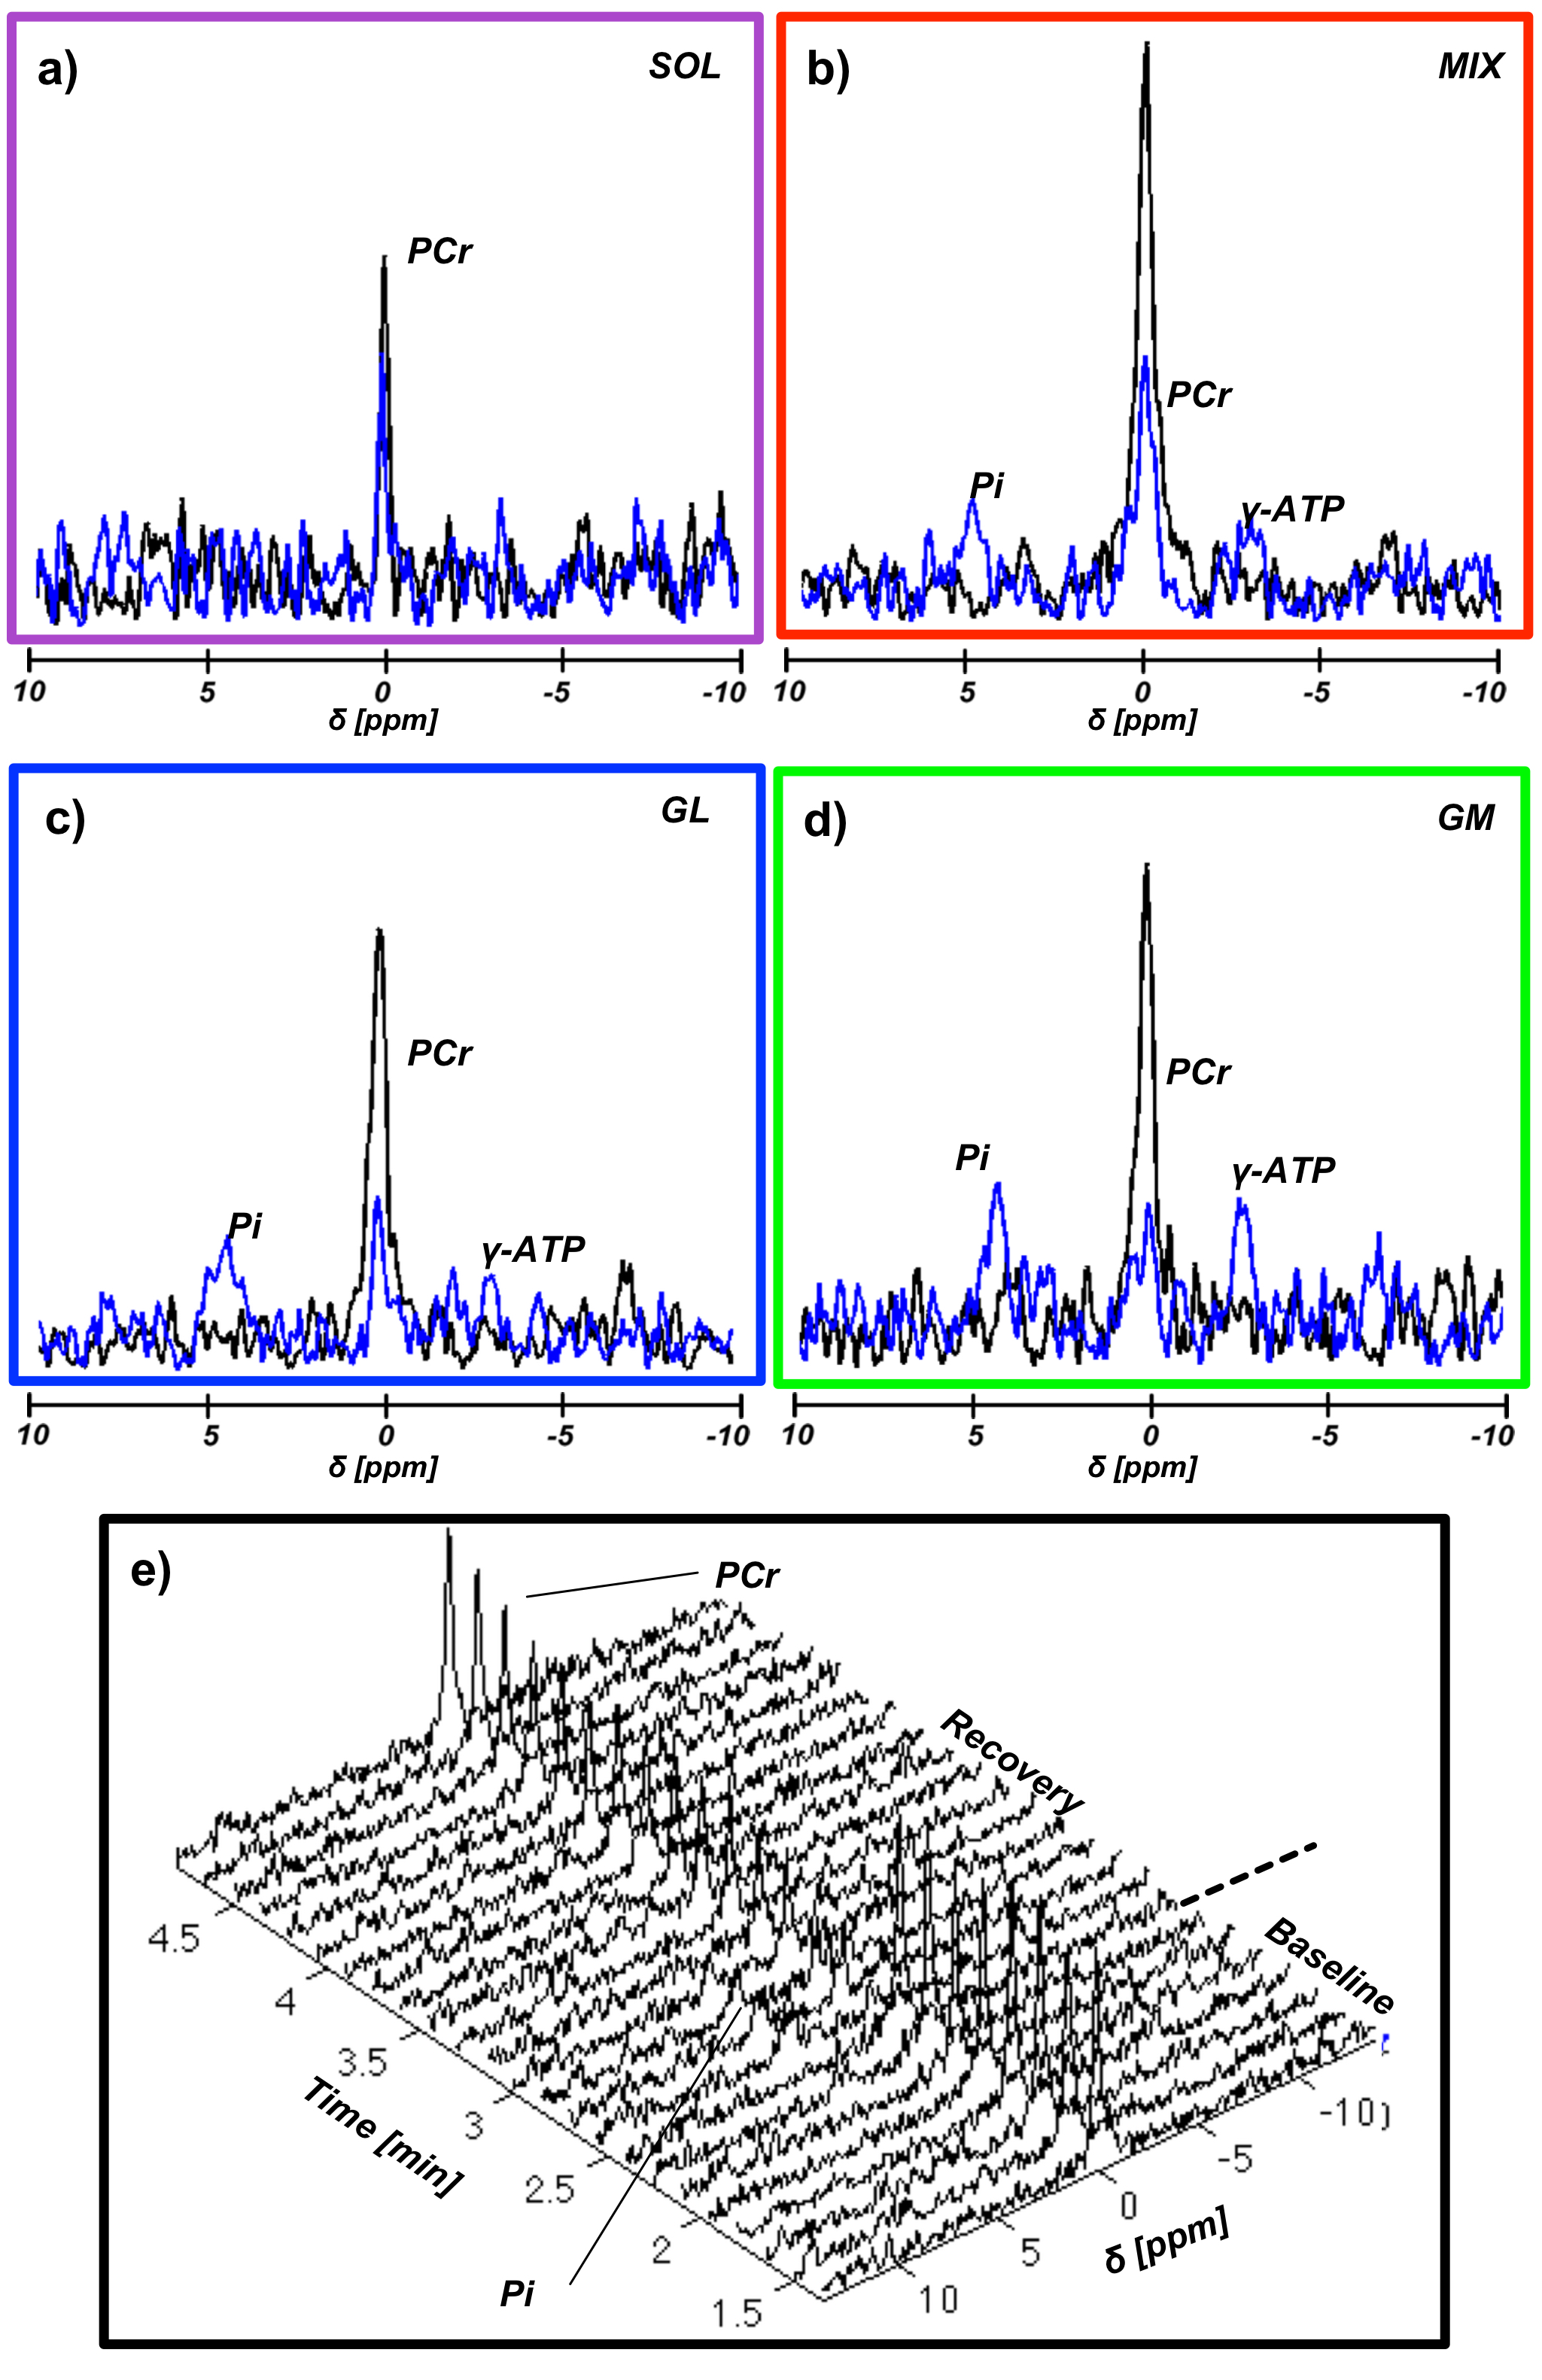
Figure 3. (a-d) Representative spectra for
each muscle group acquired at rest (black line) and at the end of the
exercise (blue line). Reduced PCr and increased Pi signal amplitudes at
the end of exercise are clearly depicted. Additionally, Pi signal at rest is
not distinguishable. (e) Example of
the time evolution for the spectra from the GM. PCr depletion and recovery is
shown as well as the increase in Pi at the end of the exercise.
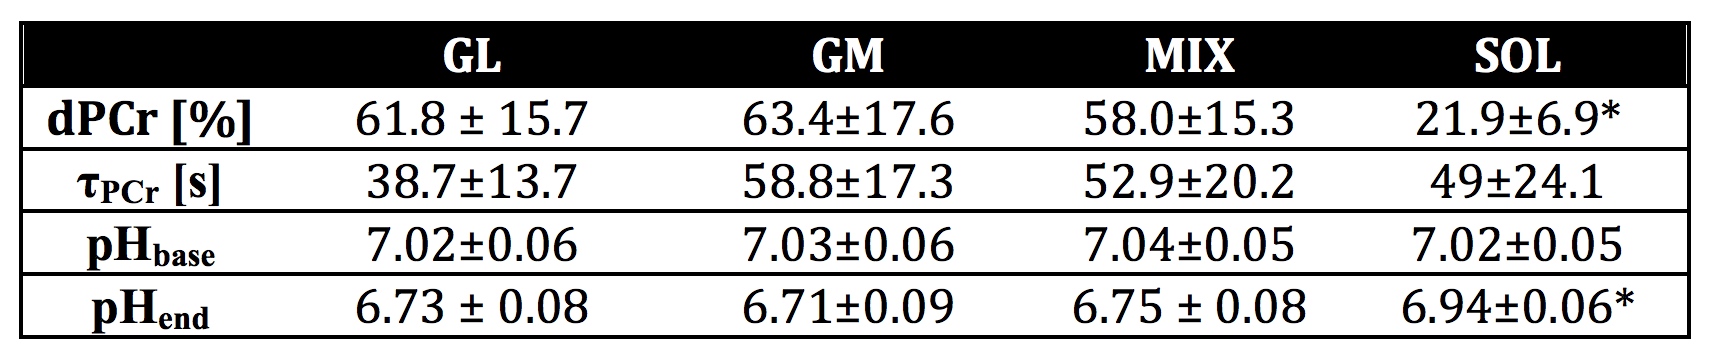
Figure 4. Results for dynamic acquisition of human calf
muscles (n=11). GL: Gastrocnemius lateralis. GM: gastrocnemius medialis. MIX:
mixture of muscles. SOL: soleus muscle. dPCr: drop of PCr signal. τPCr: Time constant of PCr recovery. pHbase: pH at rest. pHend: pH at the end of
exercise. (*) Indicates significance, p<0.01.