2501
Functional 31P Magnetic Resonance Spectroscopy of the Human Visual Cortex using Repeated Short-Term Stimulation at 7T1German Cancer Research Center (DKFZ), Heidelberg, Germany
Synopsis
Functional 31P Magnetic Resonance Spectroscopy allows the noninvasive observation of high-energy phosphate turnover in vivo, and might enable insight into the energy metabolism of activated brain areas. The purpose of this study was to investigate possible changes in 31P spectra of the human brain at B0 = 7T in response to repeated short-term visual stimulation. No significant changes in signal intensities and frequencies of 31P-containing brain metabolites were observed, which agrees with results from recent studies at ultra-high fields using long-term stimuli.
Introduction
Phosphorus magnetic resonance spectroscopy (31P MRS) allows the noninvasive observation of high-energy phosphate turnover in vivo. Neurofunctional studies have considered the response of 31P metabolite levels to visual stimulation in the human visual cortex. They employed various experimental setups with respect to field strength, data acquisition technique, stimulation paradigm, and data evaluation. Often stimulation blocks longer than 1.5min were applied, and either non-significant [1] or small changes [2] in 31P metabolite concentrations were reported. To the best of our knowledge, none of those studies investigated paradigms of short, repeated visual stimulation and blocks for resting, which could potentially minimize a metabolic adaptation to the stimulus. The purpose of this study was to investigate possible changes in 31P spectra of the human brain at B$$$_0~$$$=$$$~$$$7T in response to repeated short-term visual stimulation.
Methods
Measurements of the brain of ten healthy volunteers (3 female/7 male, age: 24 – 31 y) were performed on a 7T whole-body MR system (Magnetom 7T; Siemens Healthineers; Erlangen, Germany) using a double-resonant 31P-1H head coil with 32 receive channels at the 31P frequency (RAPID Biomedical; Rimpar, Germany). The limited spatial sensitivity of the individual receive channels allowed coarse localization of 31P MR signals. The visual stimulation was performed by presenting a colored, radial checkerboard changing colors and structure with a frequency of 8 Hz on a MR-compatible screen [3] placed at the end of the bore. The device was visible to the volunteer through a mirror attached to the coil.
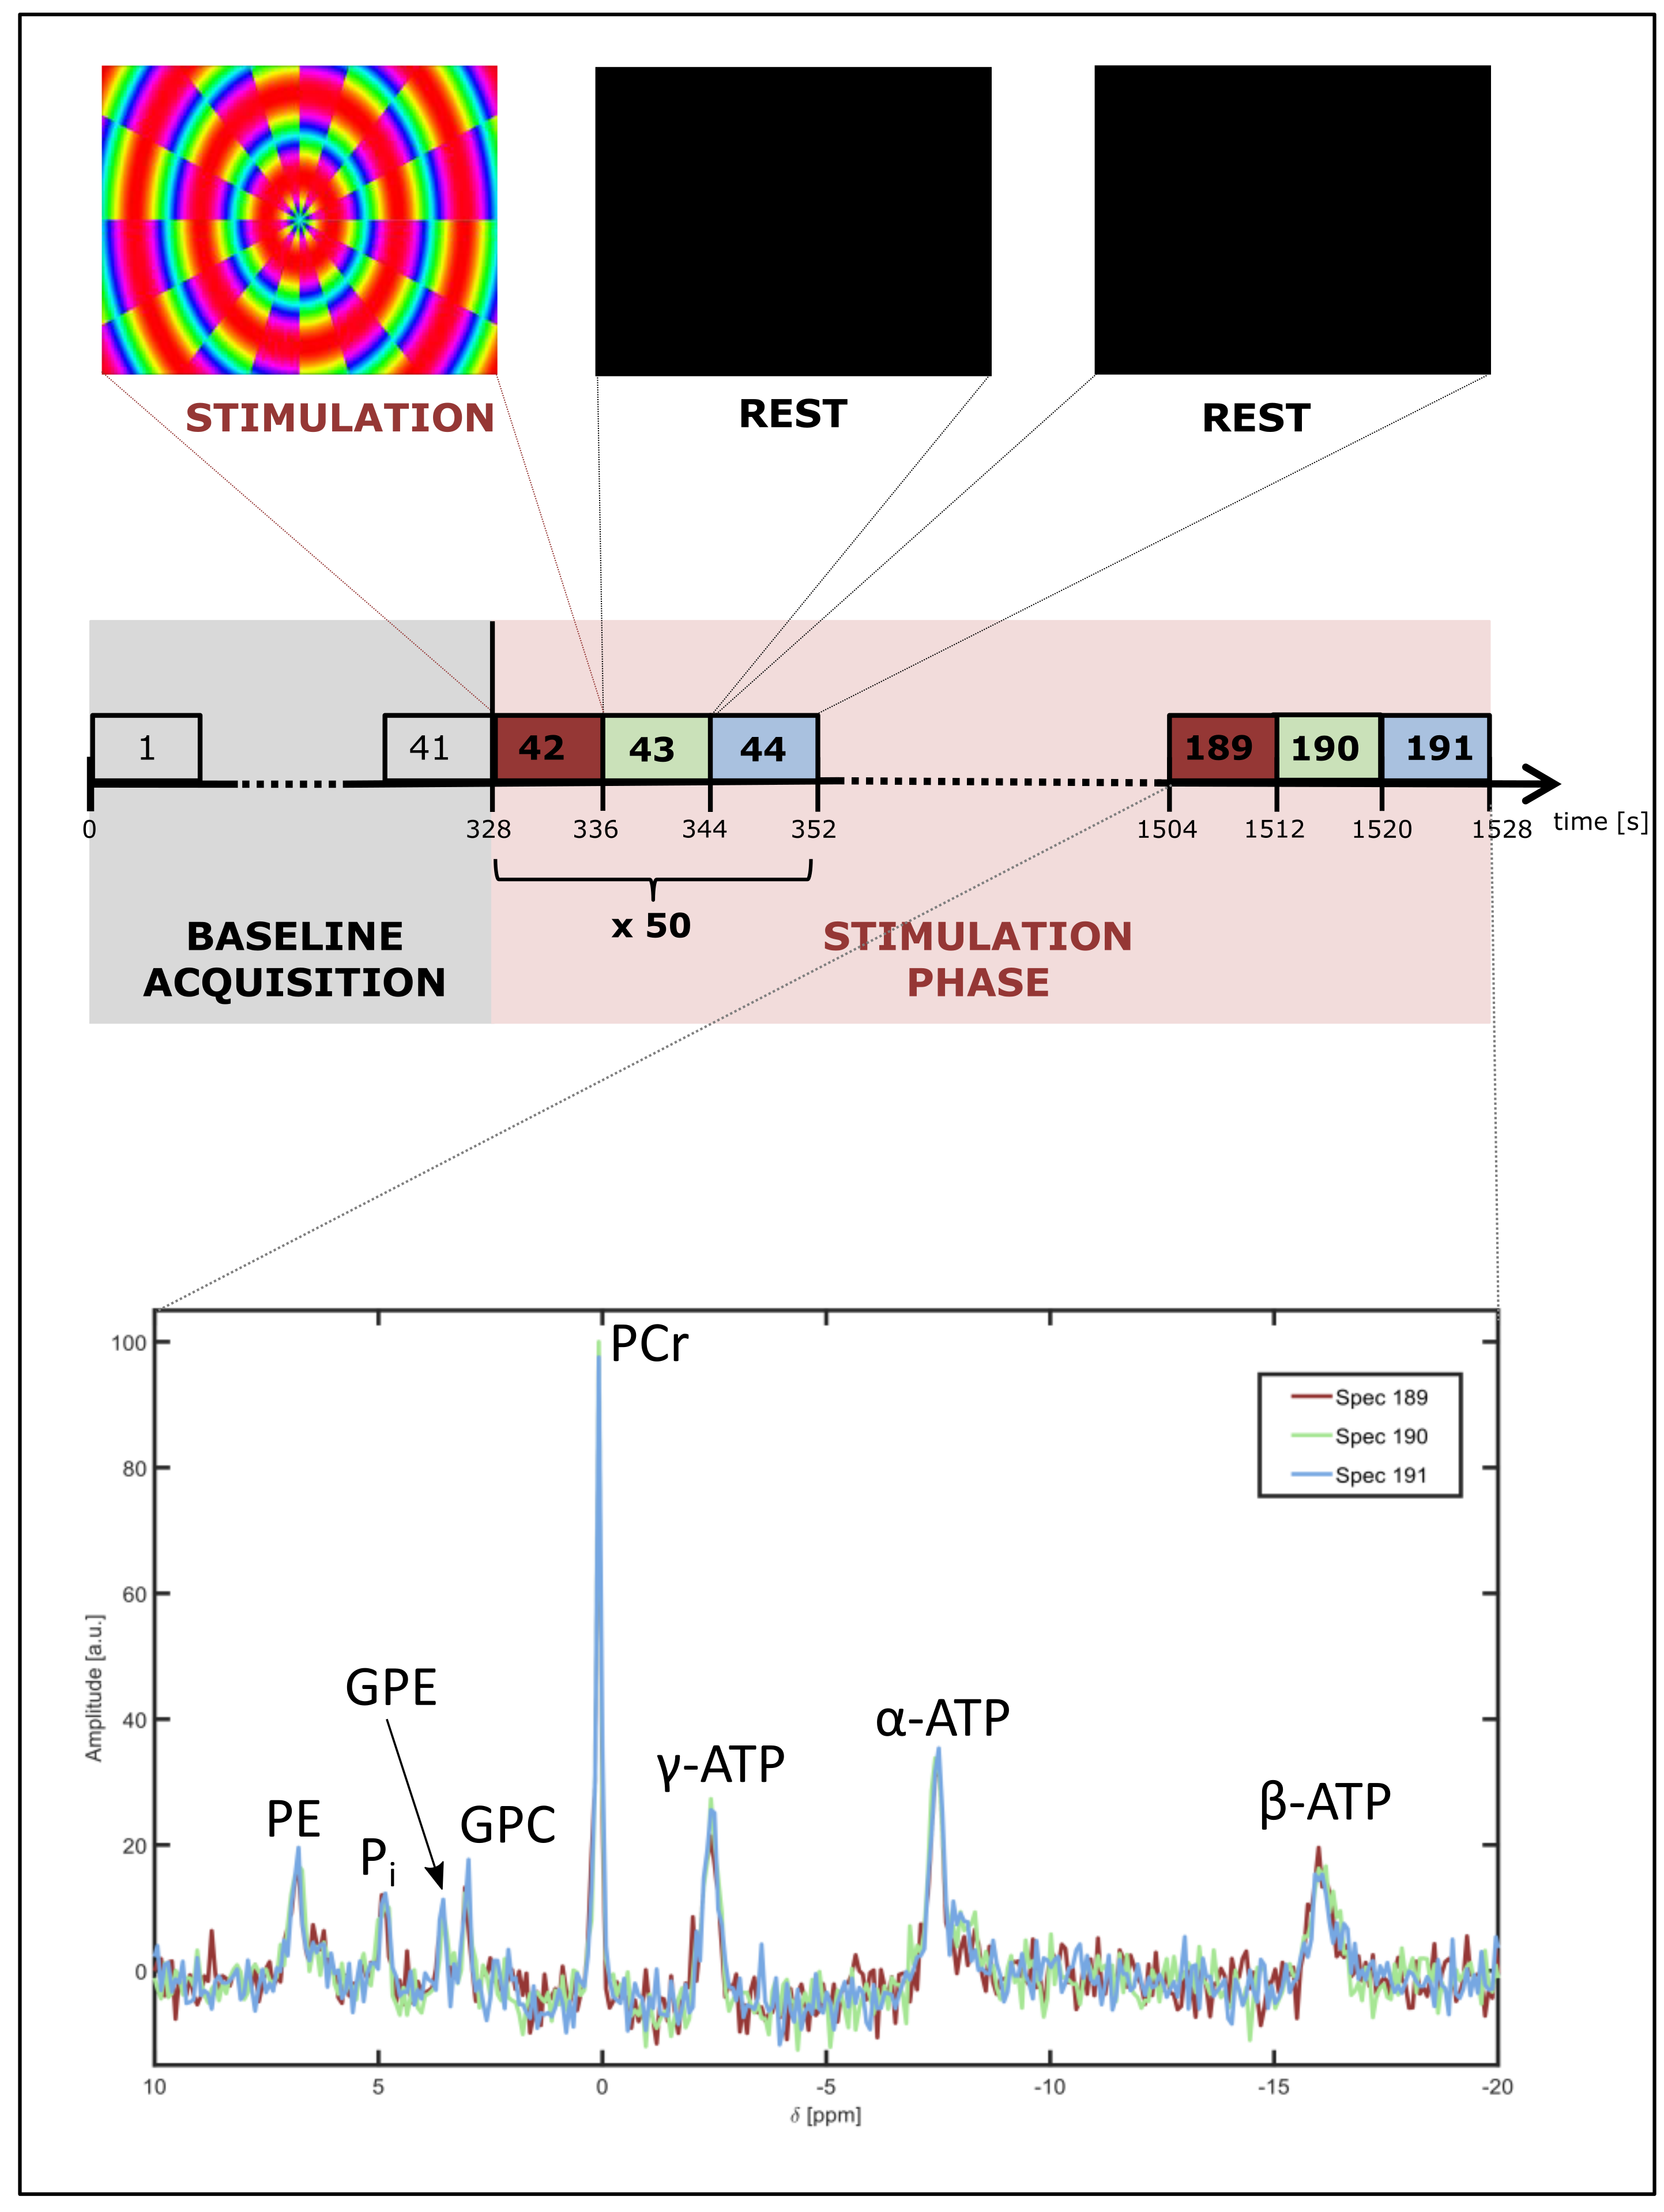
31P spectra were obtained every 8 s via a FID sequence (TR = 0.5 s, averages = 16) over the total time of 25.5 min in each of the 32 channels. After showing a black screen for 5.5 min to obtain a ‘baseline signal’, the ‘stimulation phase’ started. The paradigm consisted of 8 s ‘stimulation ON’ followed by two times 8 s ‘rest’, and was repeated 50 times (Fig.1).
31P spectra were evaluated for each channel and volunteer separately. After removal of the spectral baseline, the 8 most prominent peaks (phosphoethanolamine (PE), inorganic phosphate (Pi), glycerophosphoethanolamine (GPE), glycerophosphocholine (GPC), phosphocreatine (PCr), γ-, α- and β-adenosine-5’-triphosphate(ATP)) were fitted using the AMARES algorithm [4] in jMRUI 5.2 [5] to obtain their amplitudes, linewidths, and frequency differences. Amplitudes were divided by the corresponding baseline values to yield relative values. Intracellular pH (ipH) was calculated using the modified Henderson–Hasselbalch equation [6] and the frequency difference between the PCr and Pi resonances.
Two evaluation schemes were applied: first, mean values of the relative amplitudes and changes of ipH value across all volunteers were calculated and their time courses during the complete stimulation phase analyzed with a temporal resolution of 8 s; second, a blockwise evaluation was performed and values belonging to the same phase in the stimulation paradigm (Stimulation ON – Rest – Rest) were averaged, leading to a single value for relative amplitude and ipH for each of the three blocks.
Results
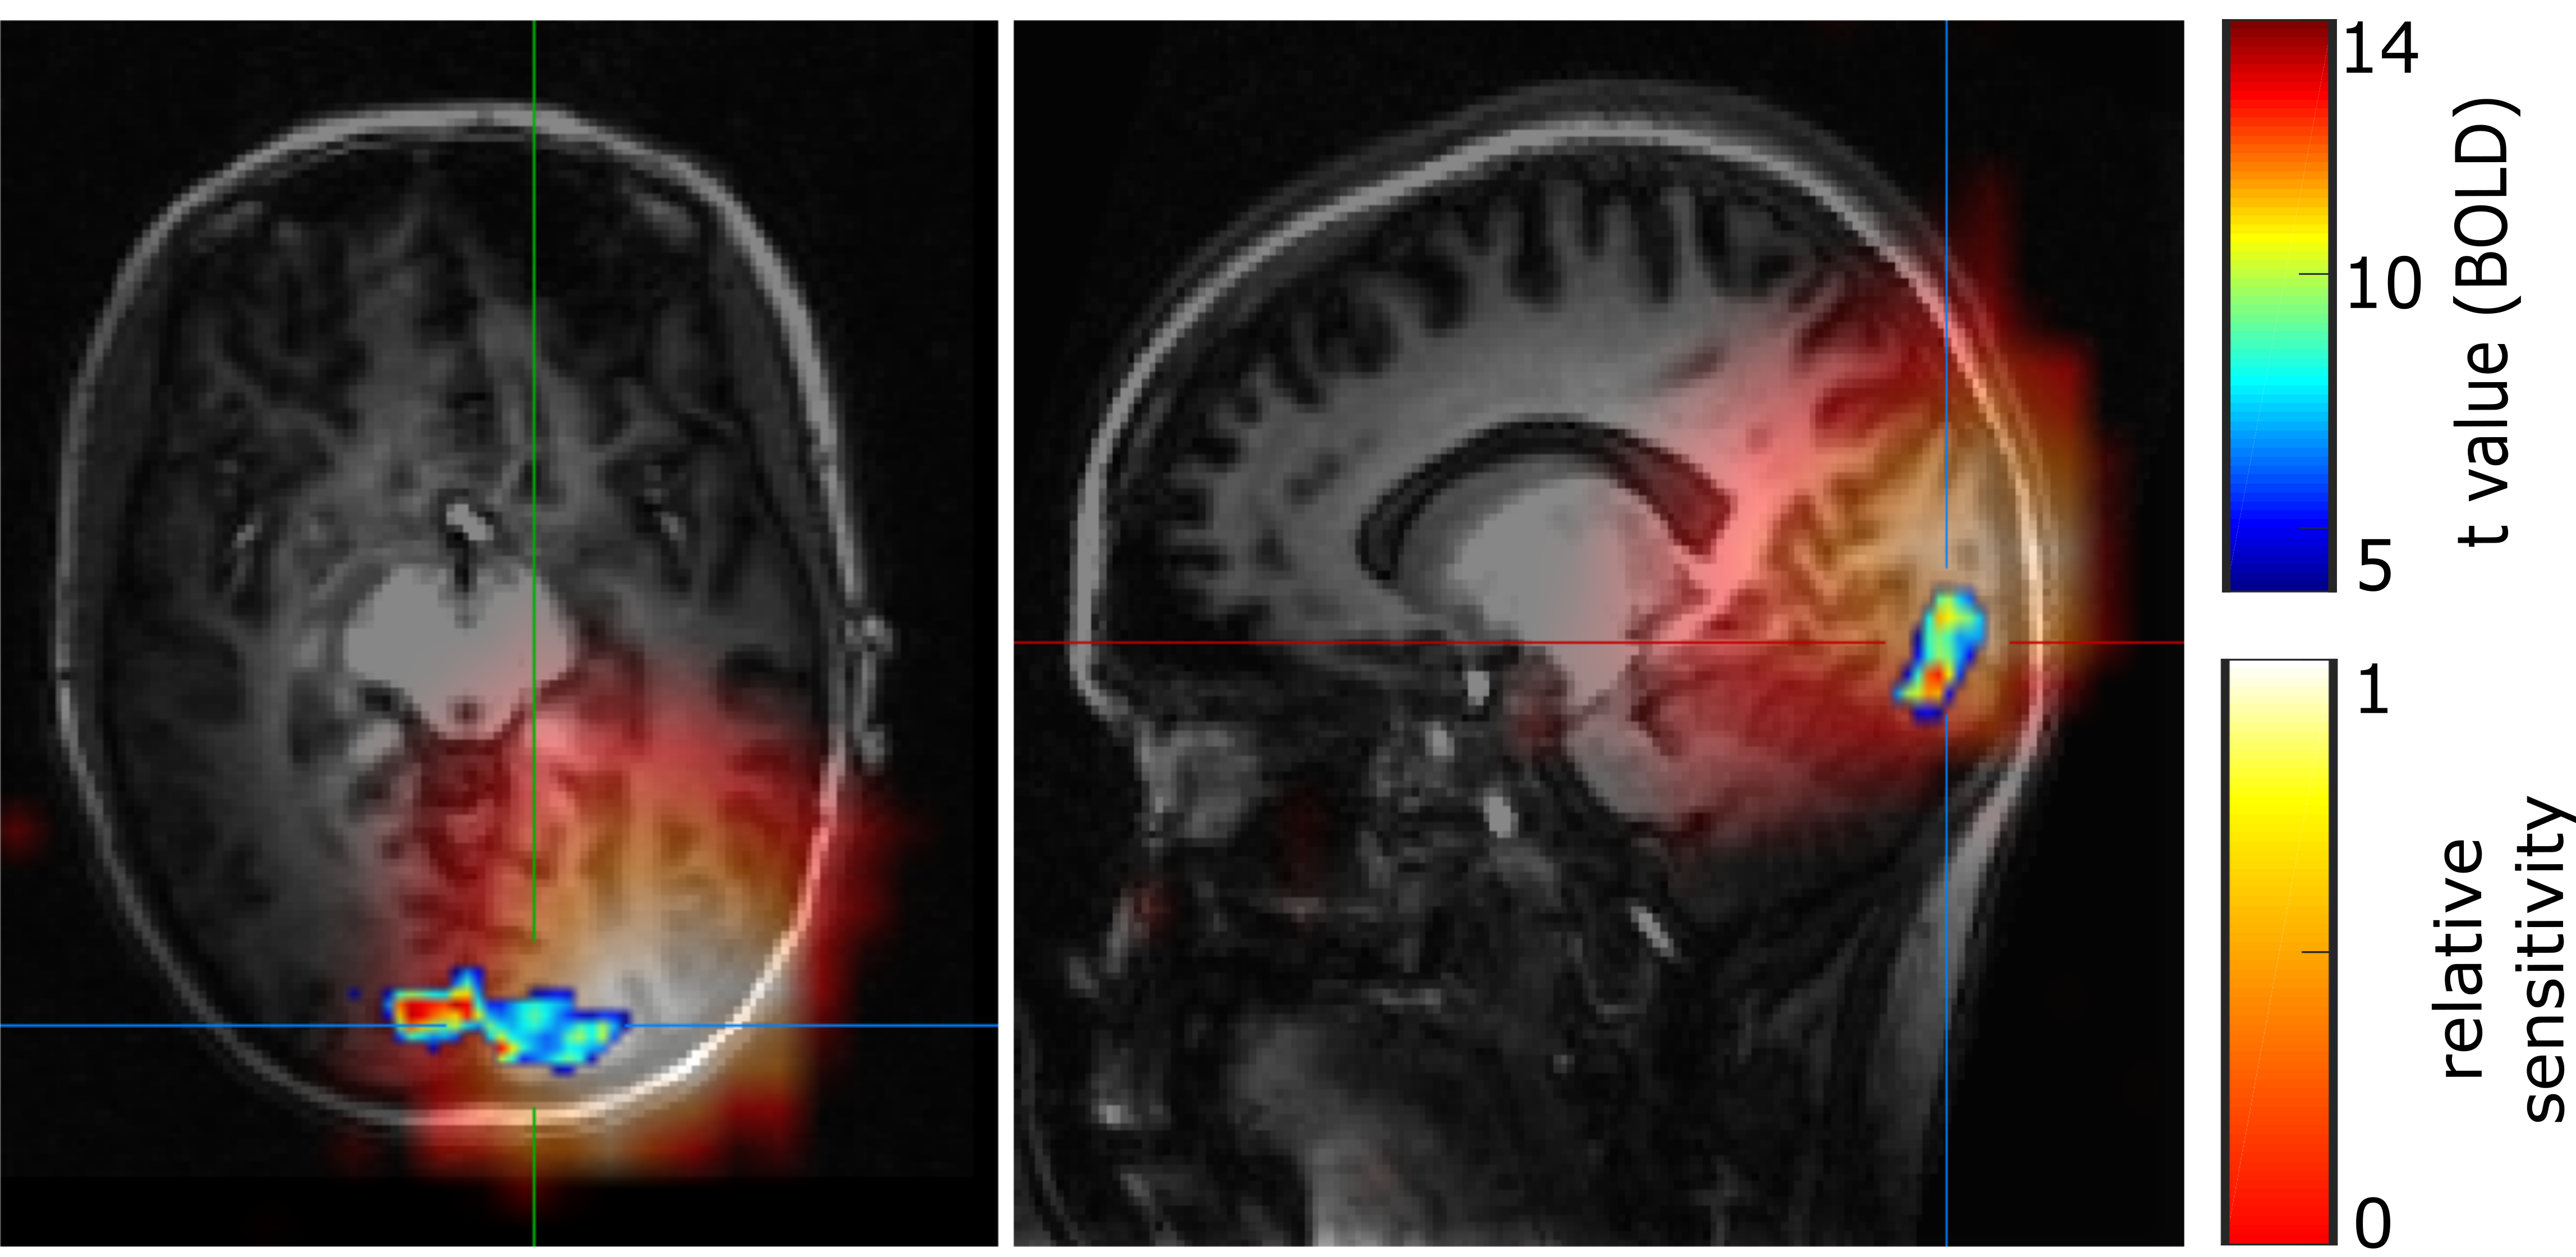
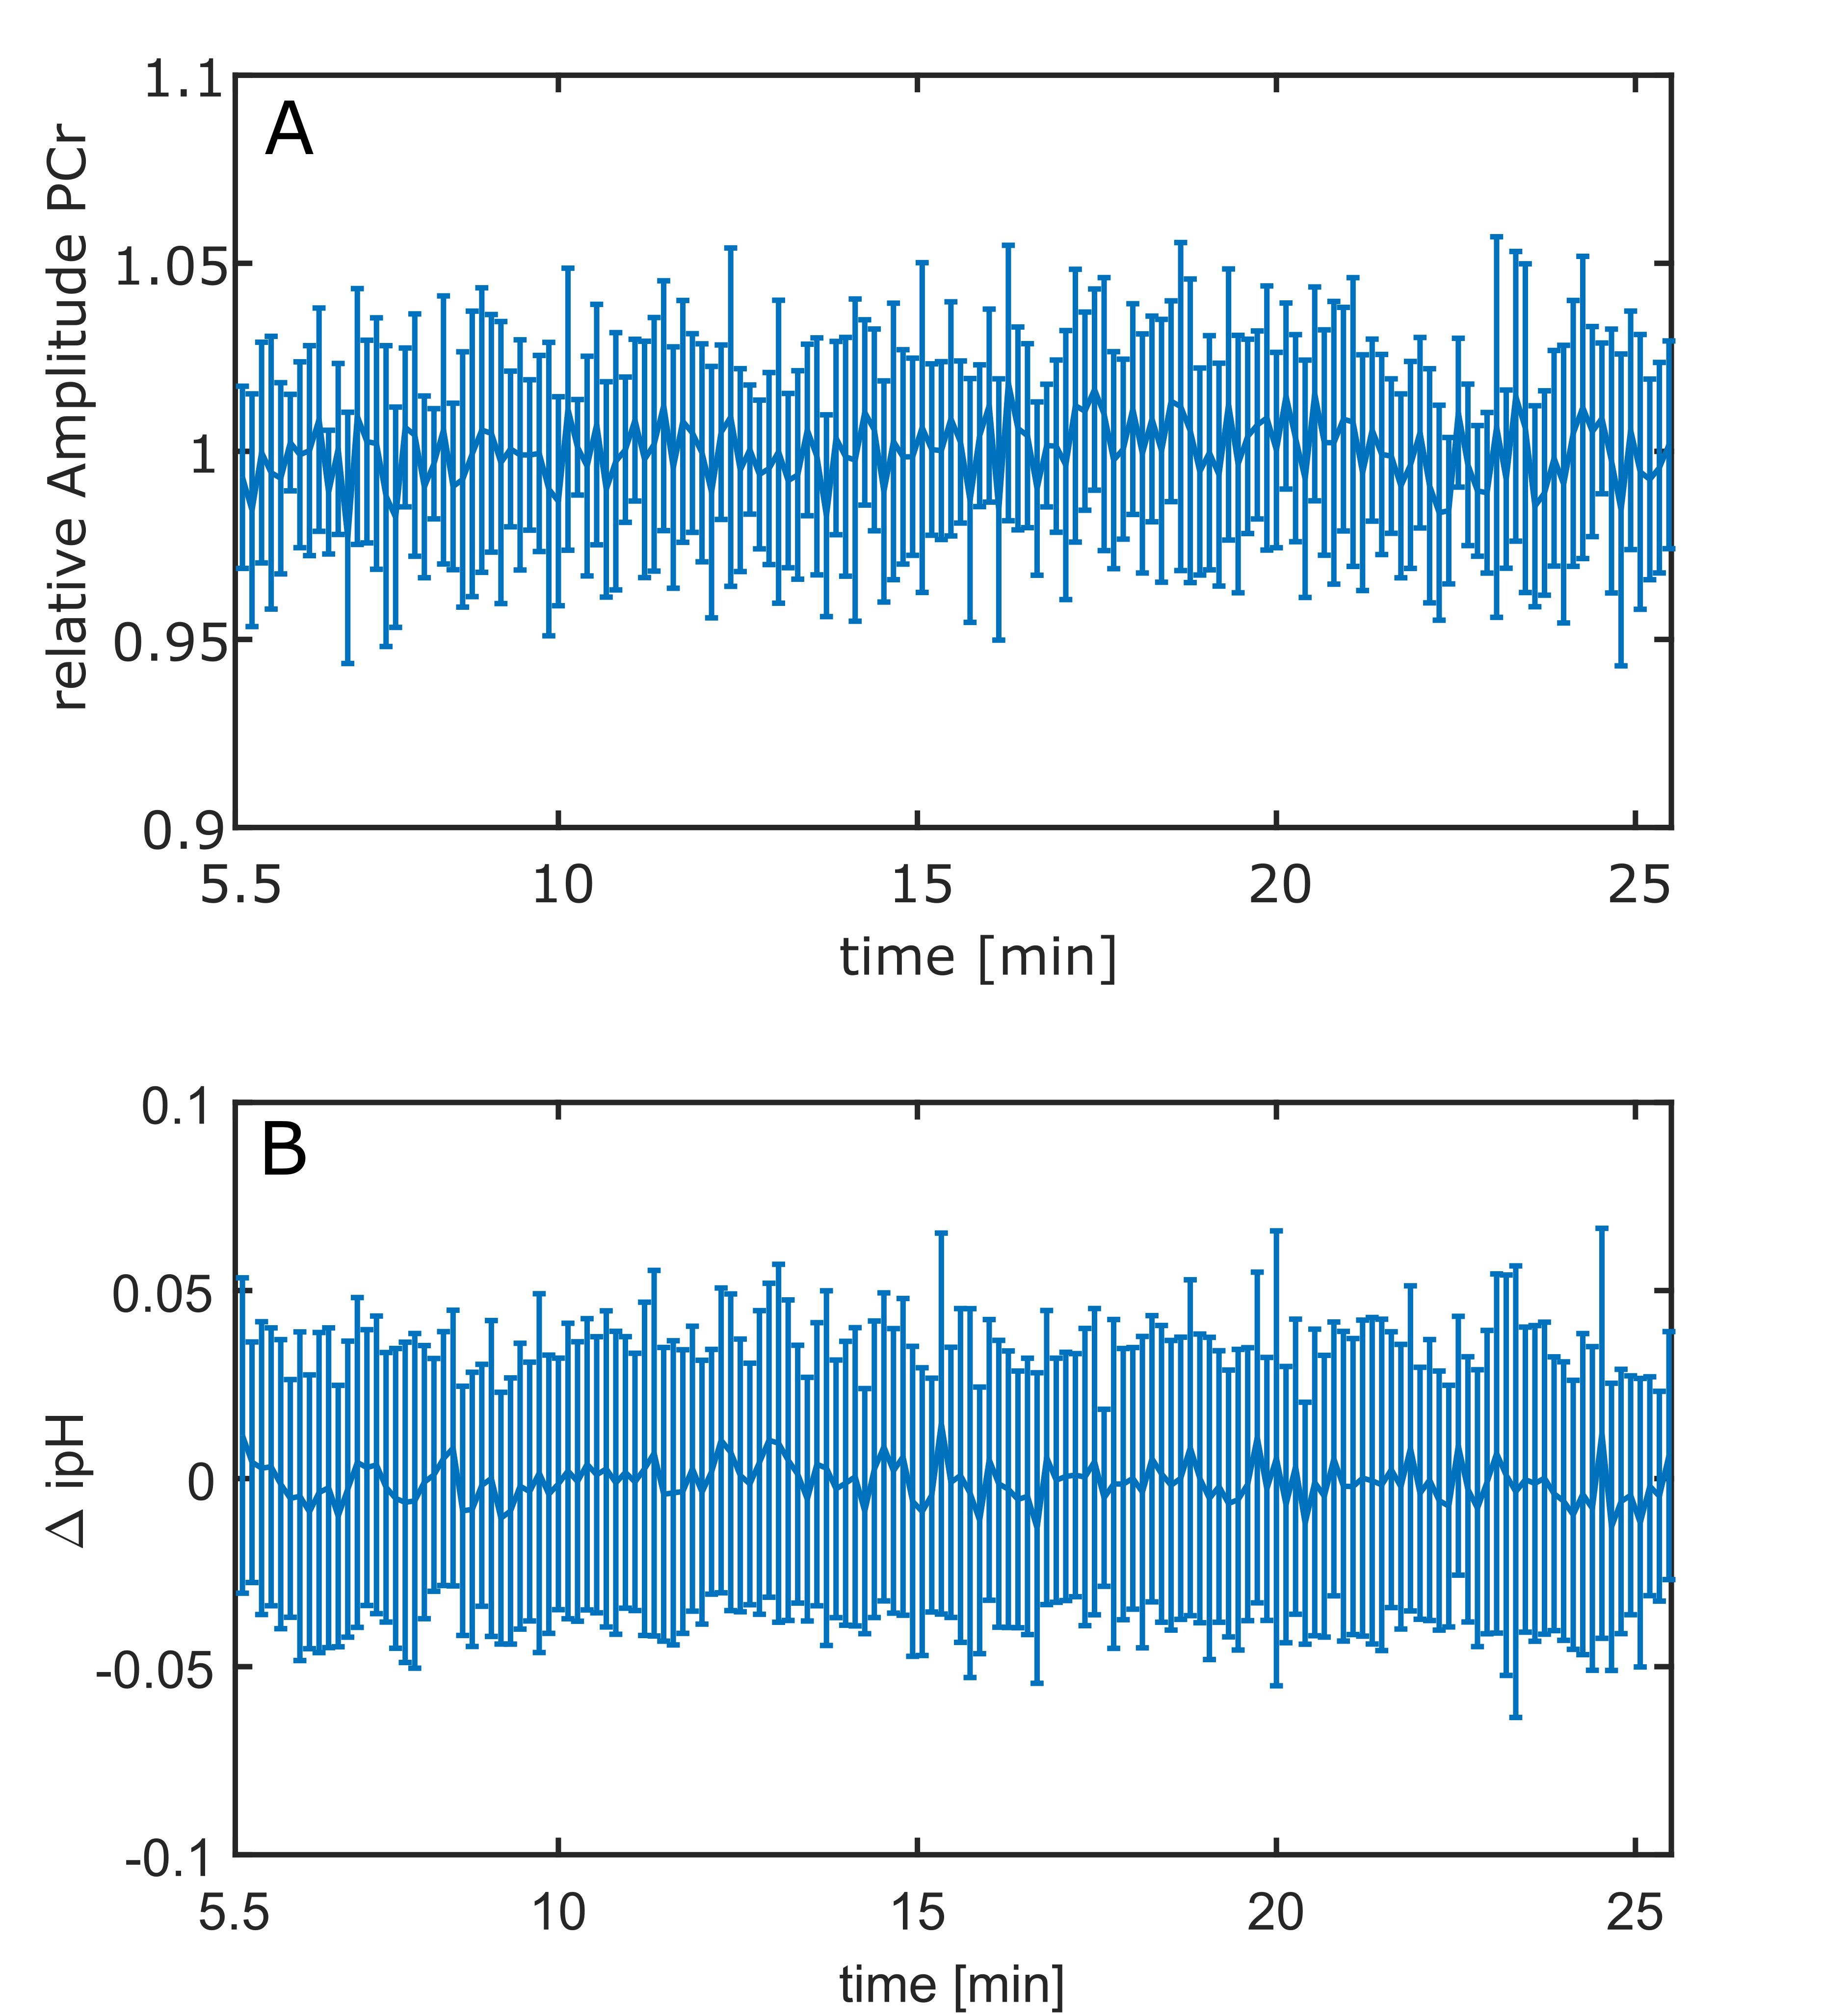
In all volunteers, individual 31P spectra were of high quality and enabled robust spectral fitting (Fig.1). Functionality of the presented stimulus was validated by BOLD measurements [3] (Fig.2). Figure 3 shows a representative time course of the relative PCr levels and the change ΔipH in a channel covering the visual cortex. Spectra acquired in individual channels appeared to be stable. In none of the channels was a significant change observed, neither in relative amplitudes, nor in ipH value. Also, in the blockwise evaluation no significant difference between the three blocks was found.Discussion
Some previous studies performed at lower field strengths reported slight, but significant, changes in amplitudes of PCr under visual stimulation. Recent experiments at ultra-high fields, however, could not reproduce these findings [1]. A possible explanation could be a metabolic adaptation to the relatively long stimuli, which we intended to avoid by performing a repeated short-term stimulation experiment. Nevertheless, also in our study no metabolic changes in the high-energy phosphate system could be observed. This might possibly indicate that the metabolic adaptation happens faster than detectable with our time resolution. Another reason for the lack of detected changes could be the relatively large size of the observed volume compared to the activated area (Fig.2).
Pohmann et al. [7] reported a slight, but significant, increase in the linewidths during stimulation, but this effect could not be resolved in our data.
Conclusion
We observed no significant changes in signal intensities and frequencies of 31P-containing brain metabolites in response to repeated short-term visual stimulation. This agrees with results from recent studies at ultra-high fields using long-term stimuli.Acknowledgements
No acknowledgement found.References
1. van de Bank, et al. Is visual activation associated with changes in cerebral high-energy phosphate levels? Brain Structure and Function 2018; 223:2721–273.
2. Barreto, et al. 31P-MRS Using Visual Stimulation Protocols with Different Durations in Healthy Young Adult Subjects. Neurochem Res 2014; 39:2343–235.
3. Groebner, et al. 7 Tesla compatible in-bore display for functional magnetic resonance imaging. Magnetic Resonance Materials in Physics, Biology and Medicine 26.4 (2013): 371-375.
4. Vanhamme, et al. Improved Method for Accurate and Efficient Quantification of MRS Data with Use of Prior Knowledge. Journal of Magnetic Resonance 1997; 129(1), 35-4.
5. Naressi, et al. Java-based graphical user interface for the MRUI quantitation package. Magnetic Resonance Materials in Physics, Biology and Medicine 12.2-3 (2001): 141.
6. De Graaf RA. In vivo NMR spectroscopy, principles and techniques, 2nd ed. Chichester, United Kingdom: Wiley, 2007.
7. Pohmann, et al. Functional phosphorus spectroscopy of the human visual cortex at 9.4 T. Proc. Intl. Soc. Mag. Reson. Med. 201.
8. Friston, et al. Statistical Parametric Maps in Functional Imaging: A General Linear Approach. Human Brain Mapping 2, 1994; 189-21.
Figures