2499

Spectral Editing of NAD+/NADH inĀ 31P NMR spectra of Human Brain
Jimin Ren1,2, A Dean Sherry1,2,3, and Craig R Malloy1,2,4

1Advanced Imaging Research Center, UT Southwestern Medical Center, Dallas, TX, United States, 2Department of Radiology, UT Southwestern Medical Center, Dallas, TX, United States, 3Department of Chemistry, University of Texas at Dallas, Richardson, TX, United States, 4VA North Texas Health Care System, Dallas, TX, United States

Synopsis

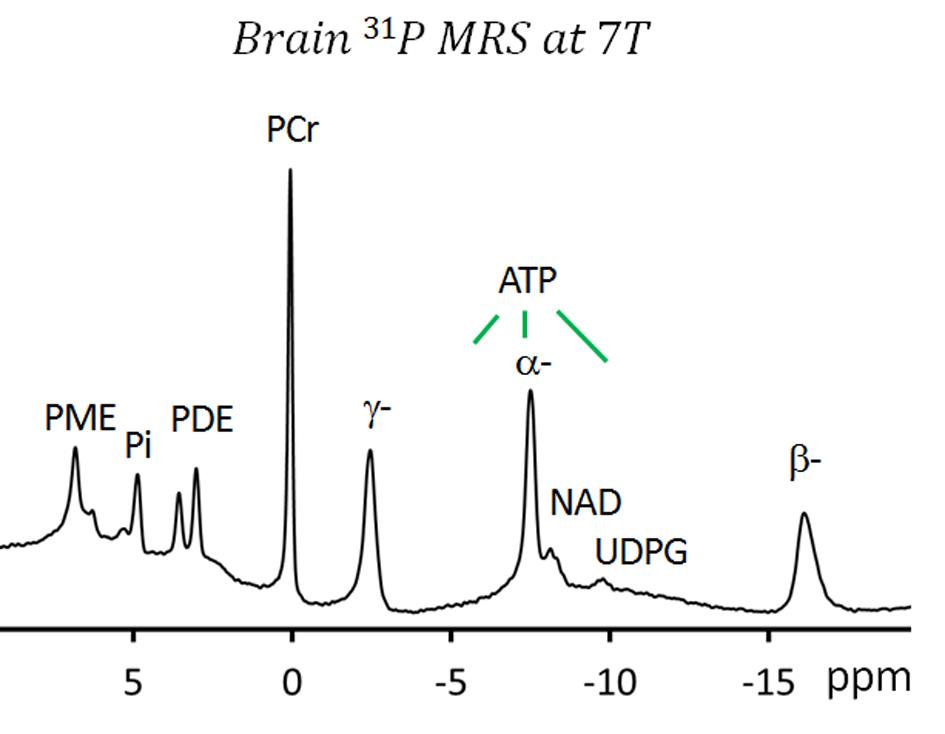
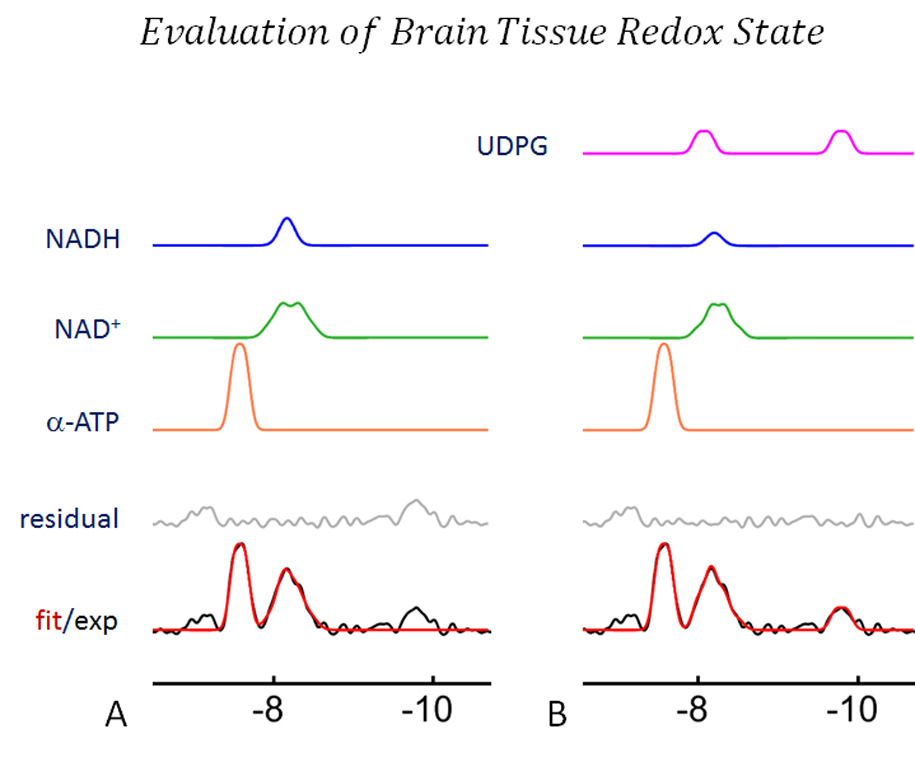
Nicotinamide adenine dinucleotides (NAD+/NADH) play an essential role in cellular redox reactions and many biological processes. Altered NAD+/NADH levels and redox state may be associated with development of neurodegenerative diseases and psychotic disorders. 31P MRS is currently the only non-invasive technique to measure NAD+/NADH levels and redox state in human brain in vivo. However, the present technique suffers two major drawbacks: (1) the severe overlapping of the NAD+/NADH signals with the α-ATP resonance, and (2) the distorted baseline underneath these signals. Here we present a novel spectral editing method that allows resolution of NAD+/NADH from α-ATP at baseline.

INTRODUCTION Nicotinamide adenine dinucleotides (NAD+/NADH) are essential co-enzymes involving many redox reactions in all living cells.1 NAD also serves as a substrate and signaling molecule in support of fundamental biological processes that are involved in DNA repair, apoptosis and aging.1 There has been a great interest in measuring brain NAD+/NADH levels and redox state using non-invasive 31P MRS.2-8 However, the current methods based on conventional 31P MR spectroscopy suffer two major drawbacks: (1) the poor resolution of NAD+/NADH signal due to overlap with the much more intense α-ATP resonance; and (2) the distorted baseline in the α-ATP and NAD spectral region. This poses a great challenge for reliable measurements of the NAD+/NADH ratio. In this study, we propose a novel method to resolve NAD+/NADH from a-ATP and to restore the spectral baseline in the α-ATP and NAD/NADH region for more accurate assessment of brain redox based on the NAD+/NADH ratio.

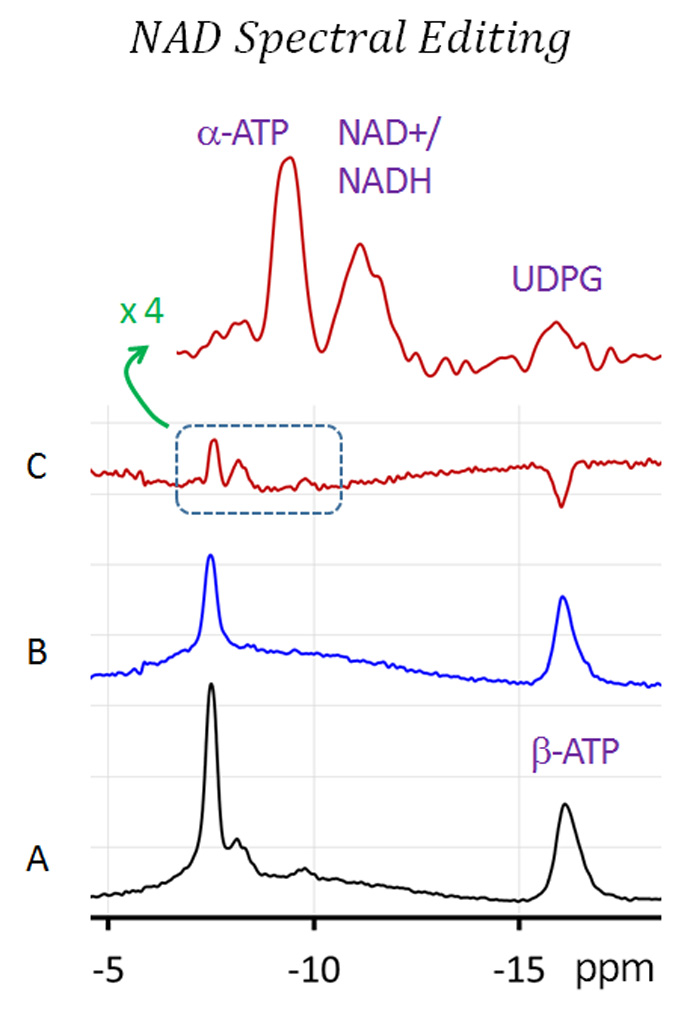
METHODS To completely resolve NAD+/NADH from overlapping α-ATP, we used an inversion-recovery (IR)-based spectral editing technique. The significant difference in apparent T1 between the NAD+/NADH and α-ATP signals (2.07 s versus 1.35 s [7]) allows for selective and clean nulling of the slower relaxing NAD+/NADH signal by use of an inversion-recovery sequence. Seven human subjects participated in the study with informed written consent under a technical development protocol approved by our local IRB. Human brain 31P spectra were acquired from the head posterior region on a 7T scanner (Philips Achieva) using a half-cylinder-shaped 1H/31P T/R partial volume coil. A pulse-acquire sequence was used to collect a non-edited 31P spectrum with typical acquisition parameters TR = 1 s or 4 s, SW = 4 kHz, data points 4 k, NA 512 or 128 (denoted as spectrum A). For NAD+/NADH signal editing, an adiabatic inversion pre-pulse (BW 300 – 2000 Hz) followed by a short delay time was used to null the NAD+/NADH signal (denoted as spectrum B). Further spectral editing was accomplished by subtraction of spectrum B from A using the formula A – Bf, where the coefficient f is a parameter that depends on sequence conditions (TR, and inversion bandwidth and efficiency).

RESULTS Figure 1 shows a typical non-localized 31P spectrum acquired at 7T from the brain of a healthy 55 yr old female. It is obvious in this NAD-unedited spectrum, the small NAD+/NADH signal severely overlaps with the nearby α-ATP signal which is about 10-fold larger. In addition, the spectral baseline is distorted in the upfield region between -5 and -15 ppm, especially beneath the NAD+/NADH and α-ATP signals. In contrast, after applying the IR-based NAD-editing sequence, the NAD+/NADH signal in the resultant spectrum (Figure 2B) is completely absent while the intensity of α-ATP signal is partially reduced. Note the shape of the spectral baseline remains largely unchanged in comparison to the same spectral region in unedited spectrum (Figure 2A). After subtraction, the resultant NAD+/NADH signal is clearly separated from the much-reduced residual α-ATP signal (Figure 2C and inset). Similar near complete resolution of NAD+/NADH and α-ATP was achieved in all seven subjects. The average NAD+/NADH concentration was estimated as 0.28 ± 0.06 mM by assuming an a-ATP concentration of 3.0 mM. Moreover, because the baseline is greatly restored in the edited spectrum (Figure 2C and inset), only minor or no baseline correction was needed for an evaluation of the redox state. Figure 3 shows a dataset to illustrate the redox measurement (NAD+/NADH ratio) based on a NAD+/NADH-edited spectrum. A Gaussian lineshape fitting of NAD+ (quartet) and NADH (singlet) signals yielded a NAD+/NADH ratio of 2.73 (without UDPG correction) and 4.61 (with UDPG correction), both in reasonable agreement with the results in literature.2-4

DISCUSSION The spectral overlap between NAD+/NADH and α-ATP is arguably the only unresolved problem in brain 31P MR spectra at ultrahigh field that needs to be addressed for quantitative measurements. This study presents a novel IR-based spectral editing method to resolve these two metabolites for evaluation of total brain NAD+/NADH levels and redox state. The success of the IR-based method is mainly attributed to the significant difference in apparent T1 between NAD and α-ATP.

CONCLUSION We demonstrated for the first time that near complete resolution of NAD+/NADH from α-ATP with improved spectral baseline can be achieved by use of IR-based NAD spectral editing. It is expected that this novel method will improve accuracy and reliability in measuring brain NAD+/NADH levels and redox state. The method could be valuable in studying psychotic disorders and aging by monitoring alterations in NAD/NADH levels and redox state after various interventions.1-8

Acknowledgements

This work was supported by NIH grant P41 EB-015908 and an internal UTSW-AIRC grant FY18_IA0009.

References

1. Srivastava S. Emerging therapeutic roles for NAD(+) metabolism in mitochondrial and age-related disorders. Clin Transl Med. 2016;5(1):25.

2. Lu M, Zhu XH, Chen W. In vivo (31) P MRS assessment of intracellular NAD metabolites and NAD(+) /NADH redox state in human brain at 4 T. NMR Biomed. 2016;29(7):1010-7.

3. de Graaf RA, De Feyter HM, Brown PB, Nixon TW, Rothman DL, Behar KL. Detection of cerebral NAD+ in humans at 7T. Magn Reson Med. 2017;78(3):828-835.

4. Zhu XH, Lu M, Lee BY, Ugurbil K, Chen W. In vivo NAD assay reveals the intracellular NAD contents and redox state in healthy human brain and their age dependences. Proc Natl Acad Sci U S A. 2015;112(9):2876-81.

5. Kim SY, Cohen BM, Chen X, Lukas SE, Shinn AK, Yuksel AC, Li T, Du F, Öngür D. Redox Dysregulation in Schizophrenia Revealed by in vivo NAD+/NADH Measurement. Schizophr Bull. 2017;43(1):197-204.

6. Chouinard VA, Kim SY, Valeri L, Yuksel C, Ryan KP, Chouinard G, Cohen BM, Du F, Öngür D. Brain bioenergetics and redox state measured by 31P magnetic resonance spectroscopy in unaffected siblings of patients with psychotic disorders. Schizophr Res. 2017;187:11-16.

7. Ren J, Sherry AD, Malloy CR. 31P-MRS of healthy human brain: ATP synthesis, metabolite concentrations, pH, and T1 relaxation times. NMR Biomed. 2015;28(11):1455-62.

8. Xin L, Ipek Ö, Beaumont M, Shevlyakova M, Christinat N, Masoodi M, Greenberg N, Gruetter R, Cuenoud B. Nutritional Ketosis Increases NAD+/NADH Ratio in Healthy Human Brain: An in Vivo Study by 31P-MRS. Front Nutr. 2018;5:62.

Figures

Figure 1. A typical 7T 31P NMR spectrum acquired from the posterior region of a human brain using a partial volume coil . Note that NAD+/NADH and α-ATP signals severely overlap plus there is baseline distortion in chemical shift region from -5 to -15 ppm. Abbreviations: ATP, adenosine triphosphate; NAD, nicotinamide adenine dinucleotide; UDPG, uridine diphosphate glucose. PME, phosphomonoesters; PDE, phosphodiesters; and Pi, inorganic phosphate.

Figure 2. Spectral editing in 31P NMR spectra of human brain for resolving NAD/NADH and α-ATP resonances. The upfield region of the brain spectrum was acquired without (A) and with (B) the NAD-editing pulse. (C) The edited spectrum with subtraction B from A (C = AB f, f = 1.5). Note that, upon spectral editing, the NAD+/NADH signal is clearly resolved from the residual a-ATP signal, accompanied by significant improvement in the baseline. No baseline correction was performed in these data. Abbreviation: ATP, adenosine triphosphate; NAD, nicotinamide adenine dinucleotide; UDPG, uridine diphosphate glucose.

Figure 3. Evaluation of brain tissue redox, as reported by the NAD+/NADH ratio, using NAD-edited spectrum with minor baseline correction. (A) The NADH resonance was fit as a singlet and the NAD+ resonance was fit as an AB-spin quartet but UDPG was not included. This yielded a NAD+/NADH ratio of 2.73. (B) Fitting with inclusion of UDPG as two doublets, one of which resonates under the NAD resonance. This fitting yielded a NAD+/NADH ratio of 4.61. Abbreviations: ATP, adenosine triphosphate; NAD, nicotinamide adenine dinucleotide; UDPG, uridine diphosphate glucose.

Proc. Intl. Soc. Mag. Reson. Med. 27 (2019)
2499