2497
Undersampling strategies for compressed sensing accelerated MR spectroscopic imaging1SBHSE, Arizona State University, Tempe, AZ, United States, 2Department of Radiology and Medical Imaging, Banner MD Anderson Cancer Center, Glibert, AZ, United States
Synopsis
Magnetic Resonance Spectroscopic Imaging (MRSI) is an invaluable tool in cancer diagnosis due to its specificity but long scan times makes it less popular for routine clinical use. Clinical integration of accelerating methods such as compressed sensing (CS) can improve patient throughput. Two different undersampling strategies were implemented and statistical fidelity was tested to obtain a five-fold reduction is acquisition time; 1) a conventional variable density pseudorandom undersampling and 2) an a priori information based strategy that exploits anatomical scans. Statistical results from in vivo studies show the feasibility of using CS accelerated MRSI without loss of data fidelity.
Introduction:
In vivo magnetic resonance spectroscopic imaging (MRSI) enables the measurement of the spatial distribution of metabolite concentrations in tissues. Analysis and quantification of metabolites in clinical research aid in therapy assessment and diagnosis. Routine scan protocols do not include MRSI due to long acquisition time. Compressed sensing (CS) can accelerate MRSI by undersampling k-space and exploiting its inherent sparsity1. The choice of optimal undersampling is critical for accurate reconstruction. Retrospective studies with various undersampling strategies have shown that variable density undersampling and a priori undersampling are more suitable for accelerations up to 5×. Variable density undersampling dictates denser sampling at the lower frequency space with very few samples from the edges of k-space. A priori undersampling is determined based on the anatomical scout2. In this study, we demonstrate the prospective feasibility of the two aforementioned strategies in patient brain studies.Methods:
In vivo brain MRSI data was obtained from five patients screened for cancer on a GE Discovery 3T scanner with a 12-channel head coil. The protocol was approved by the institutional review board of the Banner M D Anderson Cancer Center. Written informed consent was obtained prior to the scan. Following the routine scans, T2 – weighted scout (TE/TR = 104/3000 ms, FOV = 22×22×10 cm, matrix = 128×128). Three consecutive 1H PRESS scans (TE/TR = 144/1200 ms, FOV 22×22×10 cm, matrix = 16×16×2048) were performed to obtain a) Fully sampled k-space, b) Variable density undersampled k-space, c) A priori undersampled k-space. A single variable density sampling pattern was used throughout the study. The a priori sampling pattern was generated using T2 weighted scout of the respective patient scan. The total MRSI scan time was ~15 min (Fully sampled PRESS: 5 min 12 sec, 2× Undersampled PRESS: 1 min 2 sec, rest: shimming and calibration). Post-acquisition, residual water and fat peaks were removed using Hanckle-Lanczos Singular Value Decomposition (HLSVD) filter followed by apodization. The CS reconstruction for the undersampled data was performed using Matlab based nonlinear conjugate gradient algorithm iteratively1. Normalized root mean square error (NRMSE) and voxel wise paired t-tests values were obtained to determine the statistical fidelity. Metabolite maps were generated for visual comparison.Results:
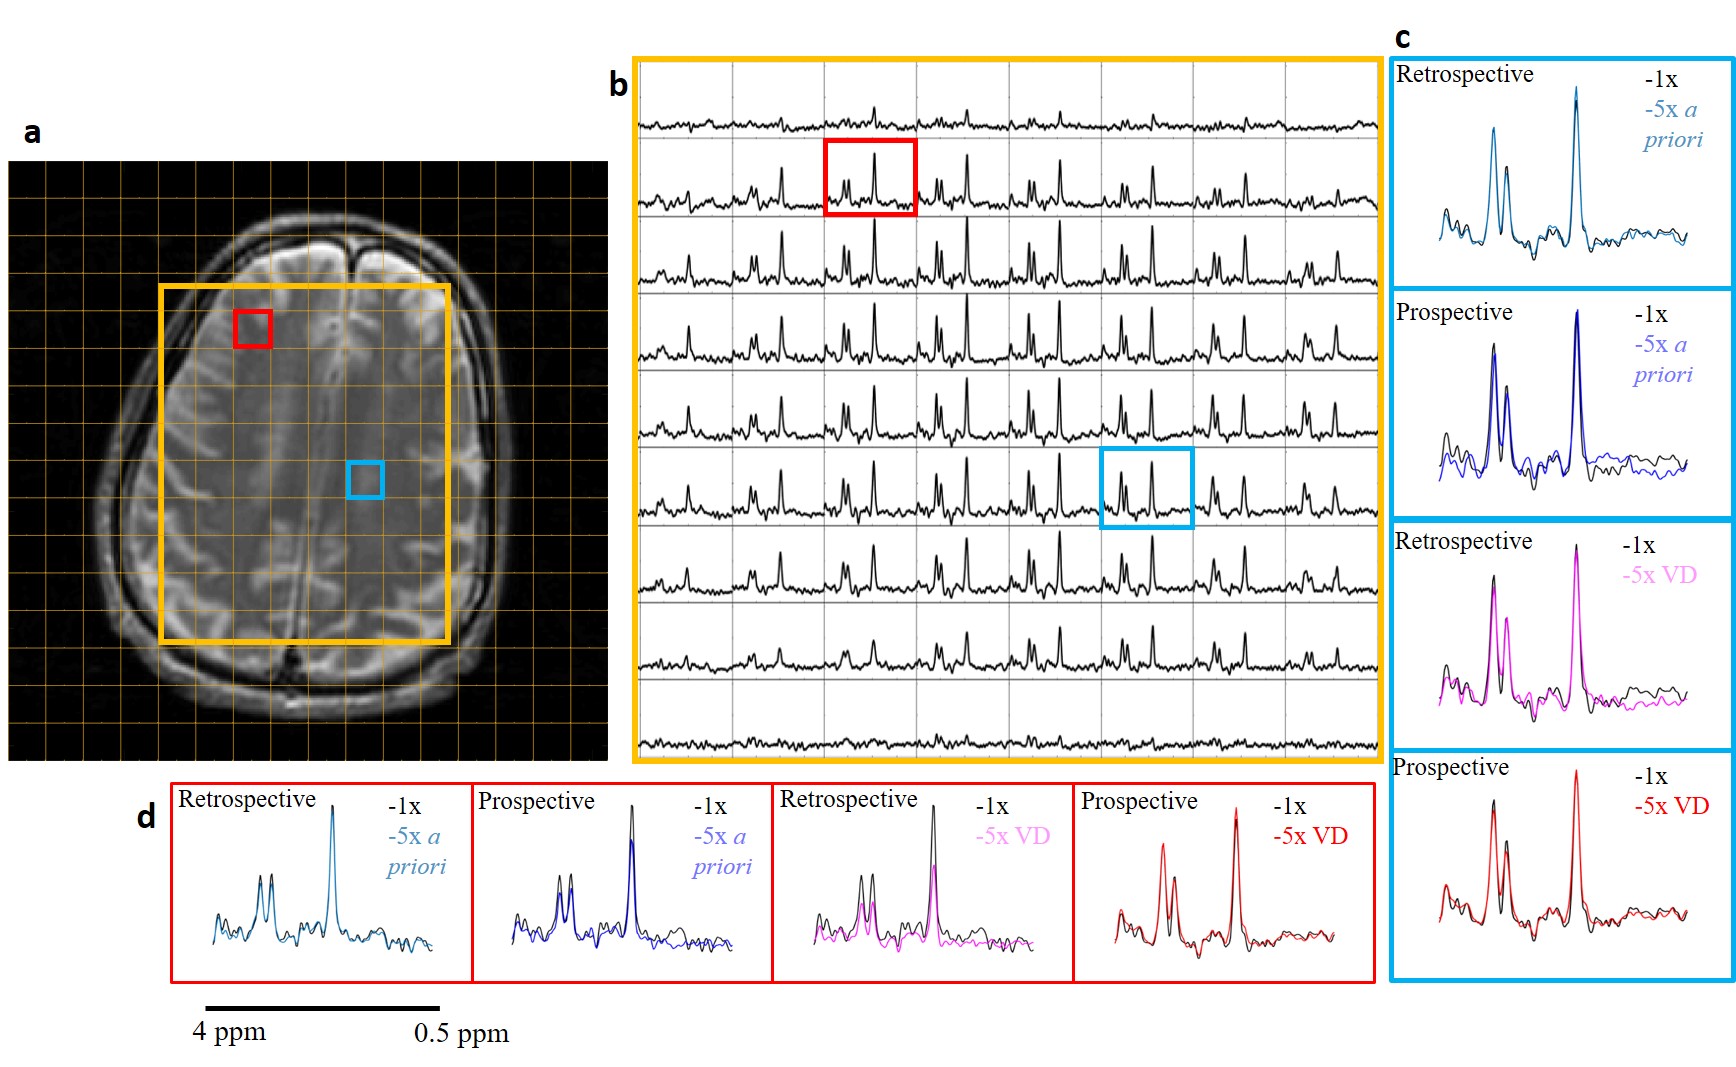
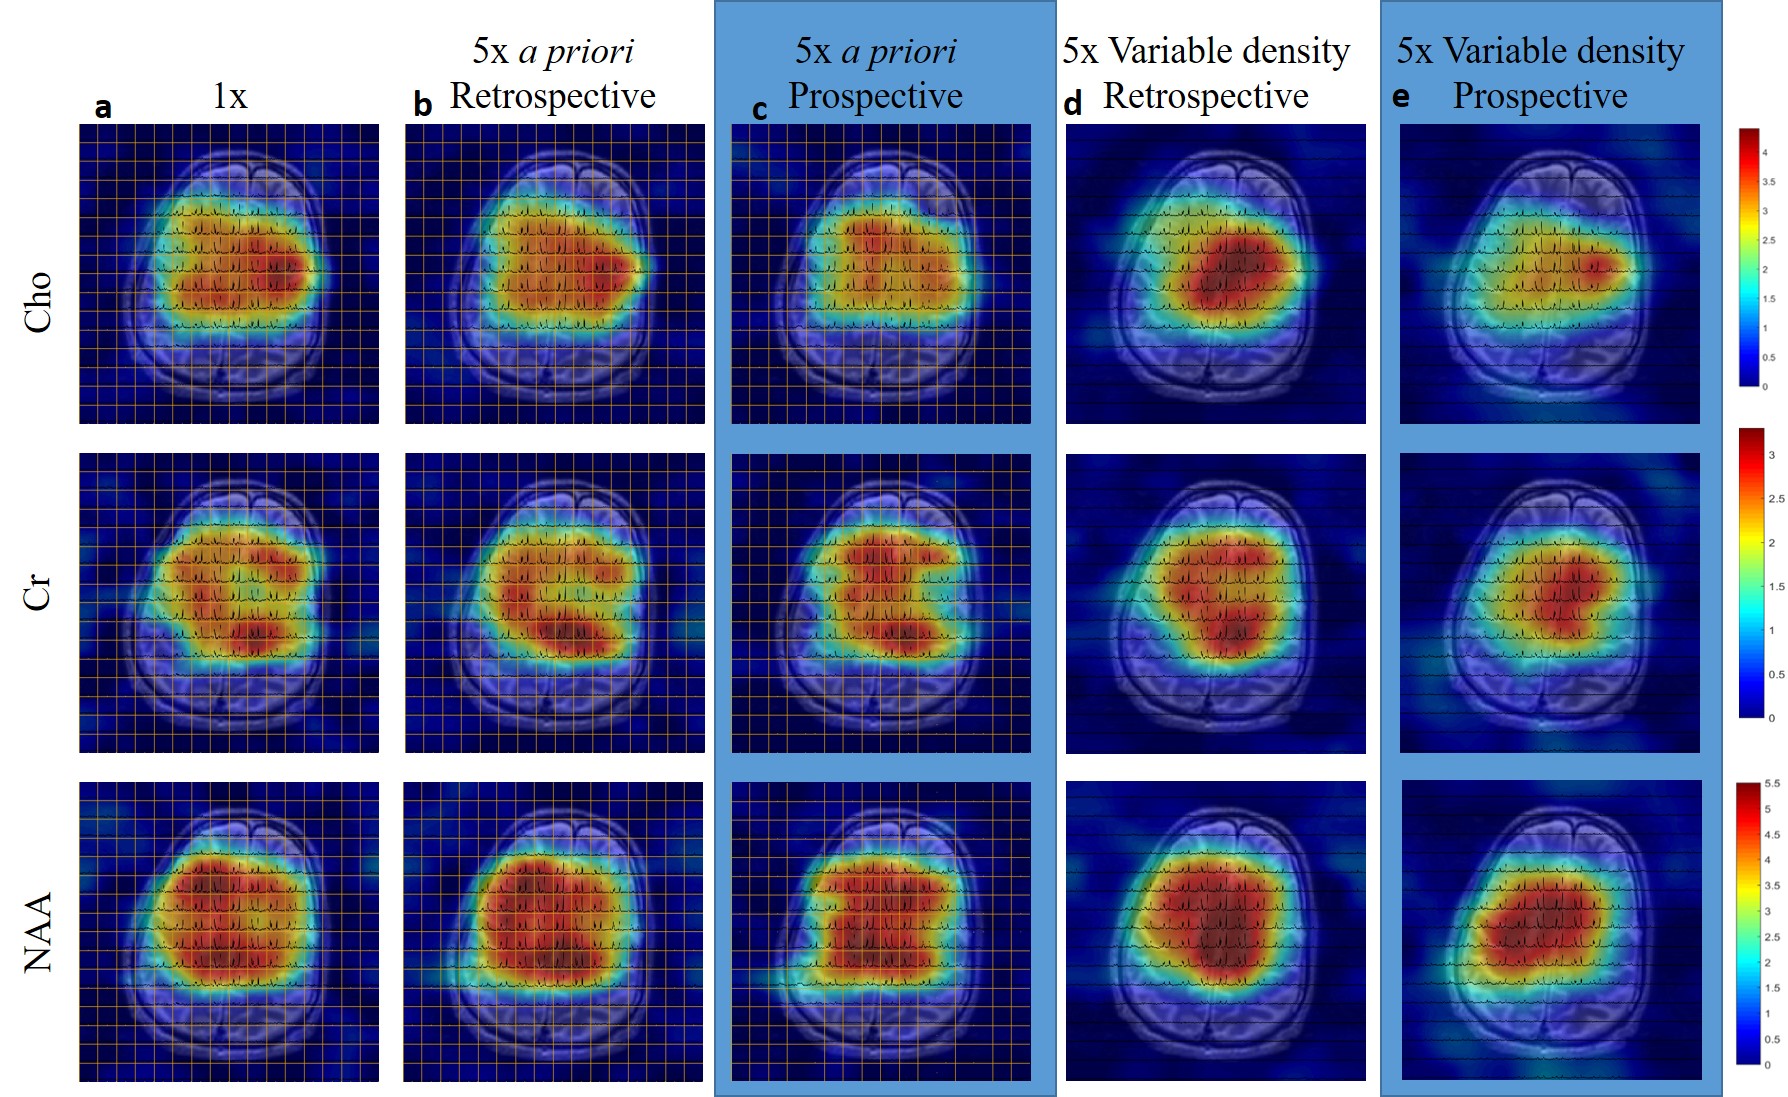
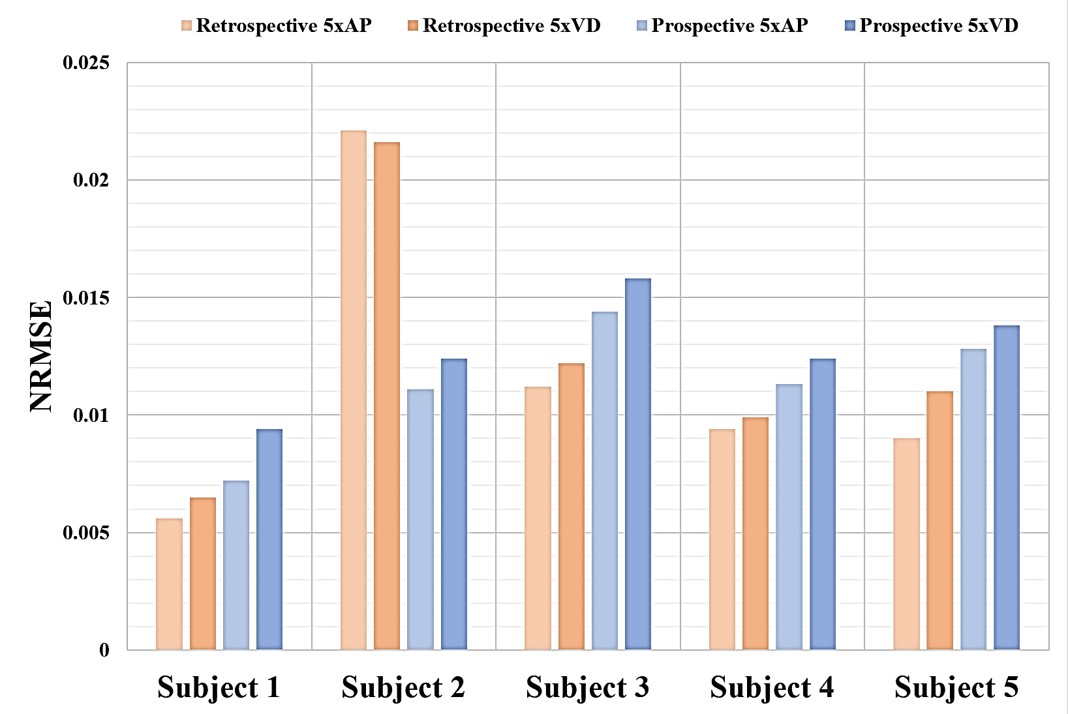
Figure 1 represents in vivo CS MRSI data from a healthy subject. The 5× undersampled data for both a priori and variable density sampling is compared with the fully sampled 1× spectra (c&d). The retrospective results show increased fidelity whereas the prospective spectra have a change in intensity levels in certain voxels. However, the ratios of the metabolite peaks are consistent through all cases. Figure 2 represents the metabolite maps for N-acetyl aspartate (NAA), creatine (Cr) and choline (Cr) obtained for the spectra in figure 1. The metabolite maps for the CS reconstructed a priori spectra shows minimal deviation from the fully sampled spectra. Figure 3 represents the normalized root mean squared error (NRMSE) between 1× spectra and respective 5× spectra with a maximum error up to 3%. Paired t-tests, performed for an integrated range between 0.5 ppm and 4 ppm, obtained values of p > 0.05 suggesting no statistical significance.Discussion and Conclusion:
A prospective CS accelerated data acquisition method was implemented for clinical studies. The CS reconstructed spectra for the a priori and variable density undersampled data maintained fidelity with the fully sampled data. While statistical comparisons showed less deviation from the fully sampled data in both variable density and a priori undersampled CS reconstructions, visually, the a priori undersampling could be more suitable for in vivo brain studies. Differences observed between prospective and retrospective reconstructions were due to residual motion during the scan, coil calibration and elapsed time between scans.Acknowledgements
No acknowledgement found.References
[1] Geethanath et al. Compressed sensing could accelerate 1H MR metabolic imaging in the clinic, Radiology; volume 262; Number 3 – 2012
[2] Shankar et al, Undersampling strategies for compressed sensing accelerated MR spectroscopic imaging; Proc. SPIE 10137, Medical Imaging 2017: Biomedical Applications in Molecular, Structural, and Functional Imaging, 101372I (13 March 2017); doi: 10.1117/12.2254614
Figures