2493
Spectroscopic imaging of macromolecule-suppressed J-difference editing of GABA at 3 Tesla1Department of Biomedical Engineering, The Johns Hopkins University School, Baltimore, MD, United States, 2Russell H. Morgan Department of Radiology and Radiological Science, The Johns Hopkins University School of Medicine, Baltimore, MD, United States, 3F. M. Kirby Research Center for Functional Brain Imaging, Kennedy Krieger Institute, Baltimore, MD, United States
Synopsis
In this study, the feasibility of macromolecule-suppressed MR spectroscopic imaging (MRSI) of GABA in the human brain at 3T was investigated. PRESS-localized MRSI was performed for both macromolecule (MM)) suppressed GABA and non-suppressed (GABA+) editing. GABA concentrations and MM fractions were assessed and compared. Data quality metrics (B0 homogeneity, and GABA and water fit errors) were also calculated. A significant linear correlation of GABA+ with GABA concentrations was found. MM-suppressed GABA and GABA+ concentrations agreed with previously reported single-voxel values. Data quality metrics were also similar to those of prior single-voxel acquisitions.
Purpose
In conventional J-difference of editing of GABA in vivo, an editing pulse is applied at 1.9 ppm which partially inverts the macromolecule (MM) resonance at 1.7 ppm (1-4), so that the detected 3.0 ppm signal contains components from both GABA and MM, making the contribution of GABA to the detected 3.0 ppm signal uncertain. To address this, symmetric-suppression (MM-suppressed GABA) has been used to separate GABA from MM based on their chemical shift differences (2, 3). This scheme has been used in studies with single voxel localization (3, 5-8) and multi-voxel localization at 7T (9). This abstract examines the feasibility of performing MM-suppressed GABA editing in combination with MR spectroscopic imaging (MRSI) at 3T.Methods
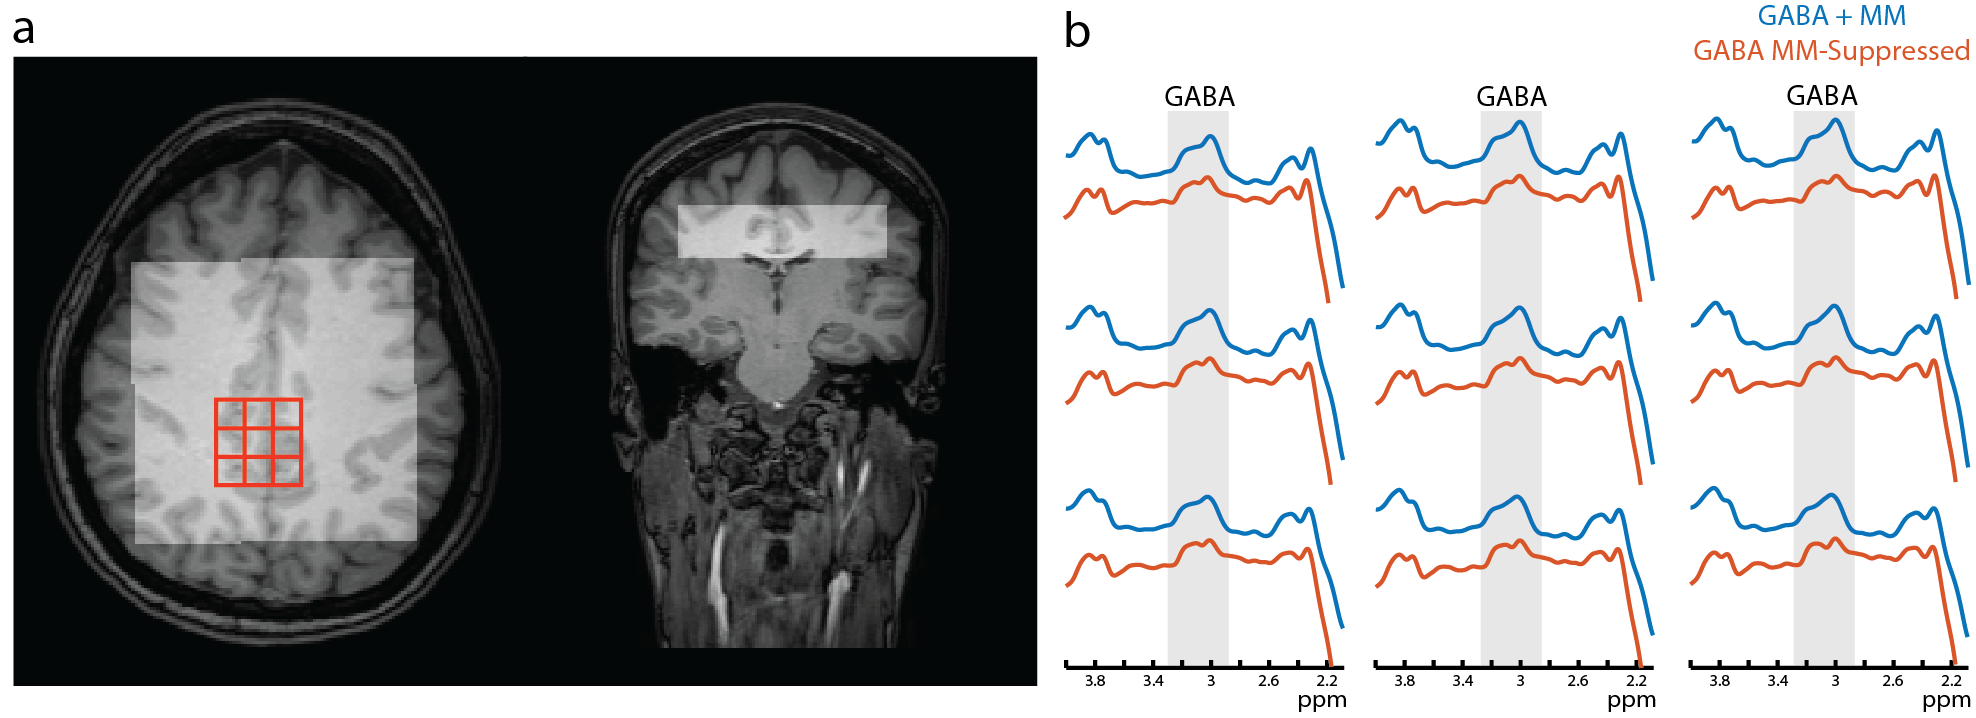
In vivo experiments were performed in 4 subjects (2 female; age 26.5 ± 1.3 years) on a Philips Achieva 3T scanner with a 32-channel head coil. The edited-MRSI sequence was a MEGA-PRESS pulse sequence with phase encoding gradients in 2 directions. Data were acquired at TE/TR = 80 ms/1.5s. For all edited-MRSI acquisitions, four averages were acquired for each phase-encoding step (2 ONs, 2 OFFs). Water-unsuppressed references were acquired at a TE of 29 ms for coil combination. One 2.3 cm transverse slice was acquired above the lateral ventricles with a field-of-view of 18 x 21.6 cm2 (LR x AP), PRESS volume-of-interest dimensions of 9 x 9 cm2, a nominal in-plane resolution and voxel volume of 1.8 x 1.8 cm2, and 7.5 cm3 respectively. Dual water and lipid suppression was achieved using the ‘HGDB’ sequence (10) and eight OVS pulses were also applied.
GABA+ acquisitions were acquired with the edit-ON pulse applied at 1.9 ppm and the edit-OFF pulse applied at 0.7 ppm. In the MM-suppressed GABA acquisition, the edit-OFF pulse was moved from 0.7 ppm to 1.5 ppm, so that the ‘ON’ and ‘OFF’ GABA editing pulses were symmetric about the 1.7 ppm MM resonance. Sinc-Gauss editing pulses were applied with a duration of 20 ms and bandwidth of 62 Hz.
GABA and GABA+ concentrations were estimated using the ‘Gannet’ program (11) relative to the unsuppressed water signal. To evaluate data quality, water linewidths, field offsets, GABA peak fit-errors, and water fit-errors were calculated for each voxel across the PRESS volume-of-interest. Fit-errors were calculated as the standard error in the amplitude coefficient. Only voxels with a GABA peak fit-error of less than 5% was included in further analyses.
Results
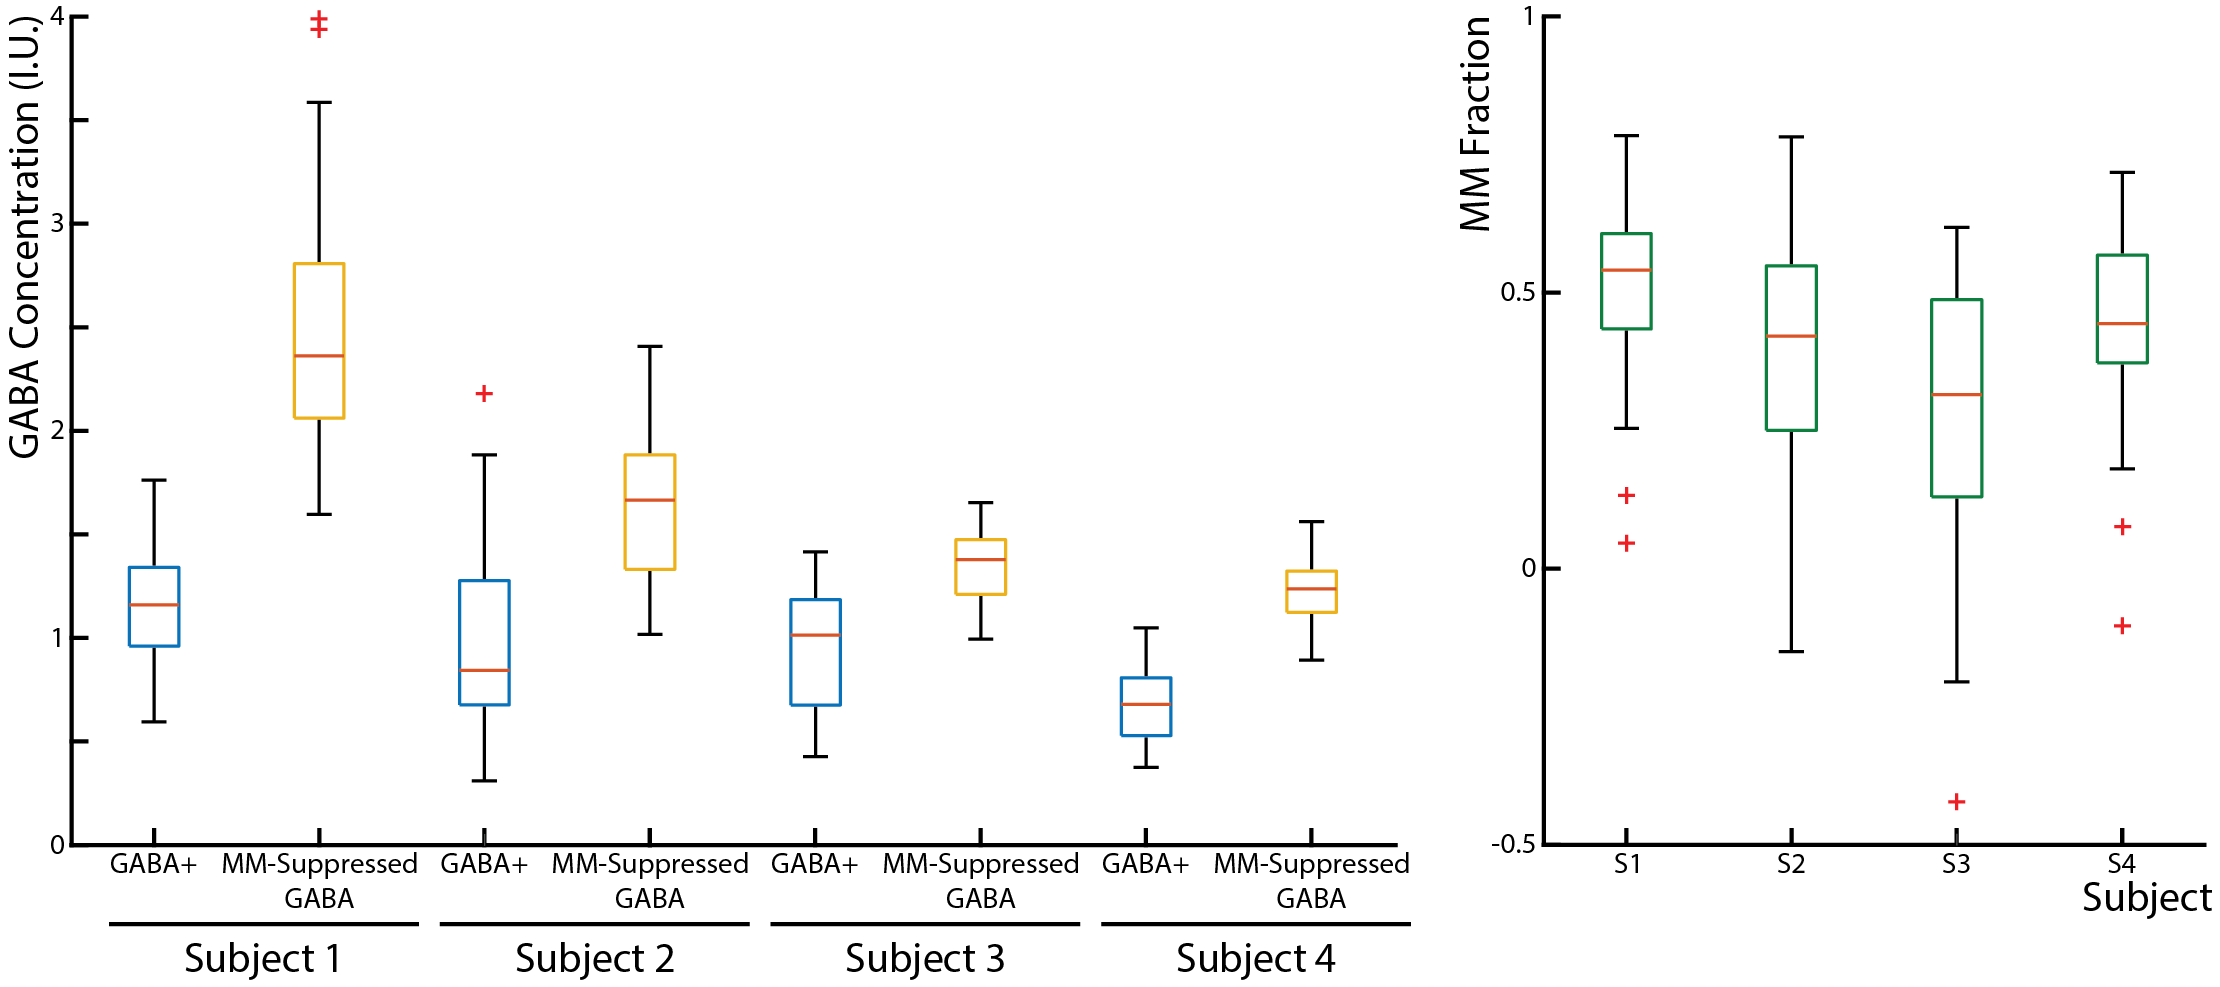
In vivo, the GABA+ peak is consistently larger than the MM-suppressed GABA peak (Figure 1). In addition, the distribution of the GABA+ concentrations is larger than that of the MM-suppressed concentrations (p << 0.001) (Figure 2a). The GABA+ concentration was 1.66 ± 0.51 i.u. and the MM-suppressed GABA concentration was 0.92 ± 0.21 which agree with GABA+ and MM-suppressed GABA concentrations from single-voxel acquisitions of ~1.7 i.u. and ~1.0 i.u. (12, 13). It can also be seen in Figure 2b that across subjects, the average MM fraction was 0.43 which is close to single-voxel reports of ~0.5 MM fraction (6, 12, 13).
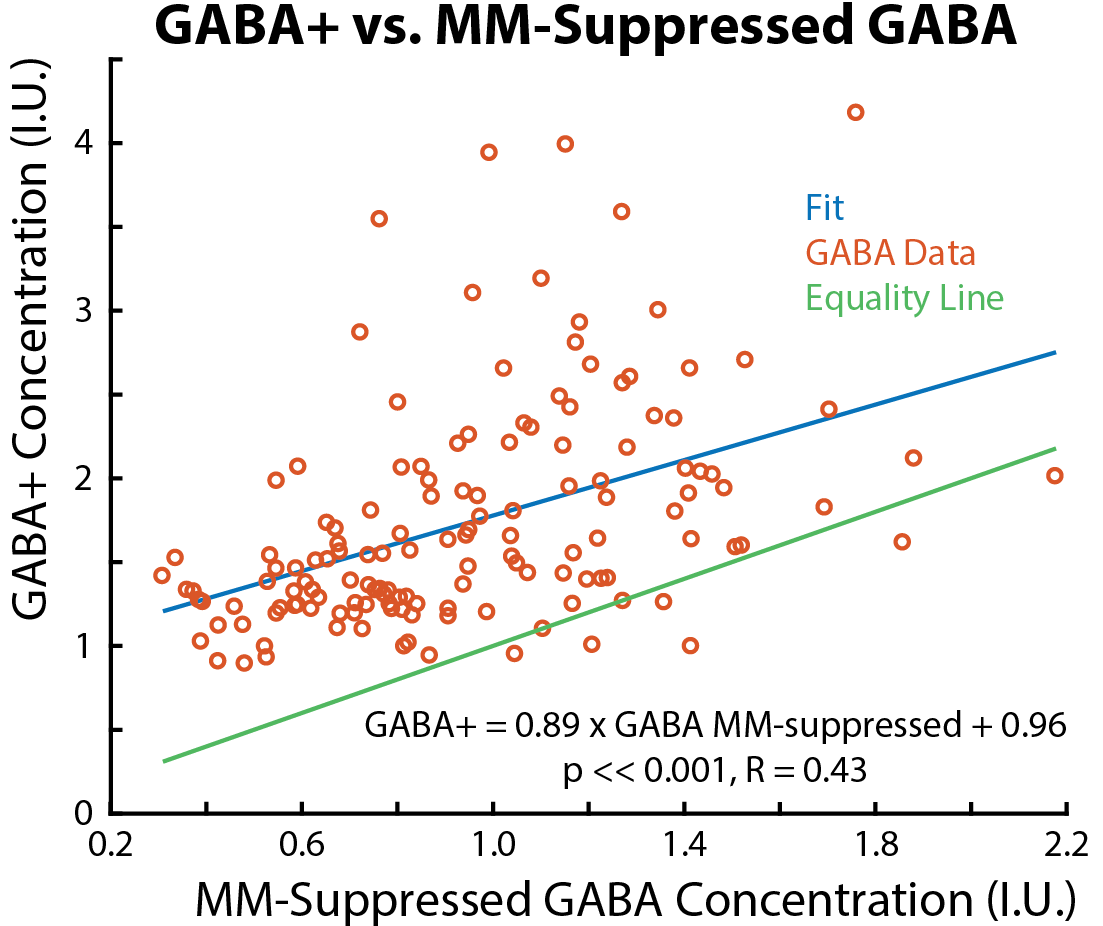
Table 1 shows data quality metrics for all subjects showing good field homogeneity and low fit errors for water and GABA. A correlation between GABA and GABA+ was found (Figure 3). This agrees with a previous single-voxel study which presented evidence on a possible correlation between the two values in the sensorimotor cortex, which is partially included in the PRESS-localized volume (6). In addition, most MM-suppressed GABA/GABA+ voxel pairs (94%) lie above the equality line indicating that GABA+ concentrations are consistently larger than MM-suppressed GABA concentrations (Figure 3).
Discussion
It is demonstrated that MM-suppressed GABA MRSI is feasible at 3T. Over the relatively limited coverage of the PRESS-MRSI acquisition, MM-suppressed GABA concentrations, macromolecule fractions, and water linewidths were comparable to those obtained in prior single-voxel acquisitions. Given good field homogeneity and scanner compliant subjects, performing MM-suppressed GABA MRSI at 3T is possible.Acknowledgements
This work was supported by P41 EB015909.References
1. Behar KL et al. Magn Reson Med 1994;32:294–302.
2.
Henry PG et al. Magn Reson Med. 2001;45:517–520.
3.
Edden RAE et al. Magn. Reson. Med.
2012;68:657–661.
4.
Rothman DL et al. Proc Natl Acad Sci USA
1993;90:5662–5666.
5.
Edden RAE et al. J. Magn. Reson. Imaging
2016;44:1474–1482.
6.
Harris AD et al. 2015;1529:1523–1529.
7.
Rowland LM et al. Mol. Psychiatry
2016;21:198–204.
8.
Aufhaus E et al. Magn. Reson. Med.
2013;69:317–320.
9.
Moser P et al. Neuroimage 2019;184:475–489.
10. Zhu H et al.
Magn. Reson. Med. 2010;63:1486–1492.
11. Edden RAE et
al. J. Magn. Reson. Imaging 2013;1452:1445–1452.
12. Mullins
PG et al. Neuroimage. 2014;86:43–52.
13. Oeltzschner
G et al. NMR Biomed. 2018;31:e3844
Figures