2487
Detection of Choline, Glycine and Myo-inositol in Malignant Breast Cancer In-vivo Using Multi-dimensional Spectroscopic Imaging1Radiological Sciences, University of California, Los Angeles, Los Angeles, CA, United States, 2Surgery, University of California, Los Angeles, Los Angeles, CA, United States
Synopsis
Multi-parametric MR techniques have been used to diagnose and monitor the therapeutic outcome of cancer in the breast and other tissues and organs. One-dimensional MRSI has shown significantly elevated choline and higher water-to-fat ratio in malignant tumors as compared to healthy controls. Two-dimensional MRS resolves peaks along an additional spectral dimension which overcomes the overlap limitation of 1D MRSI, thereby providing more discriminatory information for developing non-invasive methods for cancer grade determination. This study presents the first application of an accelerated, echo-planar based technique that acquires correlated (2D) spectroscopy data for each voxel of 1.5ml resolution within a 3D volume (5D EP-COSI) in breast cancer. Our preliminary results in a pilot cohort of malignant and breast cancer patients demonstrate changes in unsaturated fatty acids and increased choline in malignant group compared to benign and healthy women. These pilot results indicate the potential application of the 5D EP-COSI technique which may be useful in improving the specificity of breast cancer.
Introduction
Magnetic resonance imaging and spectroscopy (MRI/MRS) have been applied to diagnose and monitor the therapeutic outcome of cancer in the breast and other tissues and organs. Dynamic contrast-enhanced (DCE)-MRI has high sensitivity in detecting the presence of cancerous lesions, however the addition of magnetic resonance spectroscopic imaging (MRSI) greatly improves the specificity of diagnosis1-4. One-dimensional MRSI has shown significantly elevated choline and higher water-to-fat ratio in malignant tumors as compared to healthy controls. Due to peak overlap in 1D MRS methods, however, the correlation between lipid and other metabolite levels and cancer grade can be obscured. Two-dimensional MRS resolves peak information along an additional spectral dimension which overcomes the overlap limitation of 1D MRSI, thereby providing more discriminatory information for developing non-invasive methods for cancer grade determination. This study presents the first application of an accelerated, echo-planar based technique that acquires correlated (2D) spectroscopy data for each voxel of 1.5ml resolution within a 3D volume (5D EP-COSI)5-6 in breast cancer.Methods
Subjects
with malignant (n=20, mean age of 53.2 years) and benign (n=11, mean age of
36.7 years) breast cancer as well as 7 healthy volunteers (mean age of 38.7
years) were recruited as part of an IRB-approved study to record 5D EP-COSI
data on a 3T scanner with the following parameters: TR = 1.5 s, TE = 35 ms,
voxel size = 1.0 × 1.0 × 1.5 cm3, matrix size = 16 × 16 × 8,
spectral width SW2 = 1190 Hz, SW1 = 1250 Hz, 512 t2
points, 64 t1 increments. A non-water-suppressed EP-COSI data with t1=1
was also recorded. Both water and non-water-suppressed scans were acquired for
a total scan time of 28.8 minutes. The data was non-uniformly undersampled in
the ky-kz space and t1 dimensions with an
acceleration factor of 8, and reconstructed using Group Sparsity-based
compressed sensing6. EP-COSI data taken from 12 malignant, 6 benign
and 5 healthy cases were considered and compared qualitatively. Voxels
corresponding to the tumor region in both benign and malignant cancer patients
were determined based on the subtraction images from clinically-obtained
DCE-MRI.Results
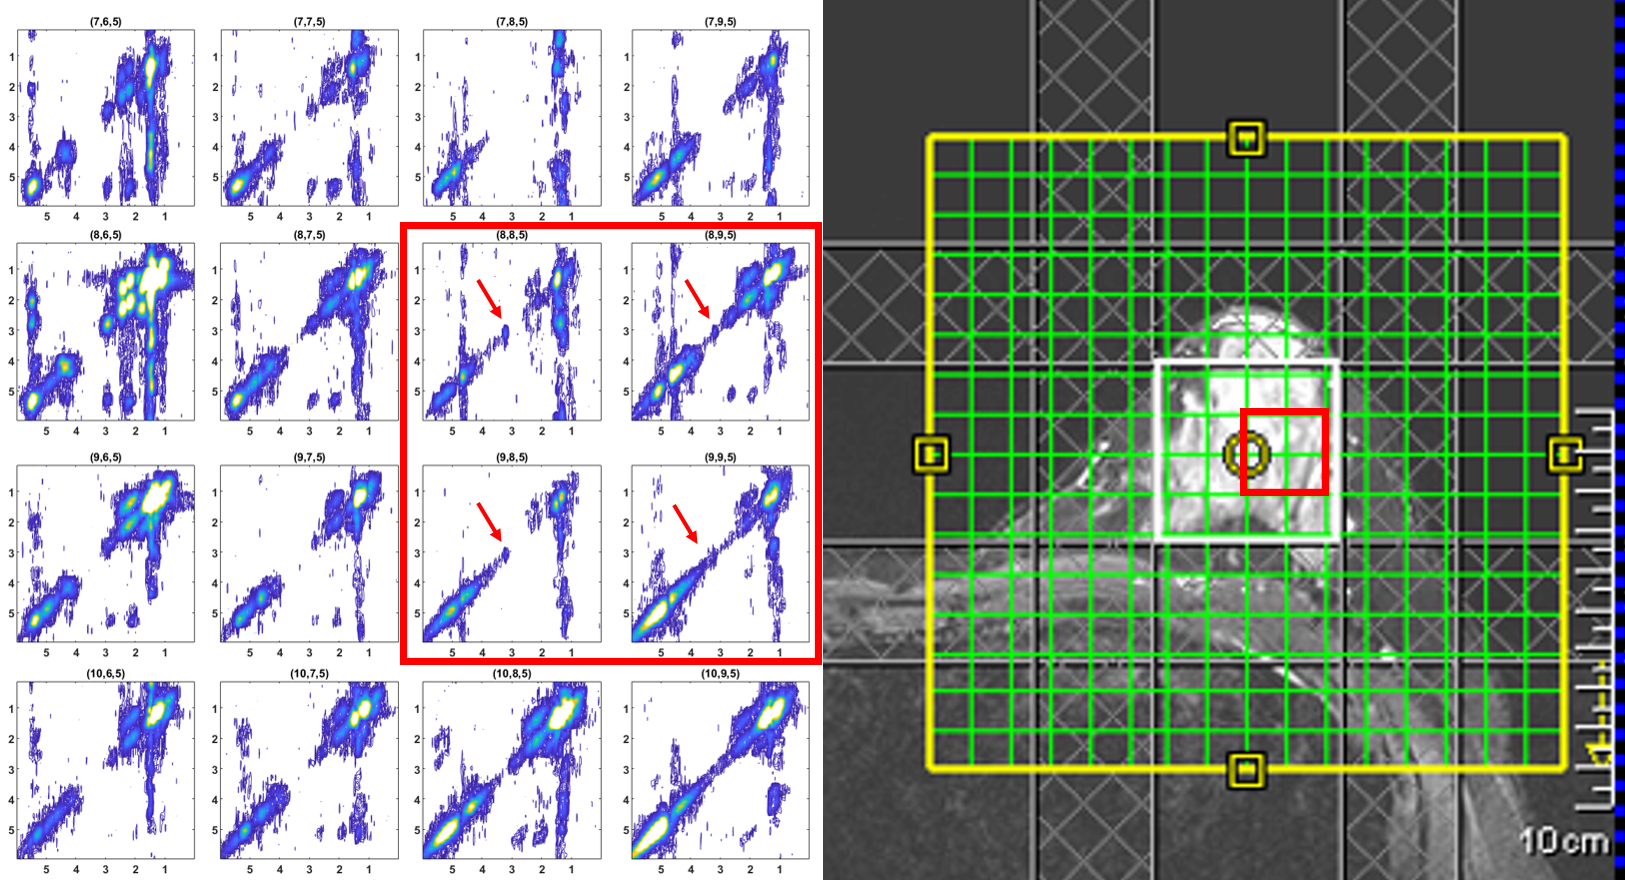
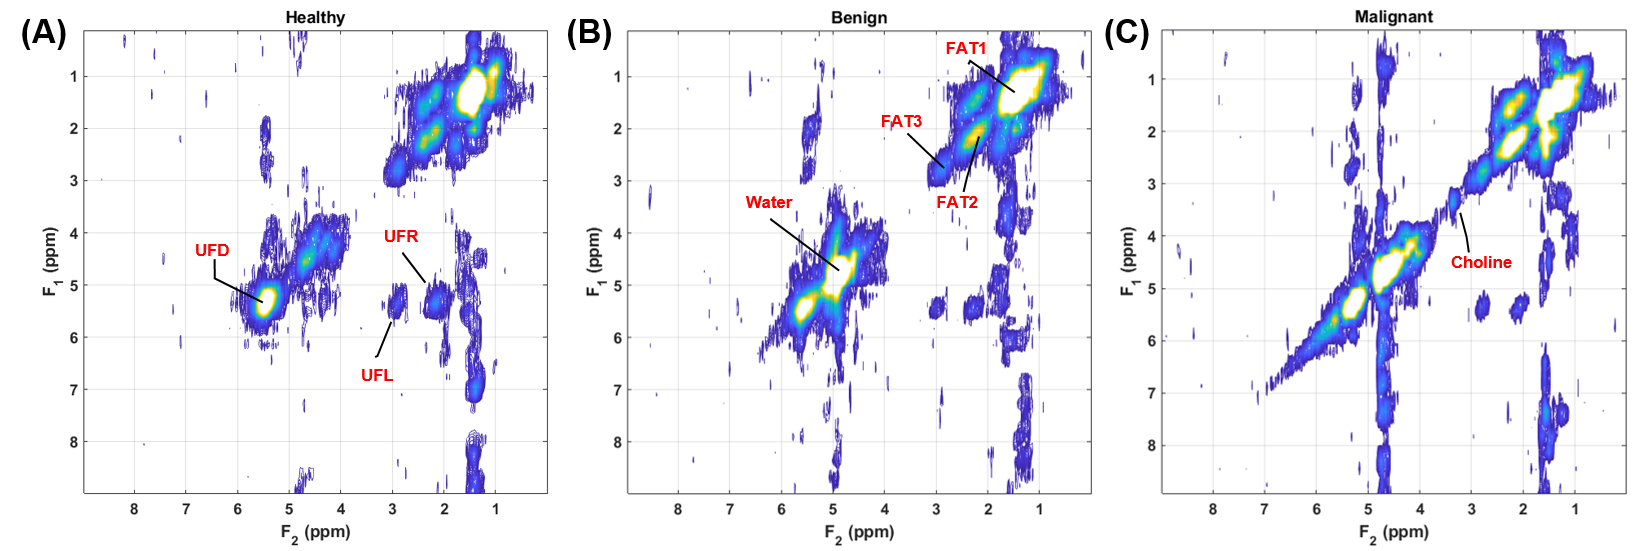
The 5D EP-COSI technique records 2D MRS data within multiple slices, allowing for broad coverage of the tumor volume (Figure 1(A)). Figure 1(B) shows the chemical shift image of methylene fat (1.4 ppm) demonstrating localization accuracy. The location of the tumor region from a malignant patient and the corresponding COSY spectra is demonstrated in Figure 2, which shows the presence of elevated choline and water, in contrast to the surrounding region. Malignant and benign tumors both present high water content, though choline is elevated only in malignant cases (Figure 3). Additional metabolites in the 3-4 ppm region, such as myo-Inositol, glycine, and taurine are also measureable (Figure 4). Figure 5(A) shows choline-to-fat ratio (Cho/Fat) as a function of cancer grade among the 12 malignant patients. Cho/Fat ratio was able to distinguish the cancer grades and progressive increase was observed with the increasing grades. Figure 5(B) shows the distribution of Cho/Fat as a function of Ki-67 metric.Discussion
Our preliminary results in a pilot cohort of malignant and breast cancer patients demonstrate changes in unsaturated fatty acids and increased choline in malignant group compared to benign and healthy women. In contrast, earlier reports using 1D MRS quantified the lipid peak at 1.4ppm only 1-3. Several ex vivo high resolution magic angle spinning (HR-MAS) studies have reported detection of choline, glycine, taurine, myo-inositol and more7-8. For the first time, our preliminary multi-dimensional MR Spectroscopic Imaging data has shown the feasibility of detecting many metabolites more than choline similar to reported by ex vivo MRS studies. One of the drawbacks of this study was due to chemical shift displacement errors (CSDE) by using conventional slice-selective 90 degree RF pulses and CSDE may have eliminated detection of uridine diphosphate hexose and other metabolites in the low field region; this can be minimized using adiabatic RF pulses.Conclusion
Our pilot results indicate the potential application of the 5D EP-COSI technique which may be useful in improving the specificity of breast cancer. Further investigation using a larger cohort of breast cancer patients will be necessary in the future.Acknowledgements
This research was supported by a CDMRP Breakthrough Step I award #W81XWH-16-1-0524.References
1) Sharma U, Agarwal K, Sah RG,,, et al. Can Multi-Parametric MR Based Approach Improve the Predictive Value of Pathological and Clinical Therapeutic Response in Breast Cancer Patients?. Front Oncol. 2018 Aug 15;8:319.. eCollection 2018. Epub Ahead.
2) Bolan PJ, Kim E, Herman BA,, et al. MR spectroscopy of breast cancer for assessing early treatment response: Results from the ACRIN 6657 MRS trial.. J Magn Reson Imaging. 2017 Jul;46(1):290-302. Epub 2016 Dec 16.
3) Nelson MT, Everson LI, Garwood M, Emory T, Bolan PJ. MR Spectroscopy in the diagnosis and treatment of breast cancer.. Semin Breast Dis. 2008 Jun 1;11(2):100-105.
4)Lipnick et al. Combined DCE-MRI and single-voxel 2D MRS for differentiation between benign and malignant breast lesions. NMR in Biomedicine, 2010; 23 (8): 922-930.
5) Wilson NE, Burns BL, Iqbal Z, Thomas MA. Correlated spectroscopic imaging of calf muscle in three spatial dimensions using group sparse reconstruction of undersampled single and multichannel data.. Magn Reson Med2015;74:1199–208.
6) Burns et al. Group sparse reconstruction of multi-dimensional spectroscopic imaging in human brain in vivo. Algorithms, 2014; 7(3): 276-294.
7) Haukaas TH, Euceda LR, Giskeodegard GF, Bathen TF. Metabolic portraits of breast cancer by HR MAS MR Spectroscopy of intact tissue samples. Metabolites 2017;7, pii: E18.
8) Choi JS, Baek HM, Kim S, et al. HR-MAS MR spectroscopy of breast cancer tissue obtained with core needle biopsy: correlation with prognostic factors. PLoS One 2012;7:e51712.
Figures