2485
How does spatial resolution affect the spectral quality and quantification accuracy of whole-brain MRSI? A simulation study at 1.5T, 3T, 7T and 9.4T1Department of Biomedical Imaging and Image-guided Therapy, High Field MR Centre, Medical University of Vienna, Vienna, Austria, 2Department of Radiology, Martinos Center for Biomedical Imaging, Massachusetts General Hospital, Harvard Medical School, Boston, MA, United States, 3Department of Cognitive Neuroscience, Maastricht University, Maastricht, Netherlands
Synopsis
The quality of MRSI data depends strongly on B0 inhomogeneities, which cause broadening of metabolite resonances and decrease signal-to-noise ratios (SNR). B0 inhomogeneity is more severe at higher B0 field, diminishing the expected SNR and spectral resolution improvements. We have created simulation models which allow us to investigate how the spectral quality and quantification accuracy of MRSI changes with increasing spatial resolution and B0 field strength, using experimentally acquired data from 1.5T, 3T, 7T, and 9.4T. These simulations show not only that accurate MRSI quantification generally benefits from smaller voxels, but it does so particularly at UHF.
INTRODUCTION
The quality of MRSI data depends strongly on the homogeneity of the main magnetic (B0) field, in particular that within each voxel. B0 inhomogeneities cause several problems such as increased spectral linewidths, decreased signal-to-noise ratios (SNR), or poor performance of frequency selective (suppression) pulses. These B0 inhomogeneities are more severe at higher B0 field, thereby diminishing the theoretically expected SNR and spectral resolution improvements at higher B0. To tackle these problems, B0 inhomogeneities are typically mitigated by superposition of additional magnetic B0 fields in form of spherical harmonics(1) and more recently by matrix B0 shims(2). A hardware-independent approach is to increase the spatial resolution, which reduces intra-voxel B0 inhomogeneities, but the ability to do so is limited by the available SNR per voxel and the maximum acceptable acquisition time(3–5). The associated spectral resolution improvements have been experimentally investigated by previous studies at ≤3T, but the effects should be even more pronounced beyond 3T. Therefore, in this study, we created whole-brain MRSI simulation models based on experimentally measured MRI data. The simulation models allow us to investigate how not only the spectral quality of the MRSI data, but also how the quantification accuracy change with increasing spatial resolution and increasing B0 field.METHODS
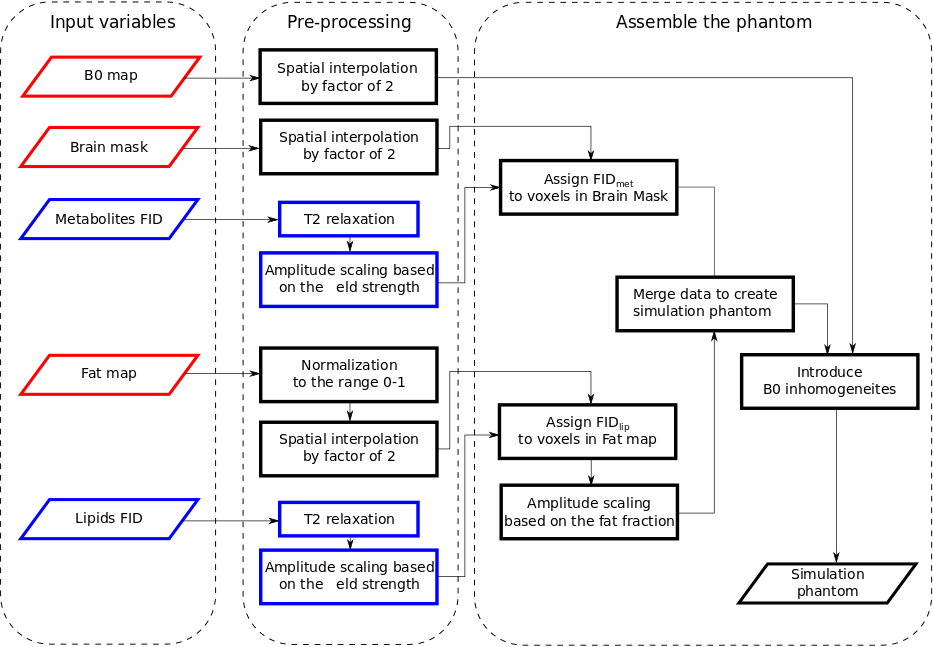
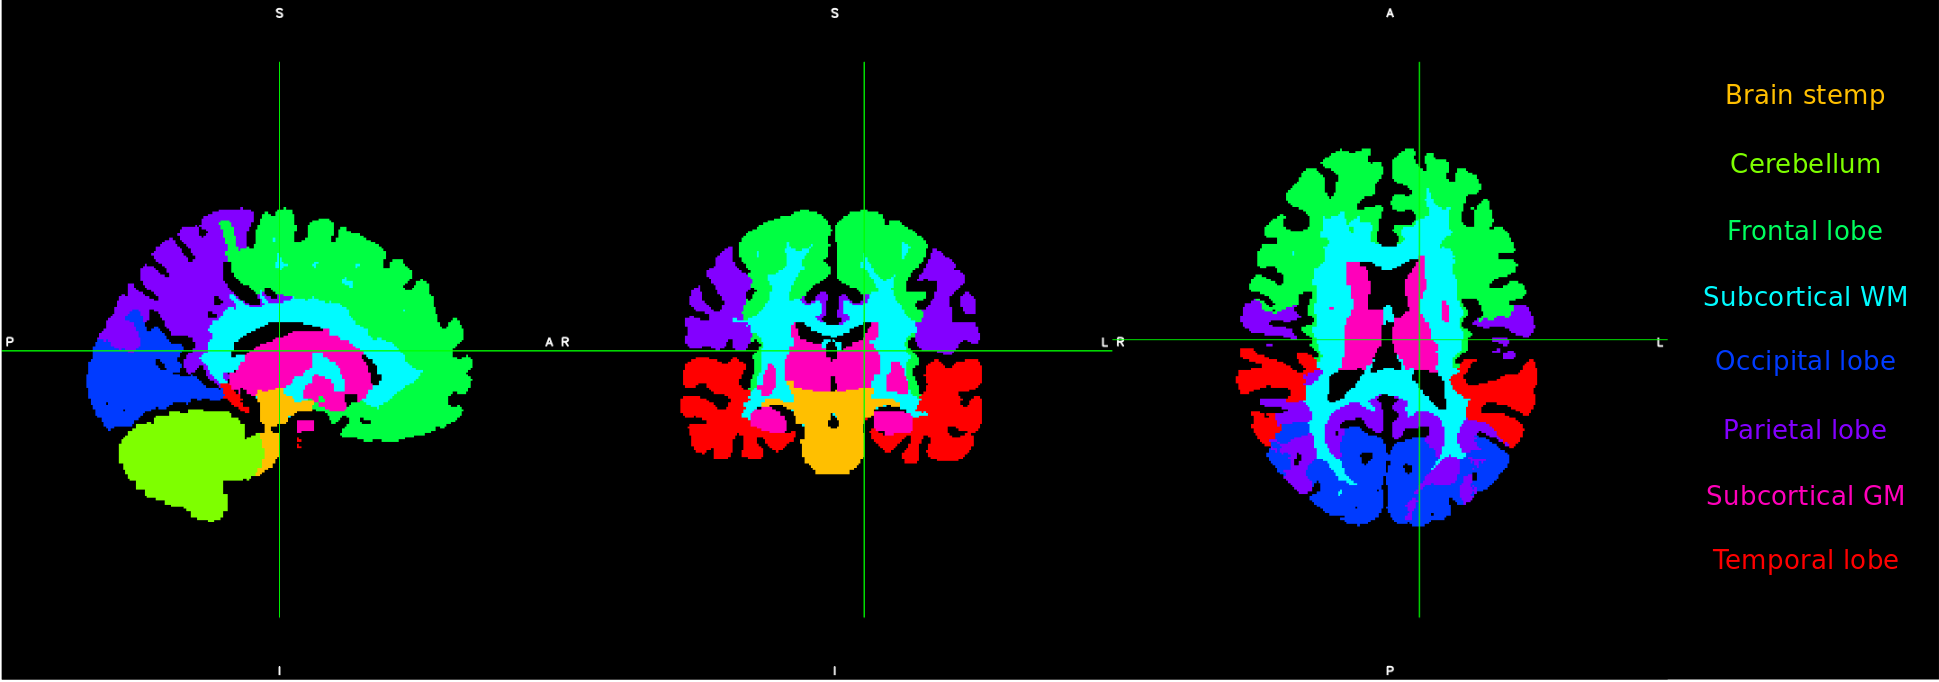
The same five healthy volunteers (age 24-38, 4 male, 1 female) were measured at four MR scanners (1.5T Aera, 3T Prisma, 7T Magnetom and 9.4T Magnetom; all Siemens Healthineers Erlangen, Germany). B0 maps and MP(2)RAGE were measured on all scanners using matched gradient echo sequences. Coil combination was performed by ASPIRE (6) and phase unwrapping by UMPIRE (7). Fat maps (Dixon imaging) were measured at 3T. All data of one volunteer were then coregistered to 3T data. The FID signals of metabolites (NAA, NAAG, Glu, Gln, PCr, Cr, PCH, GPC and m-Ins) and lipids (5 resonances (8)) were simulated in jMRUI(9). In the simulation model (Figure 1), all brain tissue voxels contained the same FID signal. Lipids voxels consisted of amplitude-scaled FIDs of lipids (based on the intensity of fat maps). Then B0 inhomogeneities were introduced. MRSI data were simulated with three different spatial resolutions, filtered by spatial Hamming filter and fitted by LCModel(10). FWHM and SNR of every voxel were estimated from the NAA fit. The precision of the spectral fit was assessed by thresholding metabolites CRLBs. The accuracy of the metabolite estimation was assessed by the Absolute-percentage-error (APE) from the gold standard. Since every metabolite voxel contained the same FID signal at the beginning of the simulation, the constant concentration was assumed as the gold standard. Evaluation was performed for the whole brain volume and also region-wise (Figure 2).RESULTS
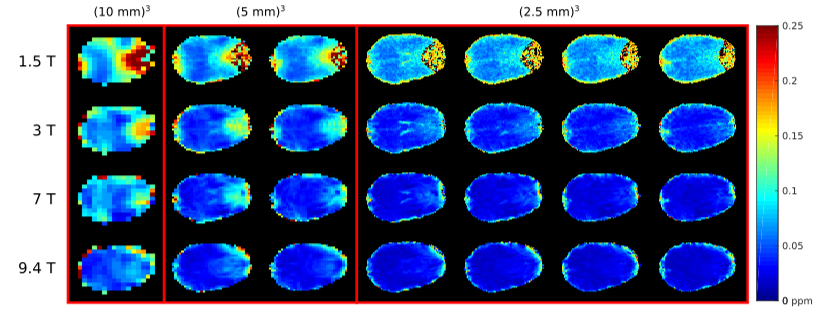
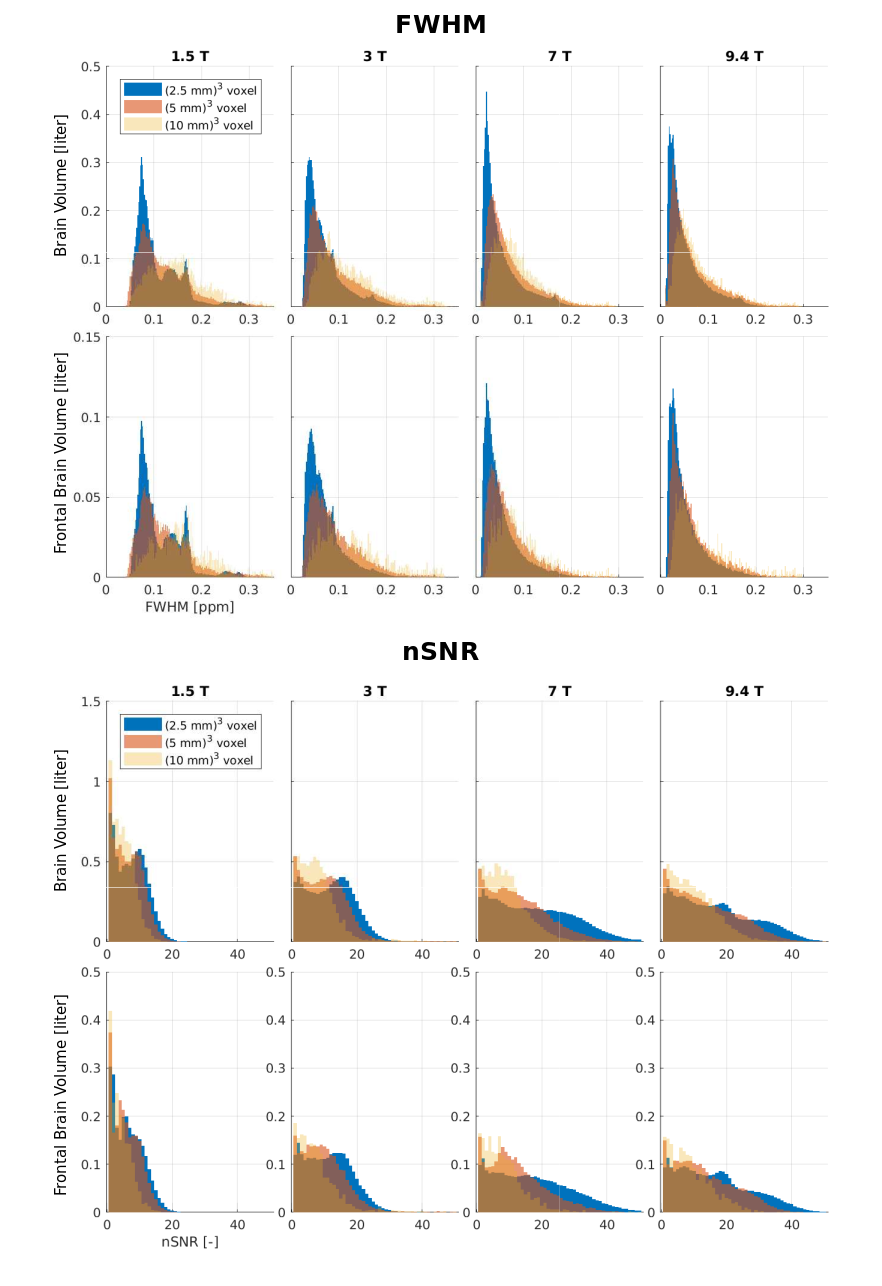
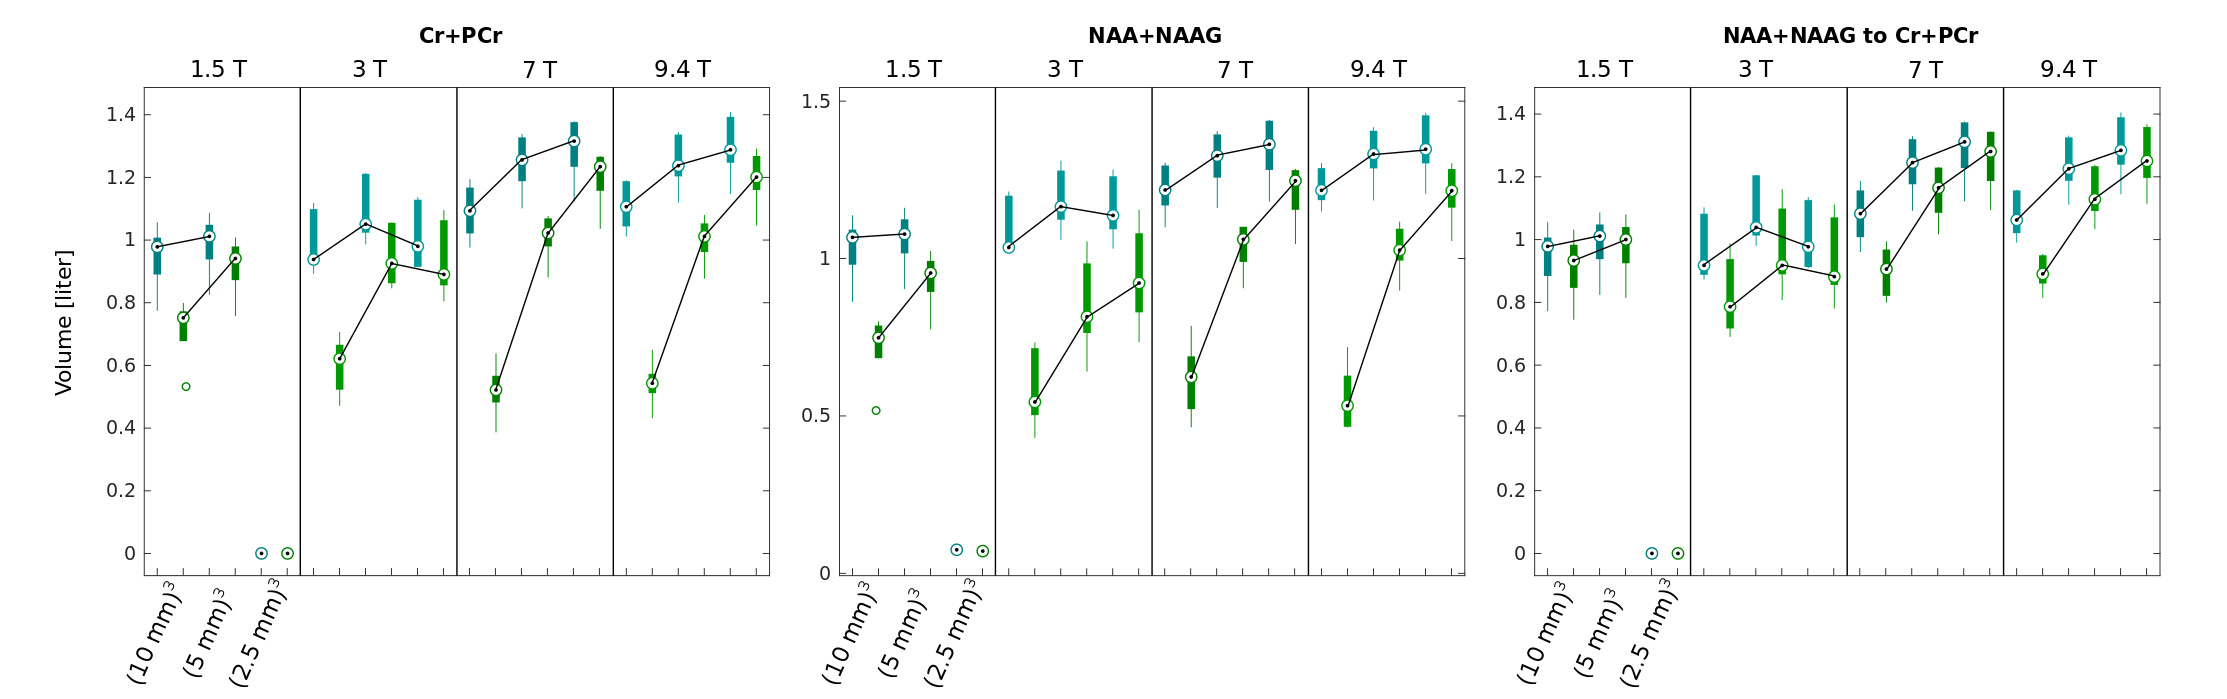
With increasing spatial resolution, the FWHM distributions (Figure 4) shifted to lower values and became taller and narrower, e.g. at 7T the median values from the whole brain were: 0.073, 0.055 and 0.038 ppm with interquartile ranges 0.062, 0.058 and 0.045 ppm for low, intermediate and high resolution, respectively. The FWHM also decreased with increasing B0: the median values for intermediate resolution were 0.106, 0.074, 0.055 and 0.038 ppm for 1.5T, 3T, 7T and 9.4T, respectively. Spatial dependency of this improvement is shown in Figure 3.The nSNR (normalized to voxel volume) distributions (Figure 4) became smaller and broader with increasing spatial resolution. The amount of change was increasing with B0. The interquartile ranges (IQRs) at 7T were 8.20, 13.07 and 19.45 (low/inter/high res.). For the intermediate resolution the IQRs were 6.87, 9.86, 13.07 and 15.33 (1.5T/3T/7T/9.4T).The volume with sufficient precision for the metabolite estimation increased with increasing B0 and spatial resolution (Figure 5). However, the volume with sufficient accuracy for estimation depended more on the spatial resolution. The volumes for low spatial resolution are very similar across all B0s, however, with increasing spatial resolution the volumes increased and B0 dependency was revealed.DISCUSSION & CONCLUSION
Increasing B0 yields lower FWHM (in ppm) and increased nSNR. The lower FWHM are in agreement with Otazo et al. (11). The increase in the IQR for nSNR histograms reflects the fact that the nSNR increase cannot be generalized over the whole volume, as some regions benefit more than others.Increasing spatial resolution also yield lower FWHM and higher nSNR, which is in agreement with previous publications(4,5) consistent with the hypothesis that smaller voxels have reduced intra-voxel B0 inhomogeneities making spectral peaks narrower and higher (higher nSNR). Finally this spectral resolution improvement results in larger volumes with sufficient precision and accuracy. Thus, our simulations provide not only evidence that accurate MRSI quantification generally benefits from smaller voxels, but it does so particularly at ultra-high field beyond 3T.Acknowledgements
This study was supported by the Austrian Science Fund (FWF): P 30701 and KLI 718. The 9.4T acquisitions in this study were supported by the Scannexus IDEA Meeting challenge 2016.
References
1. Stockmann JP, Wald LL. In vivo B0 field shimming methods for MRI at 7 T. Neuroimage 2018;168:71–87 doi: 10.1016/J.NEUROIMAGE.2017.06.013.
2. Stockmann JP, Witzel T, Keil B, et al. A 32-channel combined RF and B0 shim array for 3T brain imaging. Magn. Reson. Med. 2016;75:441–51 doi: 10.1002/mrm.25587.
3. Ebel A, Maudsley AA. Improved spectral quality for 3D MR spectroscopic imaging using a high spatial resolution acquisition strategy. Magn. Reson. Imaging 2003;21:113–120 doi: 10.1016/S0730-725X(02)00645-8.
4. Gruber S, Mlynárik V, Moser E. High-resolution 3D proton spectroscopic imaging of the human brain at 3 T: SNR issues and application for anatomy-matched voxel sizes. Magn. Reson. Med. 2003;49:299–306 doi: 10.1002/mrm.10377.
5. Li BSY, Regal J, Gonen O. SNR versus resolution in 3D1H MRS of the human brain at high magnetic fields. Magn. Reson. Med. 2001;46:1049–1053 doi: 10.1002/mrm.1297.
6. Eckstein K, Dymerska B, Bachrata B, et al. Computationally Efficient Combination of Multi-channel Phase Data From Multi-echo Acquisitions (ASPIRE). Magn. Reson. Med. 2018;79:2996–3006 doi: 10.1002/mrm.26963.
7. Robinson S, Schödl H, Trattnig S. A method for unwrapping highly wrapped multi-echo phase images at very high field: UMPIRE. Magn. Reson. Med. 2014;72:80–92 doi: 10.1002/mrm.24897.
8. Seeger U, Klose U, Mader I, Grodd W, Nägele T. Parameterized Evaluation of Macromolecules and Lipids in Proton MR Spectroscopy of Brain Diseases. Magn Reson Med 2003;49:19–28 doi: 10.1002/mrm.10332.
9. Starčuk Z, Starčuková J, Štrbák O, Graveron-Demilly D. Simulation of coupled-spin systems in the steady-state free-precession acquisition mode for fast magnetic resonance (MR) spectroscopic imaging. Meas. Sci. Technol. 2009;20:104033 doi: 10.1088/0957-0233/20/10/104033.
10. Provencher SW. Estimation of metabolite concentrations from localized in vivo proton NMR spectra. Magn. Reson. Med. 1993;30:672–9.
11. Otazo R, Mueller B, Ugurbil K, Wald L, Posse S. Signal-to-noise ratio and spectral linewidth improvements between 1.5 and 7 Tesla in proton echo-planar spectroscopic imaging. Magn. Reson. Med. 2006;56:1200–1210 doi: 10.1002/mrm.21067.
12. Desikan RS, Ségonne F, Fischl B, et al. An automated labeling system for subdividing the human cerebral cortex on MRI scans into gyral based regions of interest. 2006 doi: 10.1016/j.neuroimage.2006.01.021.
Figures