2484
MR-SASSI-Accelerated, B1-Insensitive, Magnetic Resonance Spectroscopic Imaging at 7T: first in vivo results1Translational and Molecular Imaging Institute, Icahn School of Medicine at Mount Sinai, New York, NY, United States
Synopsis
Magnetic Resonance Spectroscopic Imaging (MRSI) is a signal-starved technique compared to conventional magnetic resonance imaging. At ultra-high fields, such as 7 Tesla the increased signal to noise permits the acquisition of improved spectra. Spatial localization performed the volume of interest is can be time consuming. We created a multi-region excitation pulse embedded within a B1-insensitive MRSI sequence and demonstrated its use in vivo to excite two distinct spectroscopic grids which are simultaneously acquired and disentangle using a low-resolution reference scan, thus accelerating the acquisition of MRSI data.
Introduction
Magnetic Resonance Spectroscopic Imaging (MRSI) is a signal-starved technique, compared to conventional magnetic resonance imaging. At ultra-high fields, such as 7 Tesla (7T) the increased signal to noise (SNR) permits improved signal acquisition. MRSI is commonly performed with a sequences that employs a 90° excitation RF pulse followed by at least two 180° refocusing RF pulses to localize a volume of interest (VOI) [1-3]. Further spatial localization is performed within this VOI through the use of phase encodes or oscillating readouts [4]. The 180° refocusing pulses are particularly sensitive to B1-inhomogeniety, especially at 7T and the acquisition of spectral grids can be time consuming. Techniques have been developed to accelerate MRSI acquisitions [5,6]. However, these techniques remain challenged by the limitations of MRSI at 7T.
The semi-adiabatic spectral spatial spectroscopic imaging (SASSI) sequence [7] uses a spectral-spatial (SPSP) excitation pulse and two adiabatic SPSP refocusing pulses to overcome B1 inhomogeneity, chemical shift artifacts, and power limitations (as specific absorption rate - SAR) to excite a volume of interest (VOI) for 7T MRSI. In this work, we create a multi-region SASSI (MRSASSI) excitation pulse and demonstrate its use in vivo to excite two distinct spectroscopic grids which are simultaneously acquired and disentangle using a low-resolution water reference scan.
Methods
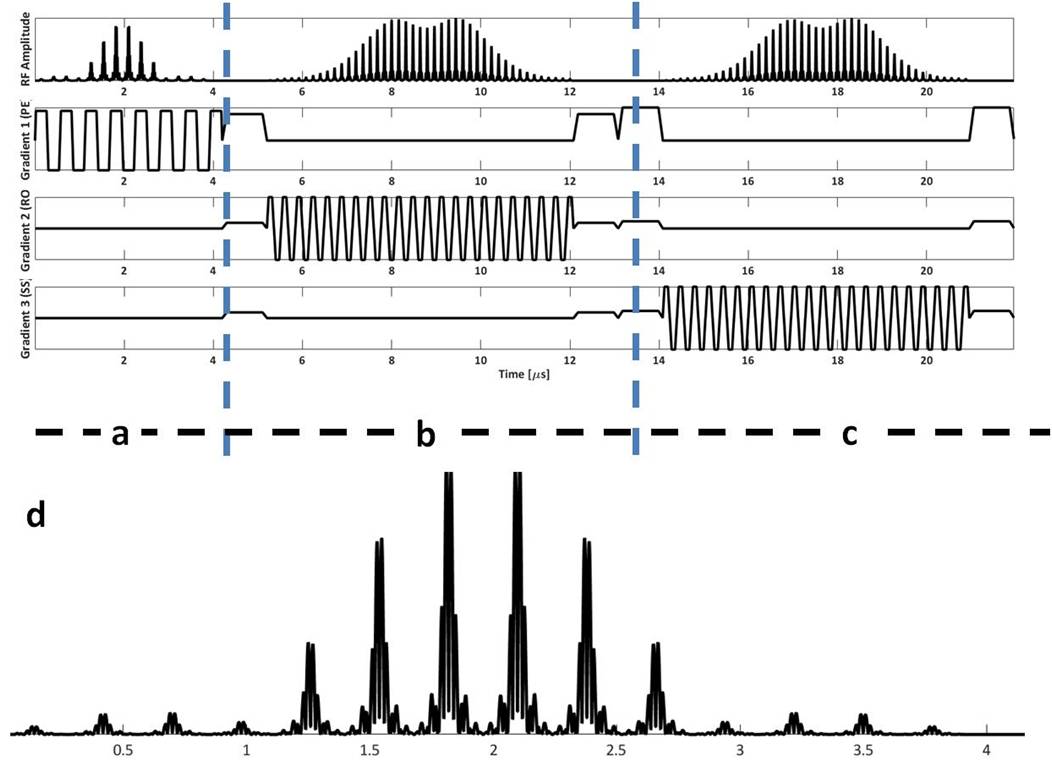
We used the adiabatic SLR algorithm [8] to create a SASSI refocusing pulse and designed a non-adiabatic SPSP excitation pulse of matching bandwidth (BW). The excitation pulse had BW= 1.20 kHz and t=4.2 ms. The refocusing pulse had BW=1.12 kHz and a t=7 ms. Figure 1 shows pulse sequence for the MR-SASSI pulse sequence. A multi-band excitation pulse was created by designing individual pulses for each spatial location and combining them with phased complex addition.
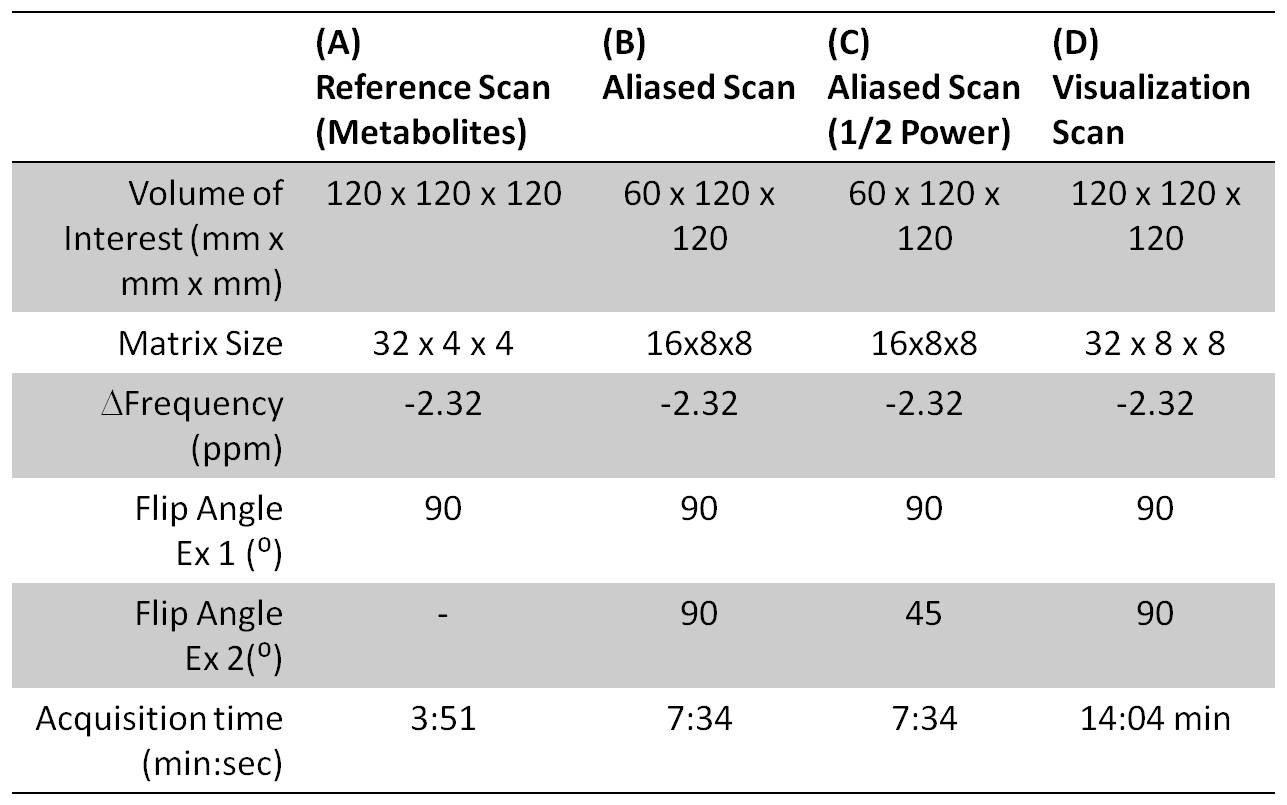
Scans were performed on human volunteer using a 7T whole body magnet (Siemens) and a 32-channel receive head coil. A low resolution reference scan, and an aliased, MR-SASSI metabolite acquisition were acquired in the right and left parietal lobe. Data was acquired using elliptical k-space encoding. To demonstrate the independence of the aliased regions, an additional MR-SASSI acquisition was acquired with the right lobe excited with ½ the power of the left lobe. Finally, to visualize the excitation regions, a high resolution scan covering the full VOI was acquired. Table 1 lists the parameters of each scan.
Individual coil weightings were calculated using the low-resolution reference scan and used to separate the simultaneously acquired regions. Metabolite fitting and integration under peaks was performed using LCMODEL (Version 6.3-1J ) to obtain concentrations of N-acetyl aspartate (NAA), Choline (Cho), and Creatine (Cr).
Results/Discussion
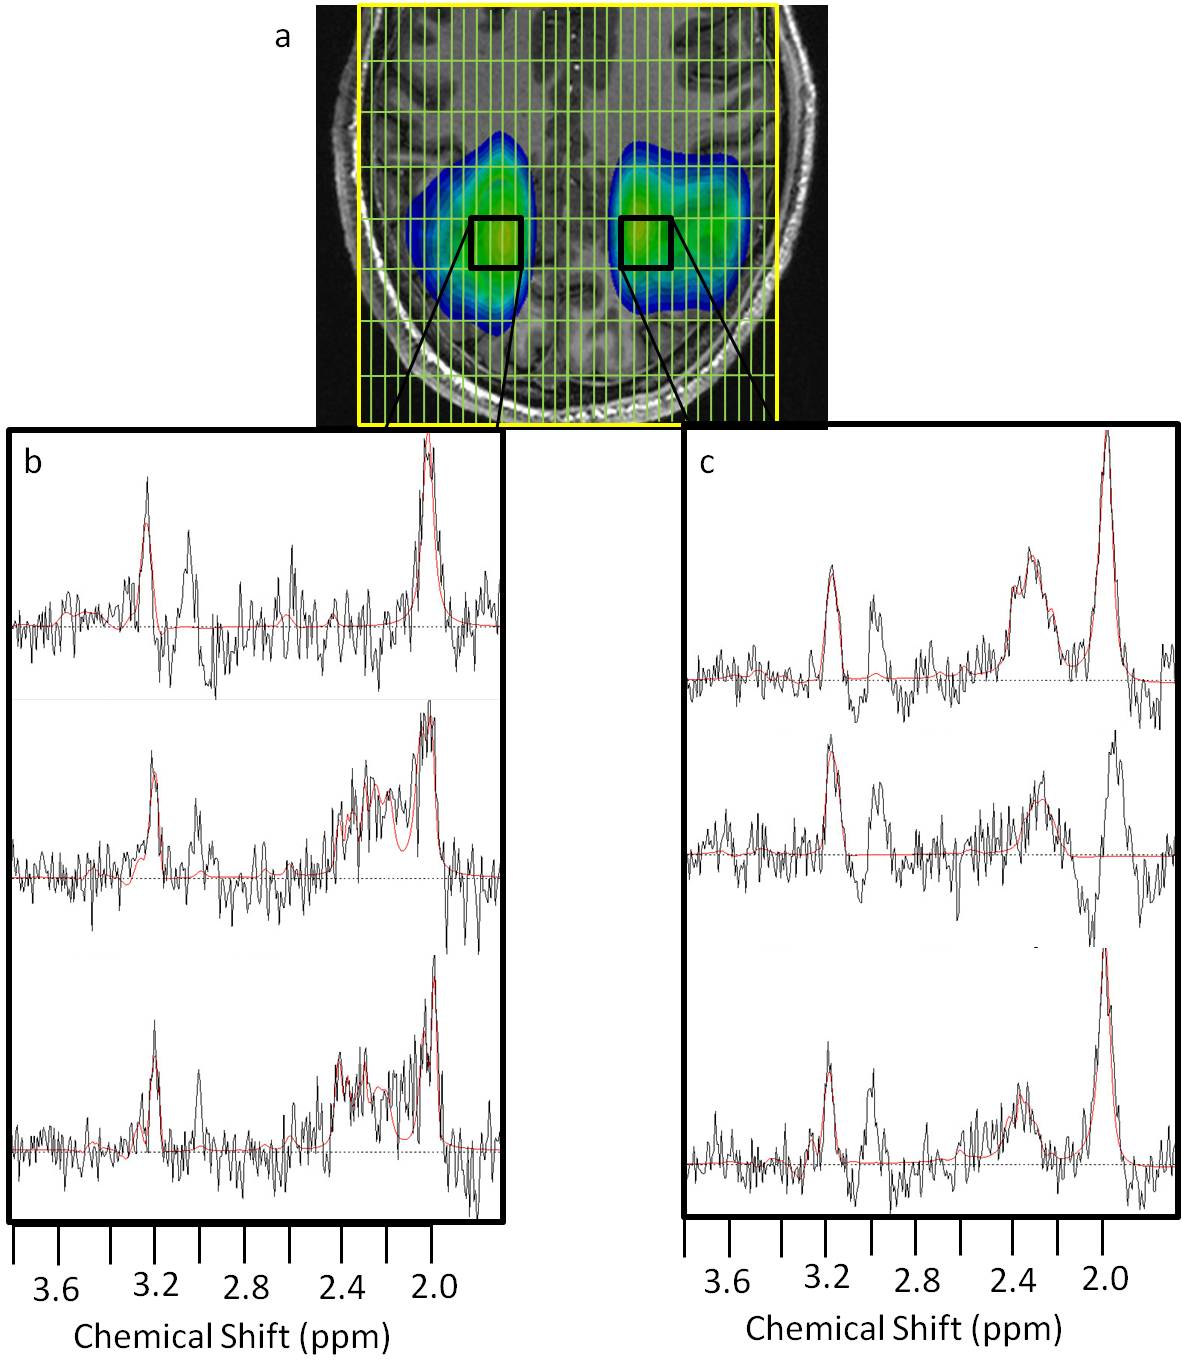
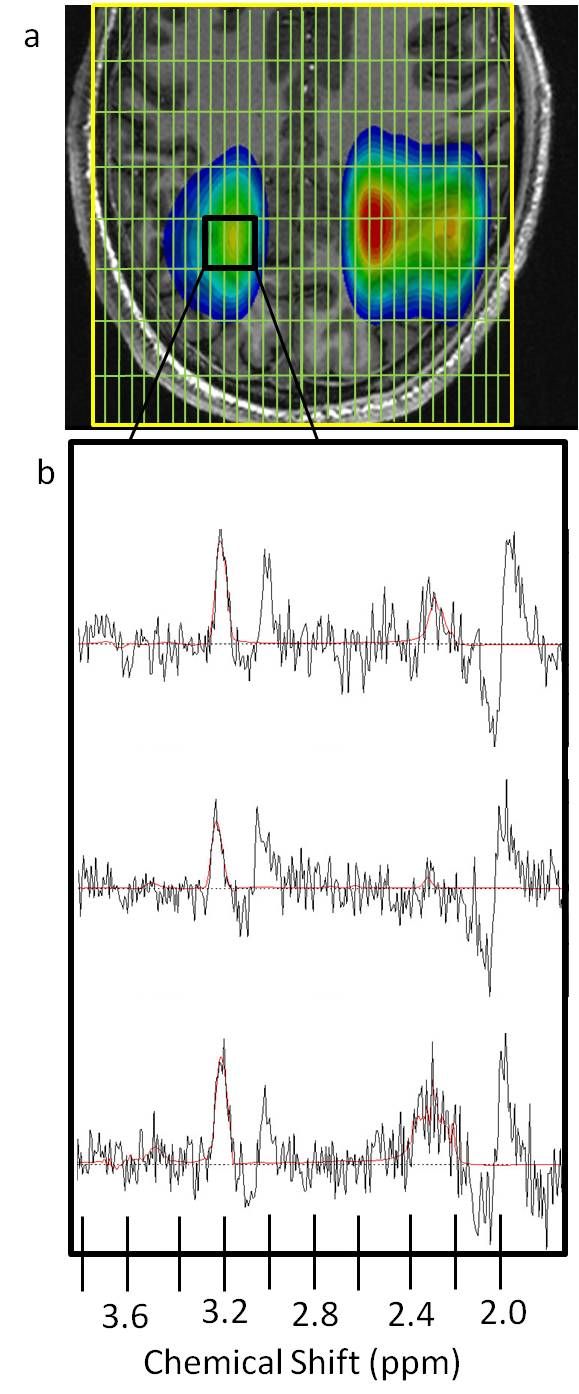
Figure 2 compares the metabolite spectra obtained from across 3 slices on the voxels indicated in the right (SNR ~ 3, FWHM = 0.092 ± 0.013 ppm) and left VOI’s (SNR ~ 3.6, FWHM = 0.13 ± 0.01 ppm). The difference in SNR and FWHM is due to the local B0 in homogeneity in each region. Figure 3 compares spectra obtained simultaneously from the right VOI’s, where the power used to excite the right VOI was ½ the power required for a 90° excitation (SNR ~ 1.67, FWHM = 0.11 ± 0.01 ppm). The spatial selectivity of the excitation pulse can be seen in Figure 3 to be affected by the reduced power, and we were able to disentangle the region with intentionally distinct SNR. The low SNR acquired in these regions is due to the low voxel volume (0.84 cm3) and single acquisition average. The larger voxels of the reference scan (3.37 cm3) provided sufficient signal to calculate the coil weights required for de-aliasing.
Because it relies on two adiabatic refocusing pulses for spatial localization, rather than pairs of pulses [9], SASSI is significantly less SAR intensive than other B1 insensitive MRSI sequences. The excitation pulse in MR-SASSI is significantly more SAR intensive than the excitation pulse for SASSI. However, it is less SAR intensive than the adiabatic pulses used in the sequence. In this first in vivo result we used a short repetition time (TR = 640 ms) for both the reference scan and the high-resolution aliased acquisition. This short TR is made possible by the low SAR sequence, as TR’s of over 2 s may be required for other adiabatic MRSI sequences. Future work will acquire the data with larger voxel volumes and additional averages.
Conclusion
We have created a SPSP excitation pulse capable of exciting two regions simultaneously and implemented it the SASSI sequence. We have demonstrated, for the first time in vivo, the acquisition and reconstruction of a multi-region accelerated B1-insensitive, low SAR magnetic resonance spectroscopic imaging.Acknowledgements
NIH R01 MH109544
Icahn School of Medicine Capital Campaign
Translational and Molecular Imaging Institute
References
[1] Bottomley PA. Spatial localization in NMR spectroscopy in vivo. Ann N Y Acad Sci 1987; 508:333-348
[2] Moonen CT, von Kienlin M, van Zijl PC, Cohen J, Gillen J, Daly P, Wolf G. Comparison of single-shot localization methods (STEAM and PRESS) for in vivo proton NMR spectroscopy. NMR Biomed 1989; 2:201-208.
[3] Luyten PR, Marien AJ, den Hollander JA. Acquisition and quantization in proton spectroscopy. NMR Biomed 1991;4:64-69.
[4] Adalsteinsson E, Spielman DM. Spatially resolved two-dimensional rpectroscopy. Magn Reson Med 1999;41:8-12.
[5] Strasser B, Považan M, Hangel G, Hingerl L, Chmelik M, Gruber S, Trattnig S, Bogner W. (2 + 1)D-CAIPIRINHA accelerated MR spectroscopic imaging of the brain at 7T. Magn Reson Med. 2016 Aug 22. doi: 10.1002/mrm.26386.
[6] Chatnuntawech I, Gagoski B, Bilgic B, Cauley SF, Setsompop K, Adalsteinsson E. Accelerated 1 H MRSI using randomly undersampled spiral-based k-space trajectories. Magn Reson Med. 2014 Jul 30.
[7] Feldman RE, Balchandani P. A semiadiabatic spectral-spatial spectroscopic imaging (SASSI) sequence for improved high-field MR spectroscopic imaging. Magn Reson Med. 2016 Oct;76(4):1071-82. doi: 10.1002/mrm.26025.
[8] Balchandani P, Pauly J, Spielman D. Designing adiabatic radio frequency pulses using the Shinnar-Le Roux algorithm. Magn Reson Med. 2010 Sep;64(3):843-51. doi: 10.1002/mrm.22473.
Figures