2483
Fast spectral imaging at 7T using COKE (COherent K-t-space Epsi) with a spatially selective IR pulse (achieved by controlling pTX coil phases)Rita Schmidt1
1Neurobiology, Weizmann Institute of Science, Rehovot, Israel
Synopsis
In a recent study, we demonstrated the feasibility of the COKE (Coherent K-t-space EPSI) sequence at 3T MRI to halve acquisition time or double the spectral width (SW) compared to EPSI. In this study, we explored, on a phantom with mimicking brain properties, the benefits of COKE at 7T for fast spectroscopic imaging; using an SW of 2500Hz to better cover the metabolites' frequency range. We combined it with spatially selective inversion recovery (IR) using B1 phases optimization in 8-channels transmit coil to minimize the signal drop in the center and to optimize the IR in the lipid region.
Introduction
In a recent study1, we demonstrated the feasibility of the COKE (Coherent K-t-space EPSI) sequence2 at 3T MRI to halve acquisition time or double the spectral width (SW) compared to EPSI3-5. Such EPSI-based sequence offer fast spectral-spatial acquisition, which is beneficial for structural and functional research. The higher-SW capability is especially important at ultra-high fields (≥7T) in order to cover the full 1H spectrum of metabolites. The restricted-SW in EPSI6 - limited by the available gradient amplitude and slew-rate – is associated with the non-uniform zigzag sampling pattern. A common method to overcome the SW restriction is temporal interleaving, however, this prolongs the scan time. In COKE, “blipped” phase encoding (PE) gradients are added in between readout lines (see Fig.1) in order to produce coherent phases between the k-t space readout lines (for a given PE). Hence, the non-uniform zigzag is resolved and the resulting SW is defined by the gradients limitations. Another challenge of 1H MRSI is lipid signal contamination. Many methods have been developed to cope with this matter7-9, including inversion recovery (IR) for lipids, outer volume suppression, and dedicated spatially selective pulses. IR is commonly used, utilizing the short T1 of the lipids, but it further reduces the already low signal of the metabolites. Several works have shown the application of B1 shimming of multi-channel transmit coils for spatially-selective IR10,11, thus minimizing the signal drop in the region of interest. In this study, we explored the benefits of COKE for 1H metabolites imaging at 7T. An IR pulse was implemented to enable phases’ optimization in 8-channels transmit coil to minimize the signal drop in the center and to optimize the IR in the lipid region.Methods
Pulse sequences: The study included EPSI and COKE implementations on a 7T MRI scanner (Terra, Siemens, Erlangen ) – see Fig. 1 for detailed sequence schemes. The experiments were conducted with Nova 8Tx-32Rx head coil. The IR pulse is sinc-based pulse with separate control of the phase for each channel.The water suppression used in this study is based on an in-house 256 ms long optimized VAPOR-like model, consisting of six frequency selective pulses12. A further optimization of a water suppression, better tuned for 7T, is still required. B1 shimming optimization: A B1 mapping using Siemens’ tfl_b1map sequence was acquired. The transmit phase per channel was optimized using an unconstrained nonlinear minimization (“fminsearch” in Matlab). The optimization inputs included per-channel B1 amplitude and phase distribution, and two regions, one in which to minimize the flip-angle of the IR and one in which to maximize the IR. Phantom: A dedicated phantom was prepared to mimic brain imaging at 7T. The phantom was based on the fBIRN13 recipe to include relevant electrical conductivity and T1 parameters in the brain, as well as metabolite content for brain imaging. The metabolite content included 10mM L-Glutamic acid, 10mM Creatine 8mM myo-Inositol, 2mM GABA, 2mM Choline chloride, 5mM Choline chloride, and 5mM Sodium lactate 12.5mM NAA. To improve the similarity to brain 7T imaging, a head-shaped plastic mannequin was used as a container for the phantom. Since the above phantom does not contain lipids, spatially selective IR was also tested on oil phantom. The scan parameters are summarized in the relevant figure captions.Results
Fig. 2 shows (top) the head-shaped phantom used and (bottom) a comparison of EPSI and COKE (without IR) on a single slice. For the same scan time, and readout duration, COKE’s SW is double (2500Hz for COKE and 1250Hz for EPSI). Fig. 3 shows two cases of optimizing B1 phases for spatially selective IR, while Fig. 4 shows the effects of these IR pulses on an oil phantom. Fig. 5 shows the results of COKE with and without spatially selective IR. The optimized spatially selective IR had only small effect on the NAA intensity compared to significant drop using the non-selective IR.Conclusions
We have demonstrated, on a phantom with mimicking brain properties, the benefits of COKE at 7T for fast imaging; achieving an SW of 2500Hz to better cover the metabolites' frequency range. Scan duration was 2.13 minutes for in-plane resolution of 6x3 mm2 and 15 mm thickness. In addition, we have shown a spatially selective IR pulse, optimized for two regions: minimizing the IR flip-angle in one, while maximizing it in the other. Yet, in more general cases the IR pulse optimization using only B1 shimming can be limited, mostly due to the transmit channels' distribution. Next, we plan to examine the fast spectral imaging using COKE in human volunteer study.Acknowledgements
We are grateful to Siemens support, especially to Amir Seginer, Robin Heidemann and Rene Gumbrecht for assistance with B1 mapping and shimming capabilities. We are grateful to Assaf Tal for providing the MRSI source code from which COKE was developed.References
[1] Schmidt R. et.al. 2018, Proc. Intl. Soc. Mag. Reson. Med., 1059 [2] Webb P., et.al. (1989) Magn. Reson. Med., 12(3), 306-315 [3] Mansfield, P. (1984) Magn. Reson. Med., 1(3), 370-386, [4] Mulkern, R. V. Conc Magn Reson, 13(4), 213-237, [5] Posse, S., et.al (1994) Radiology, 192(3), 733-738, [6] Posse, et.al. (2013) J. Magn. Reson. Imag., 37(6), 1301-1325, [7] Balchandani, P., et.al. (2008). Magn Reson Med, 59(5), 980–988. [8] Boer, V. O., et.al. (2012). Magn Reson Med, 68(3), 662–670. [9] Van de Moortele, P.-F et. al. (2005). Magn Reson Med, 54(6), 1503–1518. [10] Emir, U. E.,et.al. (2012). NMR in Biomed, 25(1), 152–160, [11] Hetherington H.P., et.al., (2009) Magn Reson Med,63(1), 9-19.[12] Osnat Volovyk et.al. Magn Reson Med, 79(5),2481-2490. [13] https://www.nitrc.org/frs/download.php/275/fBIRN_phantom_qaProcedures.pdfFigures
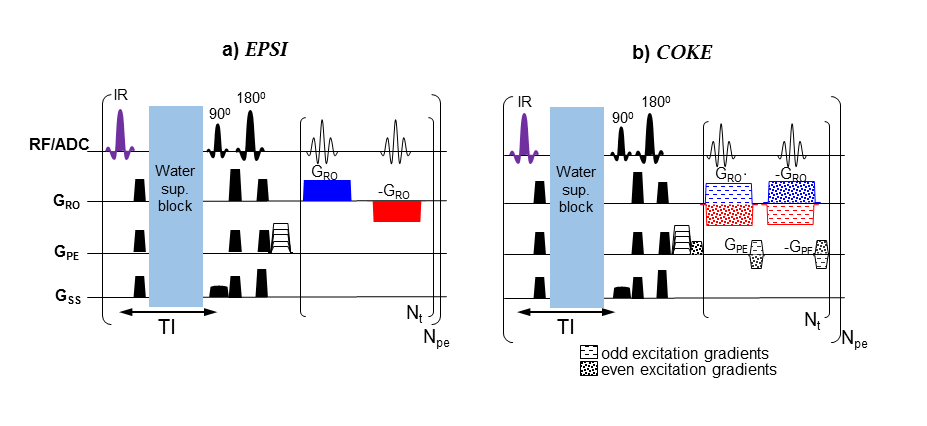
Figure 1: Slice-selective EPSI (a) and
COKE (b) pulse sequences. The odd/even excitations are marked differently as
shown in the legends. Blue/red color
denote positive/negative readouts.
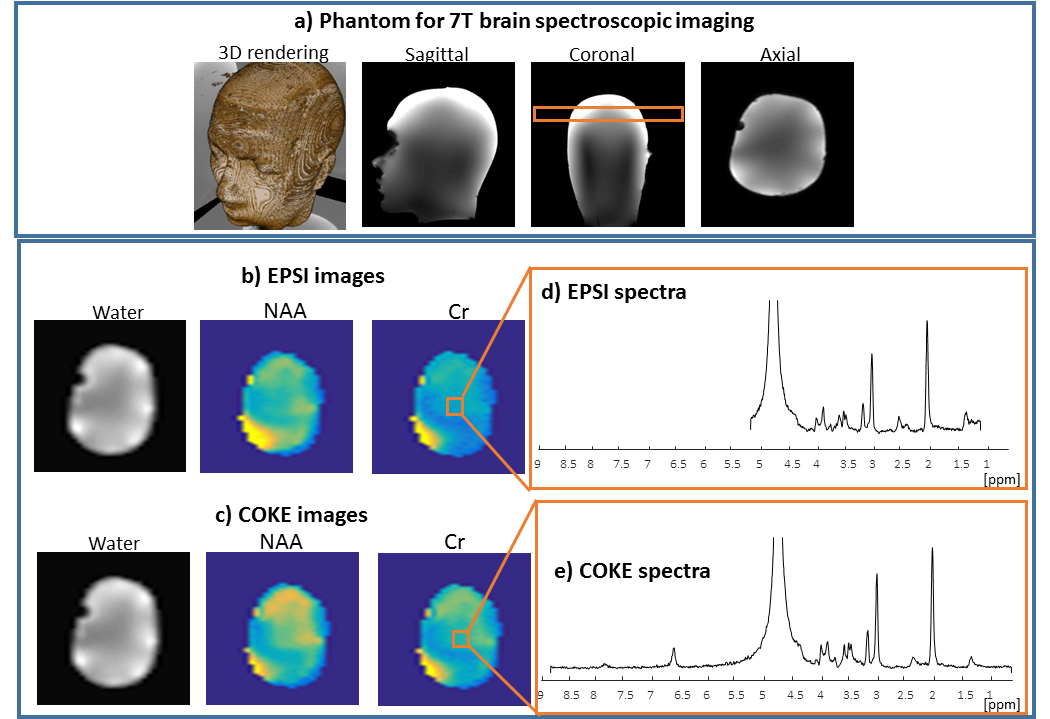
Figure
2: a) Images (using GRE scan) of the phantom designed to mimic brain
metabolites imaging at 7T (orange overlay shows the EPSI/COKE scan location),
b) and c) EPSI and COKE Water, NAA and Cr images, d) and e) central 5x5 voxels
spectra for EPSI and COKE, respectively (no IR). The EPSI and COKE scan parameters were TR/TE
2000/5 ms, FOV and thickness 200x200x15 mm3,
spatial resolution 32x64 points, frequency resolution 1.2 Hz, echo spacing 0.4
ms, SW =1250 Hz and 2500 Hz for EPSI and COKE, respectively, single average.
Scan duration 2.13 minutes.
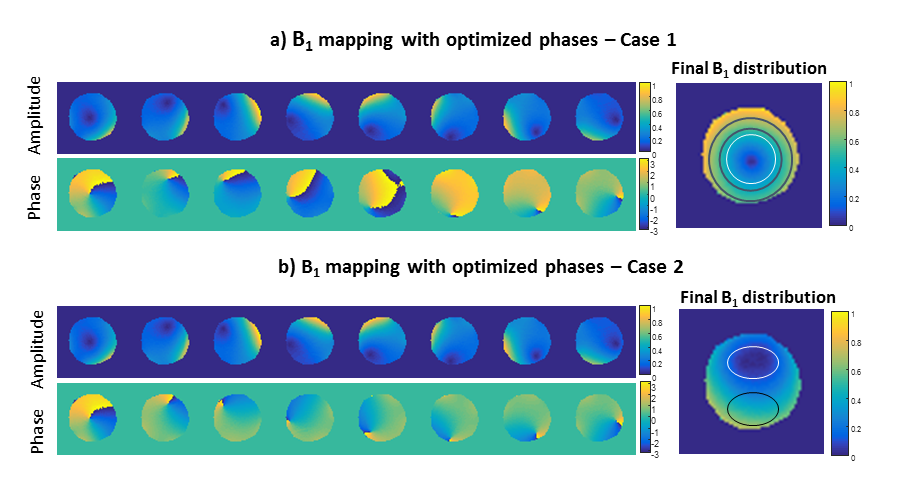
Figure 3: B1 maps
with optimized per-channel phases designed to minimize the flip-angles in the
white overlay and to maximize the flip-angles in the black overlay region, two
cases are shown.
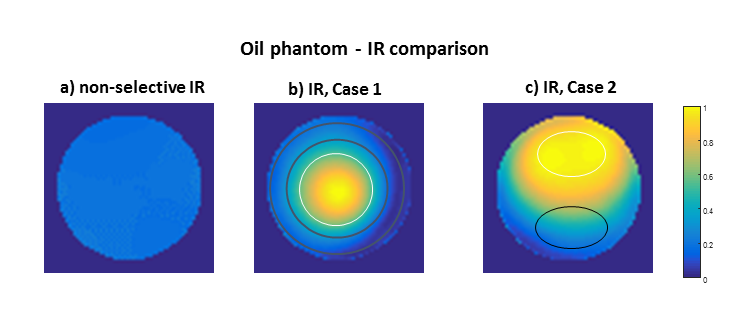
Figure
4: Oil phantom comparison of EPSI
acquisition - a) with non-selective IR, b) with IR using Case 1 in Fig.3 , c)
with IR using Case 2 in Fig.3. The EPSI and COKE scan parameters were TR/TE
2000/5 ms, FOV and thickness 200x200x5 mm3, spatial resolution 64x64
points, frequency resolution 8 Hz, echo spacing 0.5 ms, SW =1000 Hz, TI=300ms.
The white overlay show the minimized IR region and the black overlay the
maximized IR region.
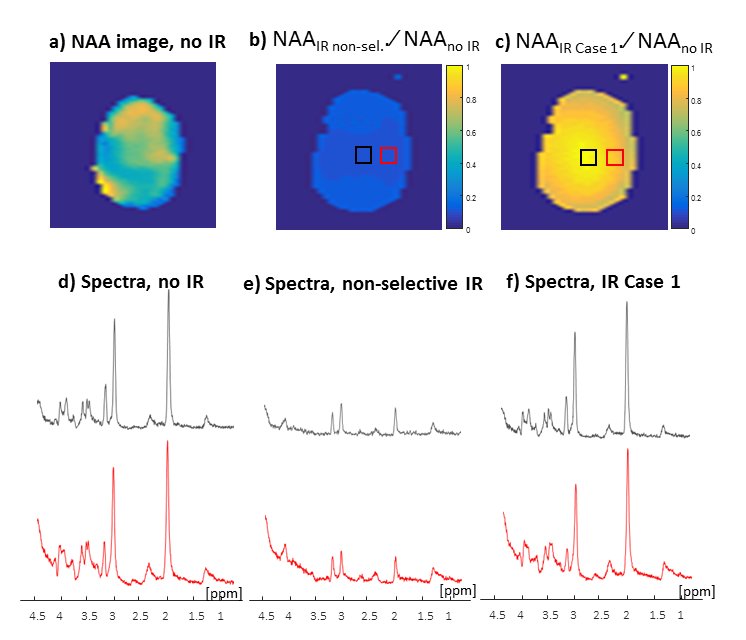
Figure 5: COKE spectral imaging with spatially selective IR. a)
NAA image without IR, b) Intensity ratio with non-selective IR versus no IR, c)
intensity ratio with spatially selective IR (Case 1) versus no IR. d-f) spectra
in two regions shown in black and red overlays comparing IR methods. The same scaling
was used for all spectra.