2481
In vivo echo-planar spectroscopic imaging (EPSI) at 7 tesla with readout segmentation for improved spectral bandwidth1Imaging Centre of Excellence, University of Glasgow, Glasgow, Scotland, 2Fraunhofer MEVIS, Bremen, Germany, 3Glasgow Clinical Research Imaging Facility, NHS Greater Glasgow and Clyde, Glasgow, Scotland
Synopsis
The use of echo-planar spectroscopic imaging at ultra-high field strengths is attractive due to its suitability for high spatial and spectral resolution (HiSS) acquisitions. The drawback of the method at 7T and above is the decreasing spectral bandwidth as field strength increases. This work seeks to decouple the spectral bandwidth from the spatial resolution by the use of readout segmentation to achieve shorter echo spacing. Readout segmented EPSI spectra collected in vivo at 7T and comparable to a standard SVS method are presented. This allowed the calculation of metabolite maps for NAA, creatine and choline.
Introduction
Echo-planar spectroscopic imaging (EPSI)1, 2 is an established method which lends itself to high spectral and spatial resolution (HiSS)3 acquisitions. EPSI uses fast alternating gradients to simultaneous encode spectral information and one spatial dimension, with phase encoding employed to encode further spatial dimensions. The advantages of EPSI at 7T have previously been shown in the form of higher SNR and decreased spectral linewidth4. However, the use of EPSI at higher field strengths is limited by constraints on the achievable spectral bandwidth, due to the required spacing between echoes. This is a particular issue at 7T and beyond as the spectral resonances separate as B0 increases, such that a shorter echo spacing is required to achieve the same spectral bandwidth in ppm. Such short echo spacing, in particular for HiSS applications, is not possible to achieve due to limited available gradient strength. This preliminary study uses a readout-segmented version of EPSI5 to decouple the achievable echo spacing from the spatial resolution, allowing for greater spectral bandwidth in Hz at higher field strengths such as 7T.Methods
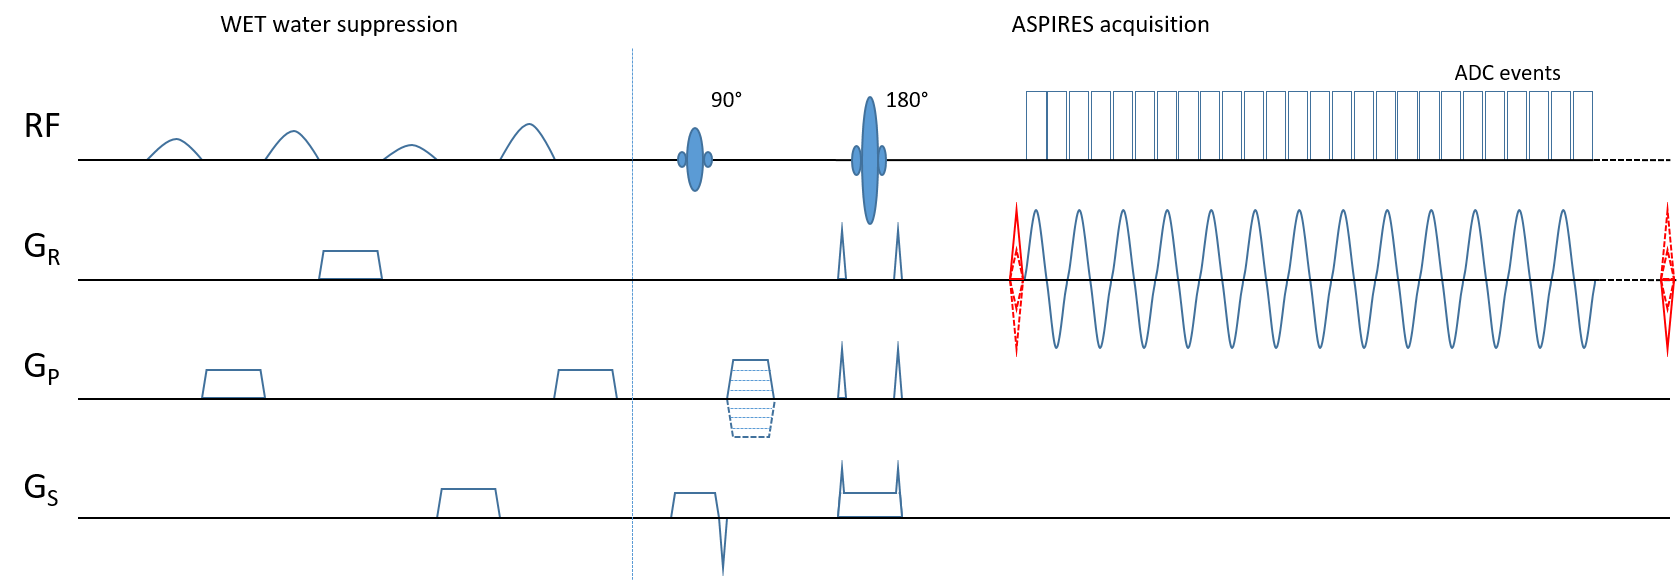
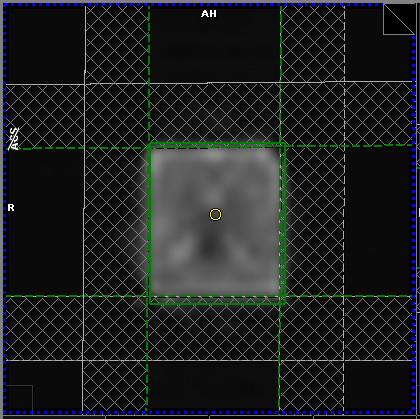
The readout-segmented EPSI sequence diagram is shown in Figure 1. The sequence consists of a four pulse WET6 water suppression module, followed by spin-echo preparation with phase encoding and spoiling gradients either side of the 180° pulse. The data is acquired during a sinusoidal readout gradient which samples a single line of k-space over multiple echoes. Prior to the sinusoidal gradient, a stepped gradient is applied in the readout direction to select a discrete segment of k-space in kx. This stepped gradient is rewound at the end of the echo train. Data were acquired on a healthy volunteer using a MAGNETOM Terra 7T scanner (Siemens Healthcare, Erlangen) with a single-transmit, 32-channel receive head coil (Nova medical, Wilmington, MA). The sequence parameters were TR/TE = 2000/30ms, FoV = 480mm and matrix 48x48 giving a voxel size of 1cm3, 3 readout segments were employed with 512 echoes allowing an echo spacing of 340μs, corresponding to a spectral bandwidth of 2.9kHz. To prevent lipid contamination, outer volume suppression was employed using four asymmetric saturation bands7 positioned as shown in Figure 2. The total acquisition time was 4mins 52s and since 3 readout segments were used with a 48x48 matrix, the total number of phase encoding steps performed in the measurement was 144 (here equivalent to averages in MRS8). Results were compared to a spin-echo single-voxel spectroscopy sequence with 144 averages, total acquisition time 4mins 56s and TR/TE and voxel size as above. An EPSI dataset was also acquired without water suppression using a 32x32 matrix FoV = 320mm and no readout segmentation and took 1min 4s with all other parameters unchanged. EPSI modulus spectra were produced offline in MATLAB (The Mathworks Inc., Natick, MA) by voxel-wise Fourier transformation of floating-point image data in the echo dimension. Spectra were zero-order phase corrected according to the non-water-suppressed spectrum but underwent no further post-processing. Simple metabolite maps were produced by numerical integration over the metabolite peak.Results
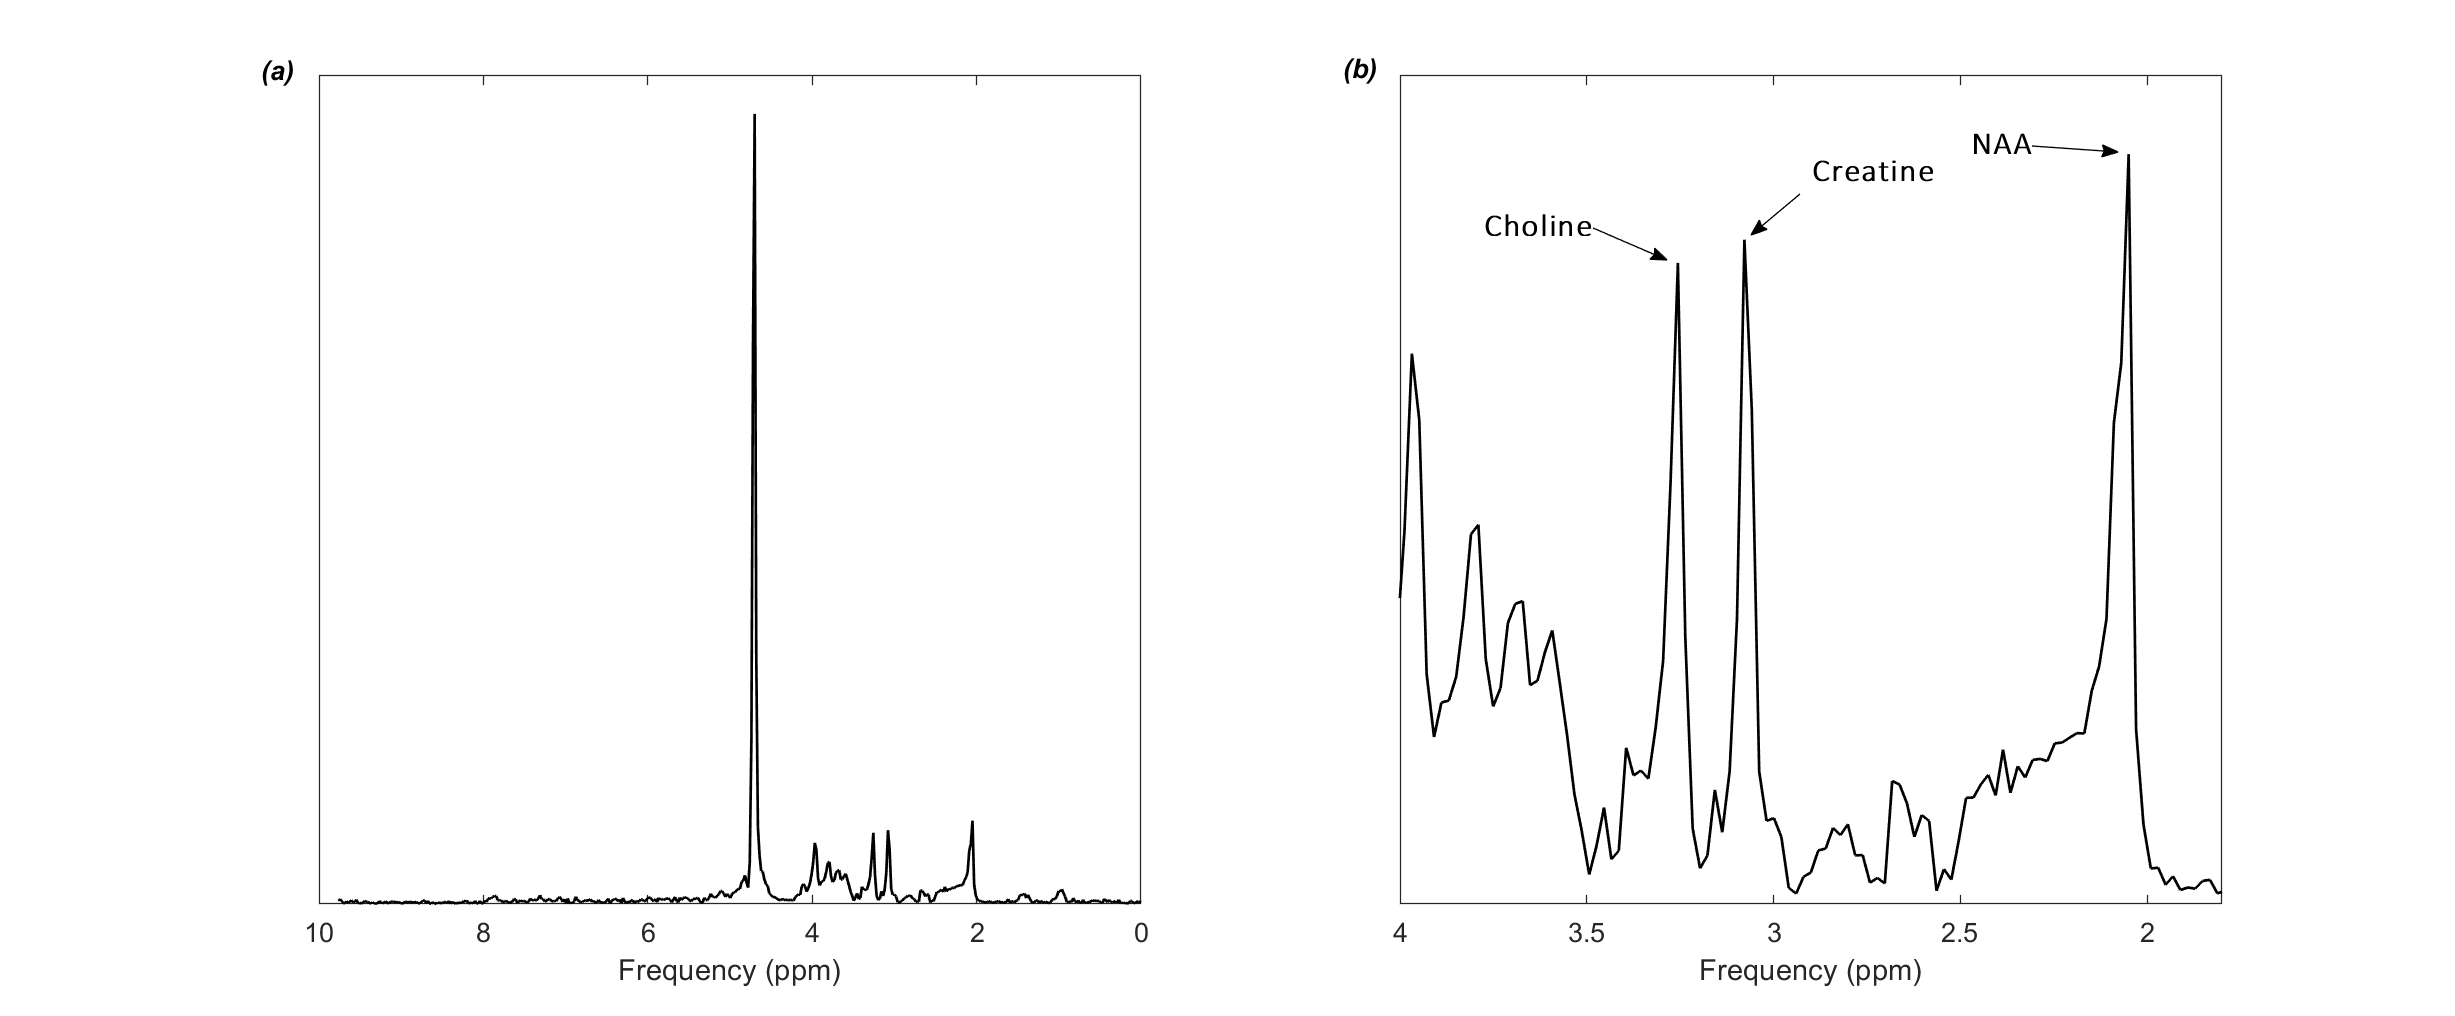
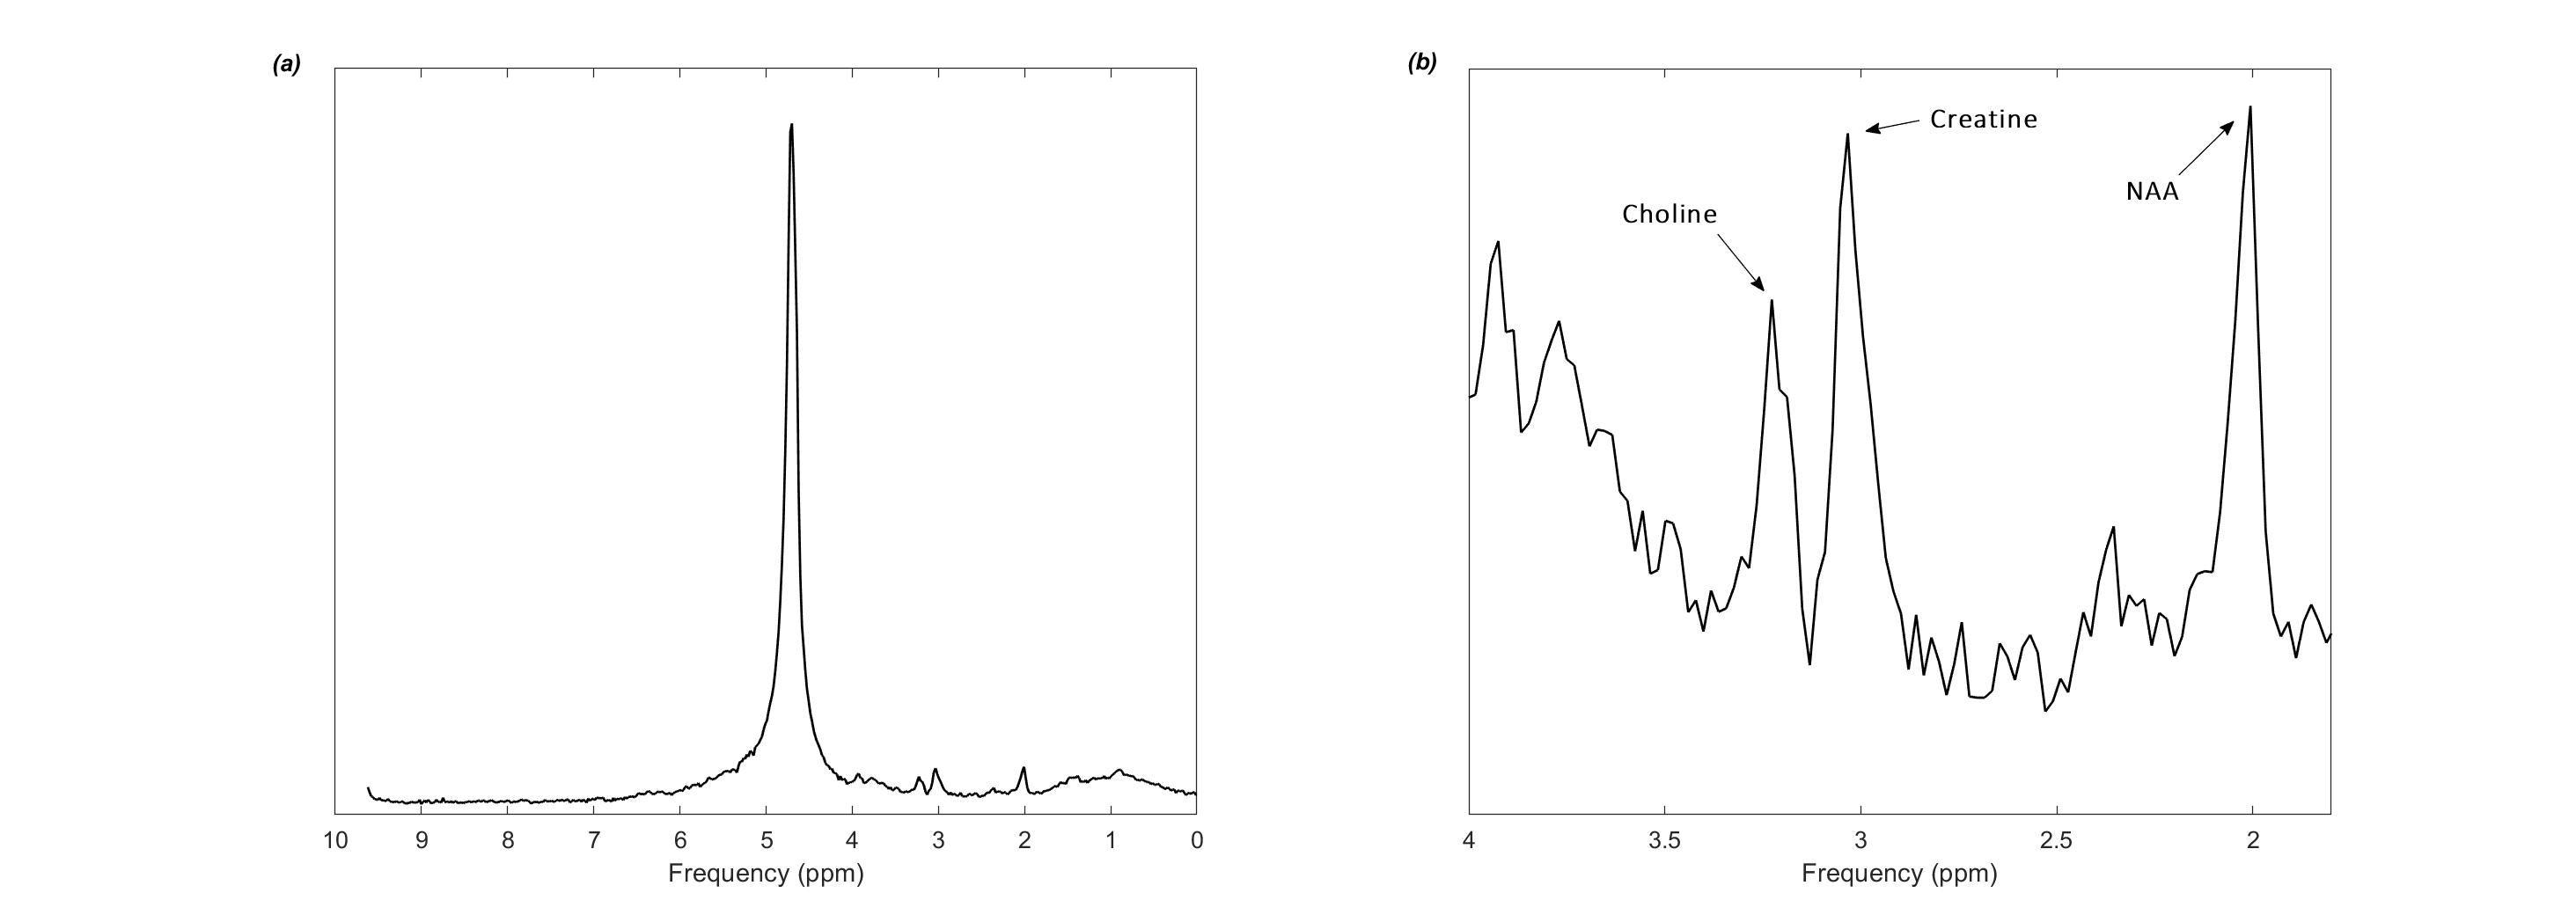
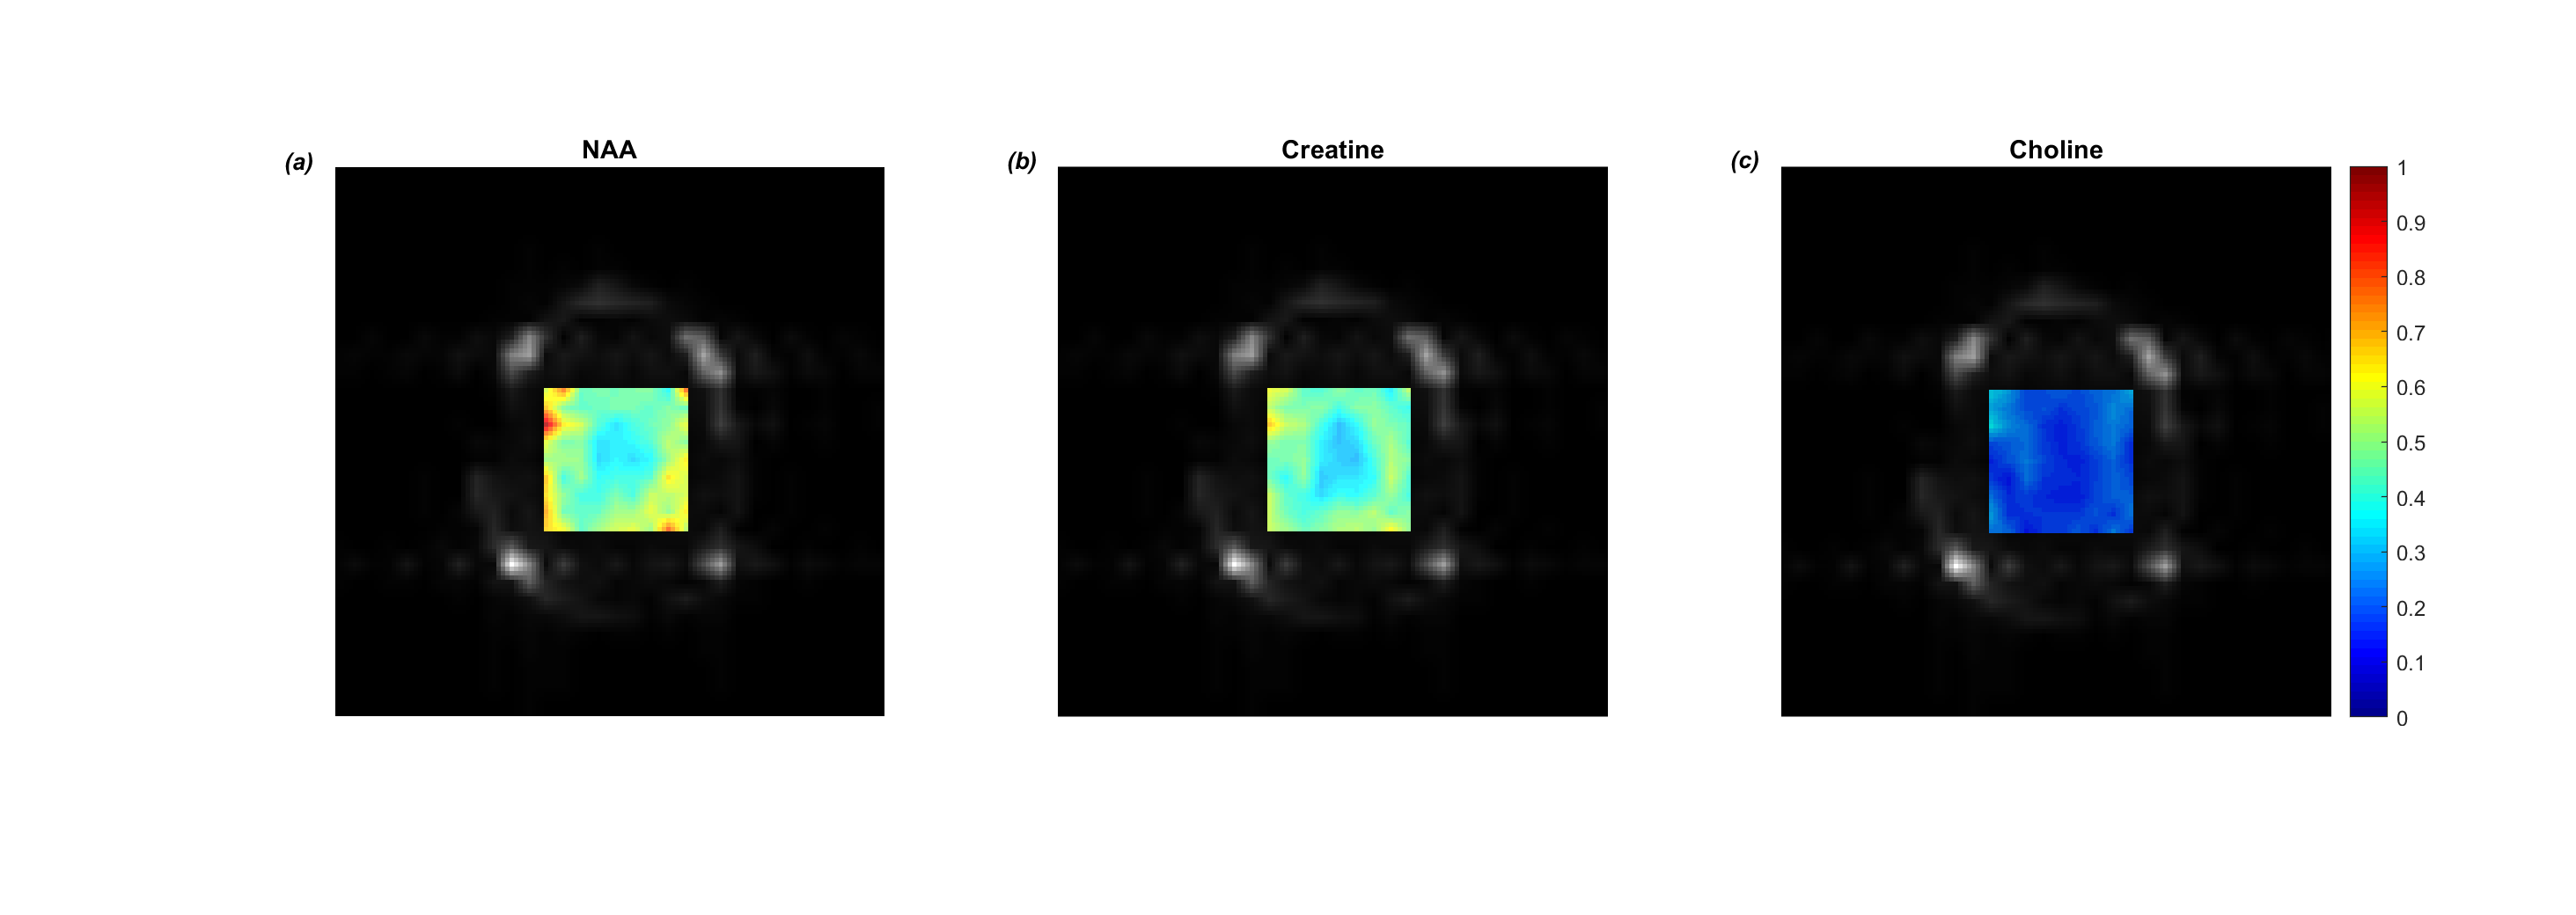
Full bandwidth modulus spectra acquired using the SVS method are shown in Figure 3(a) and those acquired with the readout-segmented EPSI method are shown in Figure 4(a). Figures 3(b) and 4(b) show magnified spectra in the range 1.8-4.0ppm for SVS and EPSI respectively. Figure 5 shows metabolite maps calculated for N-acetyl aspartate (NAA), creatine and choline.Discussion
This preliminary study has shown that readout-segmented EPSI is feasible at 7T, giving comparable spectra to a standard SVS sequence under matched acquisition conditions. The use of readout segmentation allows a shorter echo spacing to be applied which leads to greater spectral bandwidth. This will be especially important when moving to higher resolutions, the potential for which is one of the most attractive features of EPSI at 7T. The use of readout segmentation, particularly in a high resolution acquisition will of course lead to long scan times. However, as demonstrated in previous work at 3T9, the sequence is well suited to scan acceleration using compressed sensing because it offers good opportunity for sparsification in both the spatial and spectral dimensions, and allows a high degree of randomness in k-space sampling. The combination of compressed sensing and readout-segmented EPSI will be explored in future work at 7 tesla. This promises to allow high spatial and spectral resolution EPSI datasets with a large spectral bandwidth to be acquired with acquisition times that are suitable for human studies in vivo.Conclusion
This study has shown that echo-planar-based metabolite mapping at ultra-high field can be performed without spectral-bandwidth constraints by using EPSI with readout segmentation.Acknowledgements
No acknowledgement found.References
1. Mansfield, P., Spatial mapping of the chemical shift in NMR. Magn Reson Med, 1984. 1(3): p. 370-86.
2. Posse, S., C. DeCarli, and D. Le Bihan, Three-dimensional echo-planar MR spectroscopic imaging at short echo times in the human brain. Radiology, 1994. 192(3): p. 733-8.
3. Du, W.L., et al., Breast MR imaging with high spectral and spatial resolutions: Preliminary experience. Radiology, 2002. 224(2): p. 577-585.
4. Otazo, R., et al., Signal-to-noise ratio and spectral linewidth improvements between 1.5 and 7 Tesla in proton echo-planar spectroscopic imaging. Magn Reson Med, 2006. 56(6): p. 1200-10.
5. Porter, D.A. and M. Vicari. Readout segmentation for increased spectral bandwidth in high spatial and spectral resolution (HiSS) MRI. in ISMRM. 2016. Singapore.
6. Ogg, R.J., P.B. Kingsley, and J.S. Taylor, WET, a T1- and B1-insensitive water-suppression method for in vivo localized 1H NMR spectroscopy. J Magn Reson B, 1994. 104(1): p. 1-10.
7. Hwang, T.L., P.C. van Zijl, and M. Garwood, Asymmetric adiabatic pulses for NH selection. J Magn Reson, 1999. 138(1): p. 173-7.
8. Golay, X., et al., Scan time reduction in proton magnetic resonance spectroscopic imaging of the human brain. Magn Reson Med, 2002. 47(2): p. 384-7.
9. Vicari, M. and D.A. Porter. Accelerated magnetic resonance spectroscopic imaging using readout segmentation. in ISMRM. 2017. Hawaii.
Figures