2478
Accelerating High-Resolution Semi-LASER 1H-MRSI Using SPICE1Beckman Institute for Advanced Science and Technology, University of Illinois at Urbana-Champaign, Urbana, IL, United States, 2Department of Electrical and Computer Engineering, University of Illinois at Urbana-Champaign, Urbana, IL, United States, 3Department of Biomedical Engineering, Case Western Reserve University, Cleveland, OH, United States
Synopsis
Most of the current 1H-MRSI techniques have several major practical limitations, including long data acquisition time, low spatial resolution and poor SNR. To overcome these limitations, we accelerate the semi-LASER technique by incorporating subspace modeling. With this improvement, semi-LASER is cable of achieving 1.9×1.6 mm2 resolution in a 1.5 minutes scan, which is a significant improvement over the conventional semi-LASER. This imaging capability has been validated with in vivo experiments, and it may significantly enhance the practical utility of 1H-MRSI.
Introduction
1H-MRSI has long been recognized as a powerful tool for noninvasive metabolic imaging, but its applications are still quite limited due to several barriers, including long acquisition time, low resolution and poor SNR. To overcome these limitations, a novel data acquisition and processing method known as SPICE (SPectroscopic Imaging by exploiting spatiospectral CorrElation) has been recently proposed1-3. SPICE exploits a unique property of spectroscopic signals known as partial separability (PS)4. This property reveals that high-dimensional spectroscopic signals reside in very low-dimensional subspaces and enables special data acquisition and image reconstruction strategies to be used to achieve rapid high-resolution MRSI. In this work, we integrate SPICE with semi-LASER (double spin echo sequence for Localized Adiabatic SElective Refocusing)5 to accelerate 1H-MRSI. With this improvement, semi-LASER is cable of achieving $$$1.9\times1.6~\mathrm{mm^2}$$$ resolution in $$$1.5~\mathrm{minutes}$$$, which is a significant improvement over the conventional semi-LASER MRSI. This imaging capability has been validated with in vivo experiments, and is expected to enhance the practical utility of 1H-MRSI.Theory and Method
Data acquisition
The proposed acquisition scheme is illustrated in Fig. 1, which contains two key features: a) semi-LASER excitation, and b) large k-space coverage using extended EPSI trajectories6,7 and sparse sampling. Semi-LASER pulses are utilized to localize a restricted volume of interest, which helps to avoid signal contamination from subcutaneous lipid. The ADC is turned on for a short period $$$(10~\mathrm{ms})$$$ during excitation to collect navigator signals for detection and correction of field drifts. Bipolar EPSI readouts are utilized to simultaneously encode spatial and spectral information. As shown in Fig. 2c, we use a much longer EPSI readout than conventional EPSI methods to achieve extended k-space coverage needed for high resolution. This sampling scheme will result in a violation of the temporal Nyquist sampling criterion, which is permissible by SPICE due to the use of the subspace model for reconstruction of the spatiospectral function. In addition, by taking advantage of parallel imaging, we sparsely sample outer k-space in the phase-encoding direction to further extend k-space coverage (Fig. 2b). These data acquisition strategies together enable the acquisition of a single-slice MRSI data set with $$$1.9\times1.6~\mathrm{mm^2}$$$ nominal resolution in only $$$1.5~\mathrm{minutes}$$$.
Data processing
Our data acquisition scheme requires special methods for data processing, including: a) detection and correction of field drifts, b) removal of the residual water signal, c) reconstruction of the spatiospectral function.
First, resonance frequency drifts are corrected using field drift navigators8, and eddy current effects are corrected using two navigators with opposite polarities, acquired at the end of the scan. Then, the spatially under-sampled k-space data is interpolated using a hybrid GRAPPA/SENSE method9.
Second, the residual water signals are effectively removed using the union-of-subspaces model10, where metabolite and water signals are assumed to reside in different low-dimensional subspaces.
Finally, the spatiospectral distribution of the desired molecules (metabolites and neurotransmitters) is reconstructed using the SPICE reconstruction method that incorporates both pre-learned spectral bases and spatial priors. Specifically, we express the desired spatiospectral function as $$\rho(x,f)=\sum_{l=1}^{L}c_l(x)\varphi_l(f),$$ where $$$\{\varphi_l(f)\}_{l=1}^{L}$$$ are pre-learned spectral basis functions, and $$$\{c_l(x)\}_{l=1}^{L}$$$ are unknown spatial coefficients. The spatial coefficients are determined by solving the following regularized least-squares problem: $$\hat{C}=\arg\min_{C}\left\|d-\Omega\mathcal{F}B_0\left(C\Phi\right)\right\|_2^2+\lambda\left\|WD\left(C\Phi\right)\right\|_2^2,$$ where $$$C$$$ and $$$\Phi$$$ are matrix representations of the spatial coefficients and the spectral bases, respectively; $$$d$$$ is the nuisance-removed (k,t)-space data; $$$B_0,~\mathcal{F}$$$, and $$$\Omega$$$ represent field inhomogeneity, Fourier encoding and sampling operators, respectively; $$$\lambda$$$ is a regularization parameter; $$$D$$$ is the finite difference operator and $$$W$$$ is a weighting matrix for edge-preserving regularization. Once the spatial coefficients are determined, $$$\rho=\hat C\Phi$$$ will give the desired metabolite distributions.
Results and Discussion
In vivo data were acquired from healthy volunteers (with IRB approval) on a $$$3~\mathrm{T}$$$ Siemens Prisma scanner. A single-slice semi-LASER 1H-MRSI sequence with weak water suppression was implemented with $$$\mathrm{FOV}=180\times180~\mathrm{mm^2}$$$, $$$\mathrm{slice~thickness}=10~\mathrm{mm}$$$, and $$$\mathrm{VOI}=90\times90\times10~\mathrm{mm^3}$$$. Parallel imaging based sparse sampling $$$(R=1.45)$$$ was designed to cover extended k-space so as to achieve an in-plane resolution of $$$1.9\times1.6~\mathrm{mm^2}$$$ ($$$\mathrm{matrix~size}=96\times110$$$). Other parameters were: $$$\mathrm{TE}/\mathrm{TR}=40/1250~\mathrm{ms}$$$, $$$\mathrm{echospace}=1.76~\mathrm{ms}$$$, $$$\mathrm{total~acquisition~time}~=1.5~\mathrm{minutes}$$$.
Some representative results are shown in Figs. 3 and 4. In Fig. 3 we show the reconstructed high-resolution metabolite maps, overlaid on a $$$T_1$$$-weighted structural image. In Fig. 4 we show localized spectra within the selected region. As can be seen, the new improved semi-LASER method produced high-resolution metabolite maps and high-quality localized spectra with significantly reduced data acquisition time. We expect this capability to enhance the practical utility of 1H-MRSI.
Conclusion
We have successfully integrated SPICE into semi-LASER to significantly enhance its spatial resolution while reducing its data acquisition time. Experimental results show that high-quality 2D 1H-MRSI data from the brain with $$$1.9\times1.6~\mathrm{mm^2}$$$ nominal resolution can be obtained in $$$1.5~\mathrm{minutes}$$$. We expect that this capability will enhance the practical utility of 1H-MRSI in various clinical and research applications.Acknowledgements
This work is supported in part by NIH-R21-EB021013, NIH-R21 EB023413, NIH-R01-EB023704, NIH-P41-EB022544, and the UIUC Yang Fellowship.References
1. Lam F, Liang ZP. A subspace approach to high-resolution spectroscopic imaging. Magn Reson Med. 2014;71(4):1349‐1357.
2. Ma C, Lam F, Ning Q, et al. High-resolution 1H-MRSI of the brain using short-TE SPICE. Magn Reson Med. 2017;77(2):467‐479.
3. Peng X, Lan F, Li Y, et al. Simultaneous QSM and metabolic imaging of the brain using SPICE. Magn Reson Med. 2018;79(1):13‐21.
4. Liang ZP. Spatiotemporal imaging with partially separable functions. Proc IEEE Int Symp Biomed Imaging, Washington DC, USA, 2007. pp. 988‐991.
5. Scheenen TW, Klomp DW, Wijnen JP, et al. Short echo time 1H-MRSI of the human brain at 3T with minimal chemical shift displacement errors using adiabatic refocusing pulses. Magn Reson Med. 2008;59(1):1‐6.
6. Posse S, Tedeschi G, Risinger R, et al. High speed 1H spectroscopic imaging in human brain by echo planar spatial‐spectral encoding. Magn Reson Med. 1995;33(1):34‐40.
7. Coello E, Noeske R, Burns BL, et al. High resolution echo-planar spectroscopic imaging at ultra-high field. NMR Biomed. 2018;31(11):e3950.
8. Ebel A, Maudsley AA. Detection and correction of frequency instabilities for volumetric 1H echo-planar spectroscopic imaging. Magn Reson Med. 2005;53(2):465‐469.
9. Peng X, Lam F, Clifford B et al. Simultaneous QSM and metabolic imaging of the brain using SPICE. Magn Reson Med. 2018;79(1):13‐21.
10. Ma C, Lam F, Johnson CL, et al. Removal of nuisance signals from limited and sparse 1H MRSI data using a union-of-subspaces model. Magn Reson Med. 2016;75(2):488‐497.
Figures
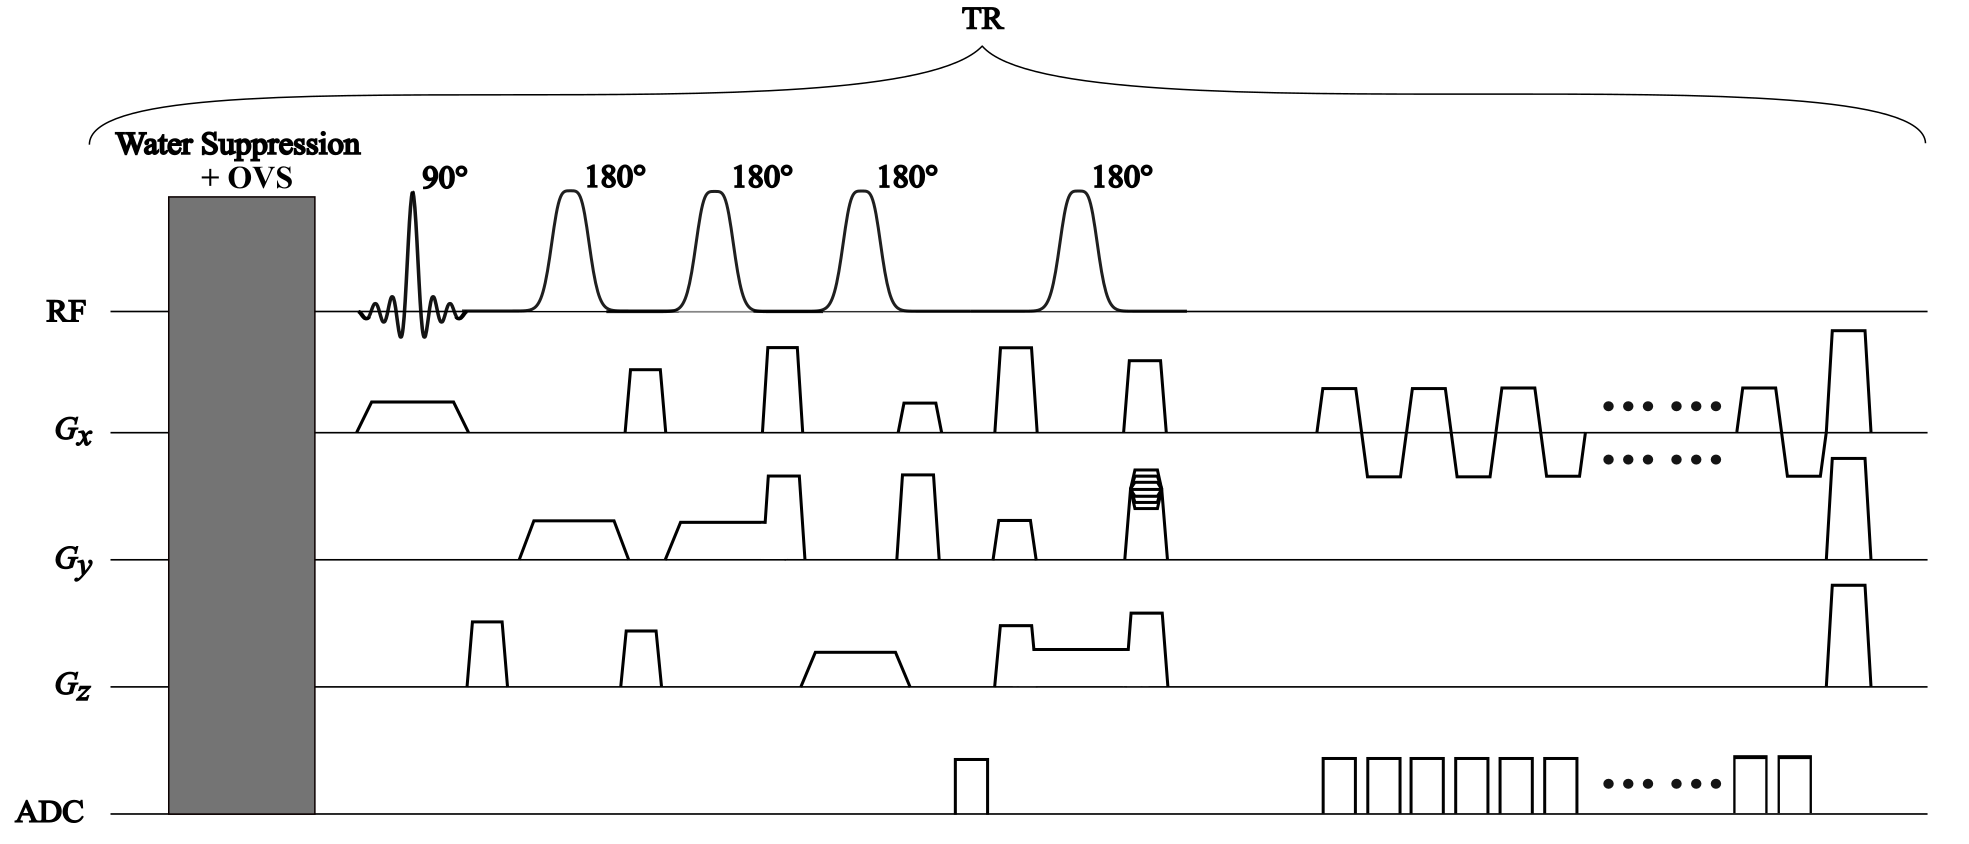
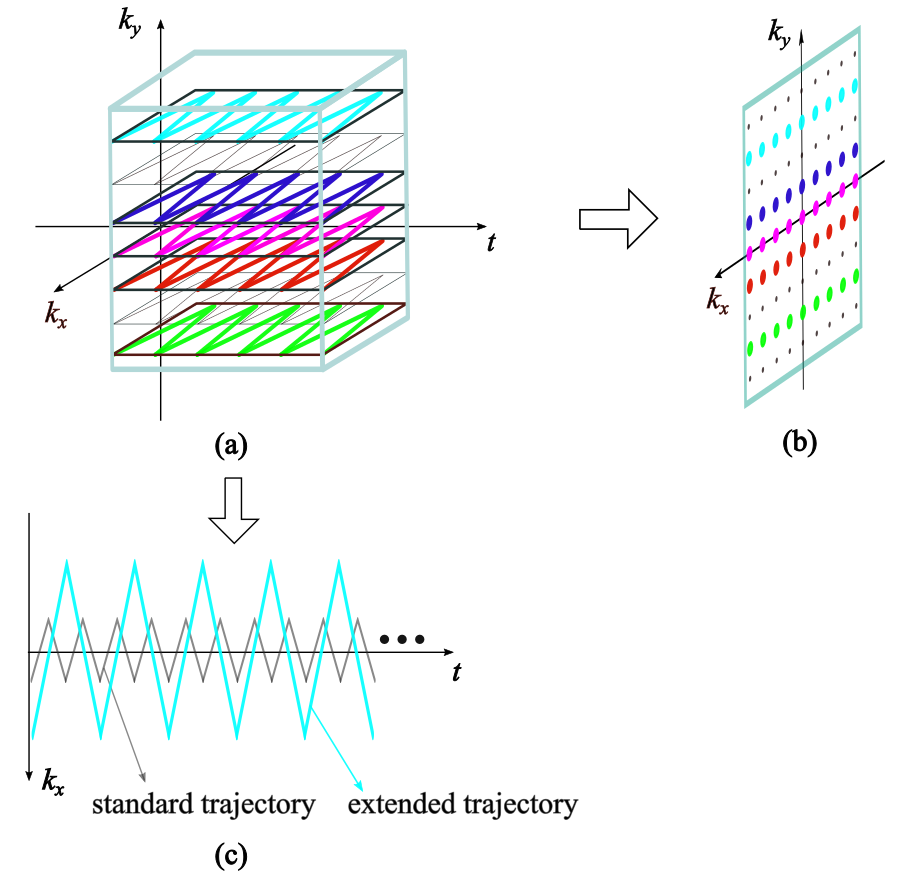
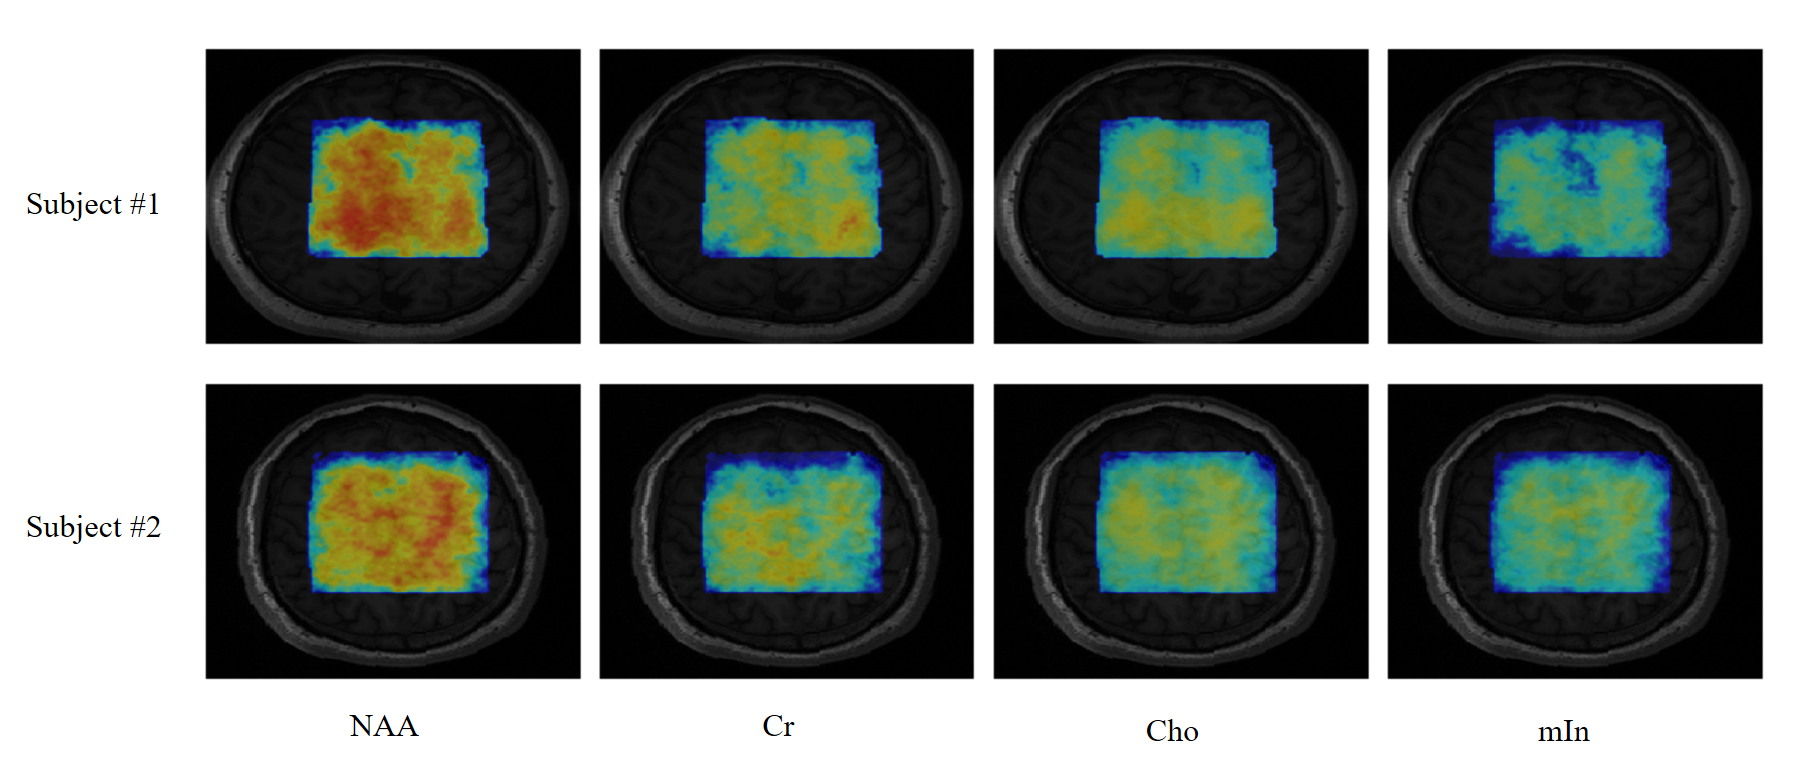
Figure 3. Representative peak integral metabolite maps reconstructed from in vivo data collected in 1.5 minutes with 1.9×1.6 mm2 nominal resolution.
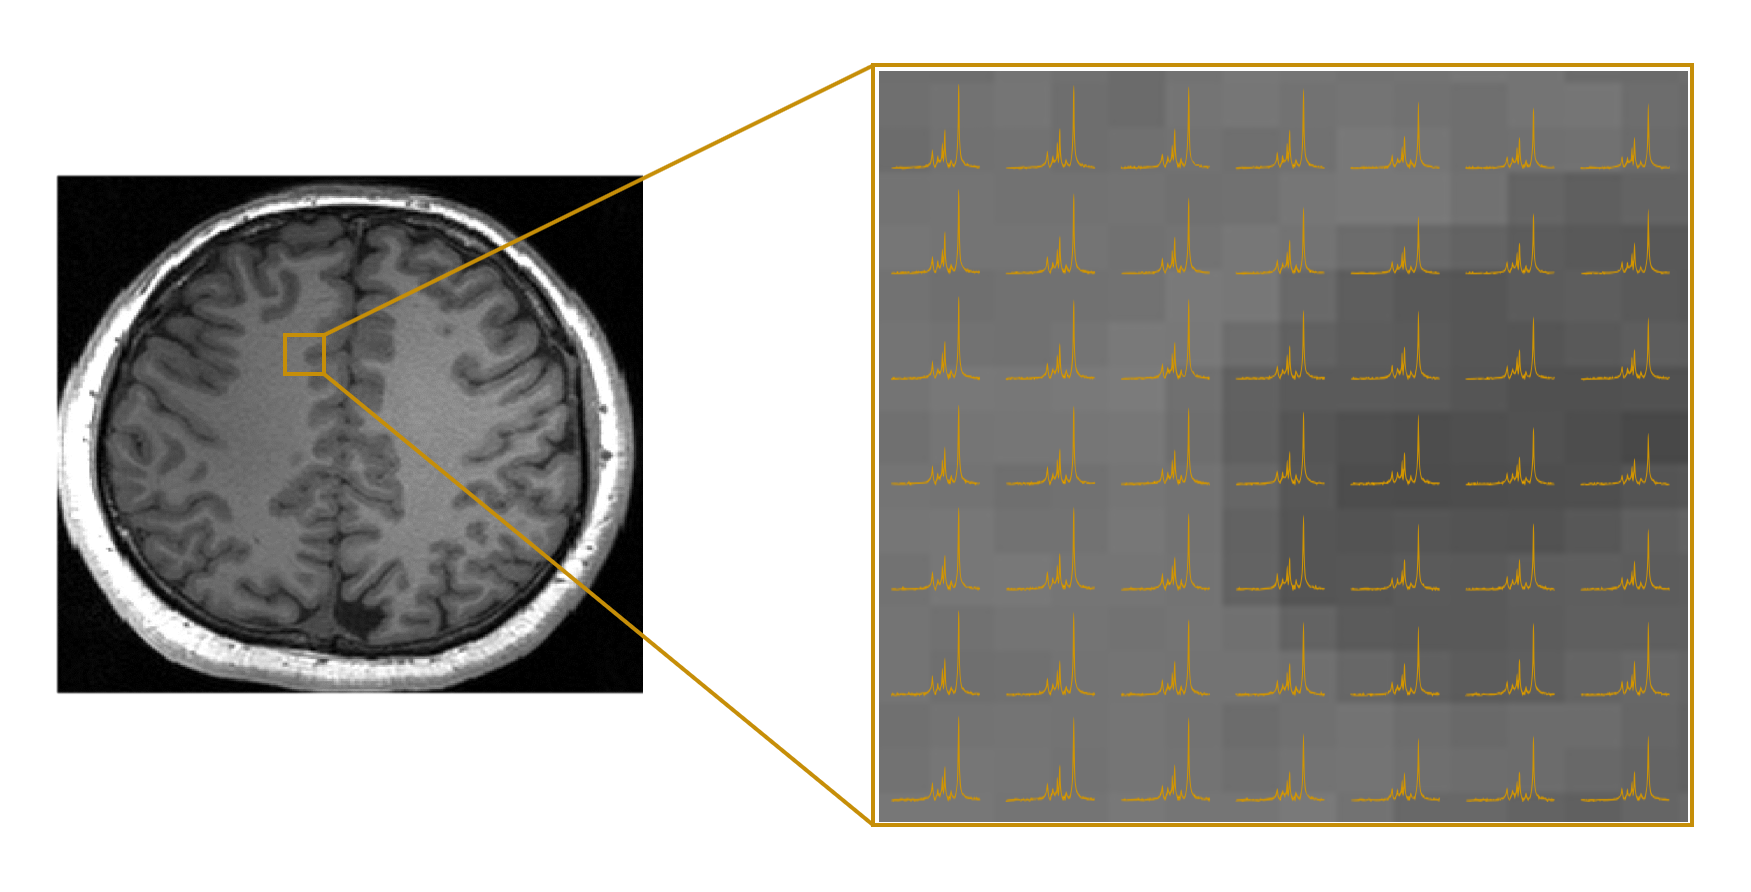
Figure 4. Localized spectra from the selected region. The spectra were obtained from an in vivo data set collected in 1.5 minutes with 1.9×1.6 mm2 nominal resolution.