2477
31P MRSI of the human brain at 9.4 T: Metabolic imaging applying low-rank denoising1High-Field MR Center, Max Planck Institute for Biological Cybernetics, Tübingen, Germany, 2IMPRS for Cognitive and Systems Neuroscience, Eberhard-Karls University of Tübingen, Tübingen, Germany, 3Department for Biomedical Magnetic Resonance, University of Tübingen, Tübingen, Germany
Synopsis
31P MRSI enables the imaging of important components of the energy and cell membrane metabolism but suffers from low intrinsic sensitivity. In this work, we tested the LORA and CLORA low-rank noise reduction approaches to improve the quality of 3D 31P MRSI data and present first in vivo results for 31P MRSI acquired from the human brain at ultrahigh field strength of 9.4 T.
Purpose
To present highly-resolved low-rank noise reduced 31P magnetic resonance spectroscopic imaging (MRSI) data acquired from the human brain at 9.4 T.Introduction
31P MRSI enables non-invasive imaging of important energy metabolites as well as cell membrane build-up and breakdown products but suffers from a low intrinsic sensitivity. Due to the improved SNR with higher field strength, higher resolution 31P MRSI is attainable1,2,3. In this work, we present the first high-resolved 31P MRS images acquired in the human brain at ultrahigh field strength of 9.4 T. So far, only pH maps were presented1. Further, we tested low-rank noise reduction approaches to improve quantification of the spectroscopic data.Methods
Data was acquired from four different volunteers (3 males, 1 female, age: 25-36) on a 9.4 T whole body MRT (Siemens Healthineers, Erlangen, Germany) after signed consent and with an in-house-built double tuned 31P/1H array coil (8TxRx/2Rx for 31P, 10TxRx for 1H). A 3D chemical shift imaging (CSI) sequence1 was used with the following parameters: sinc excitation, 5 averages (weighted acquisition), repetition time TR 300 ms, matrix size 20x20x10, FoV 240x240x200 mm3, nominal voxel volume 2.88 ml and an acquisition bandwidth of 5 kHz. The total acquisition duration (TA) was 58 min. Data post processing included zerofilling, spatial Hamming filtering, a temporal Gaussian filter (50Hz) and correction for frequency shifts due to B0 inhomogeneities. For noise reduction, three different approaches were tested: a voxel wise rank-reduction of the Hankel matrix, the low-rank approximation algorithm LORA4 and the compartmental low-rank approximation algorithm CLORA5. The compartment masks for CLORA were calculated using the tissue segmentation of a MP2RAGE image (TA = 10 min) into CSF, gray matter (GM) and white matter (WM) which was performed with SPM126. The algorithm for co-registration of the tissue segmentation to the spectroscopic data was implemented in Python. CLORA and LORA included two steps:
1. Rank reduction of the 3D data set (compartment wise for CLORA).
2. Additional noise reduction using rank reduction of the Hankel matrix for each individual voxel.
Finally, we fitted the spectra with an implementation of the AMARES7 algorithm in Matlab.
Results and Discussion
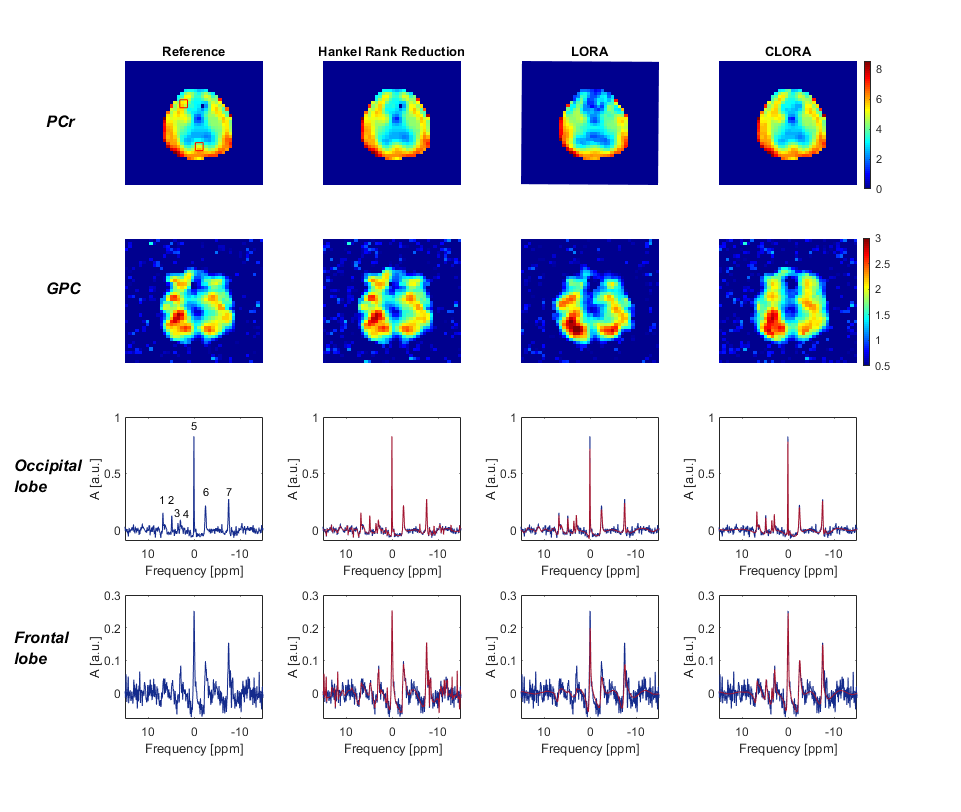
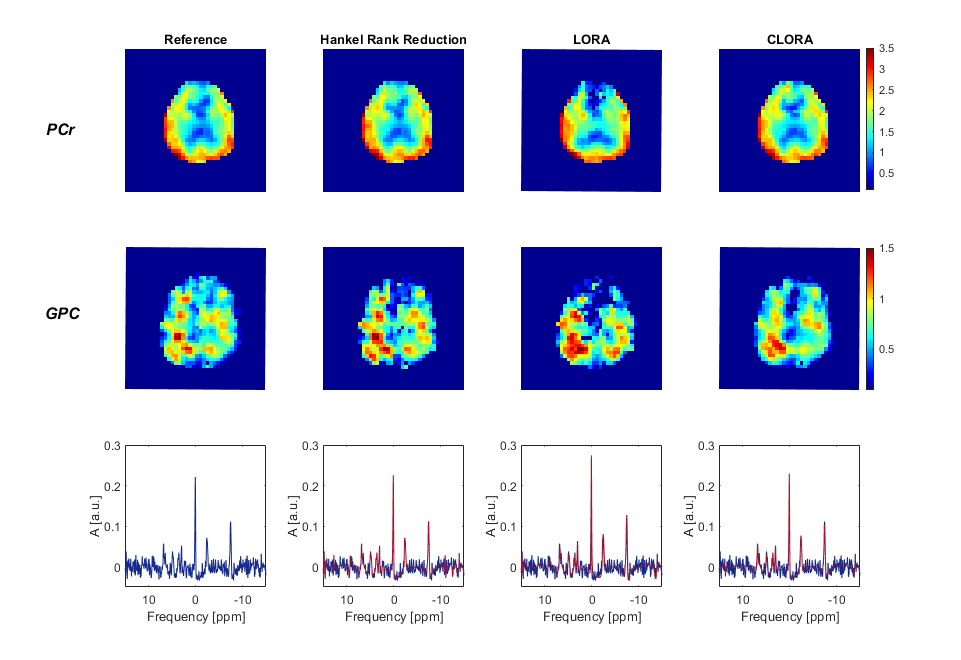
First, we tested all noise reduction approaches on high SNR data by evaluating all five averages. Fig. 1 shows the phosphocreatine (PCr) and the corresponding glycerol-phosphorylcholine (GPC) maps as well as spectra from the occipital and the frontal cortex. LORA and CLORA reconstruction eliminated almost all noise. CLORA metabolite maps seem to agree better with the results without noise reduction and with brain anatomy. The LORA reconstruction seem to produce artifacts in the frontal cortex.
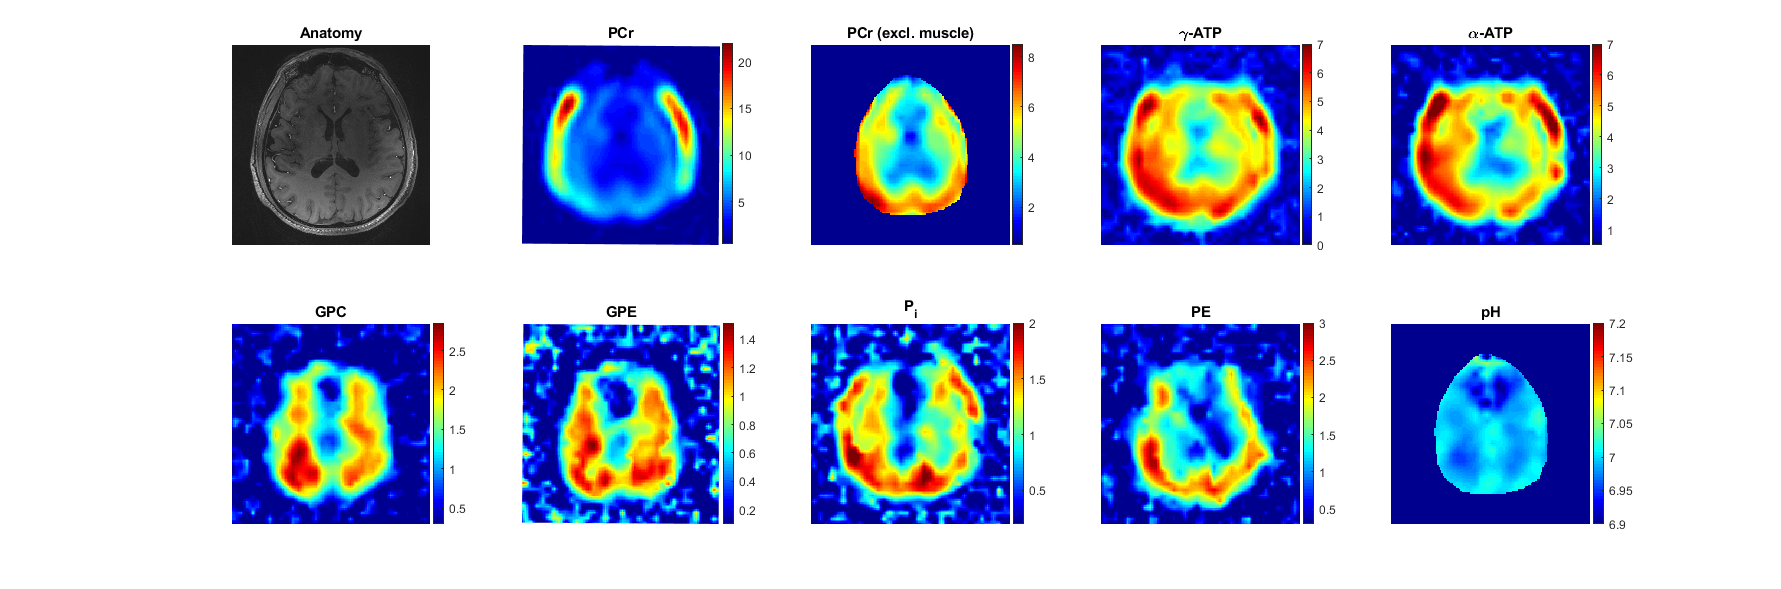
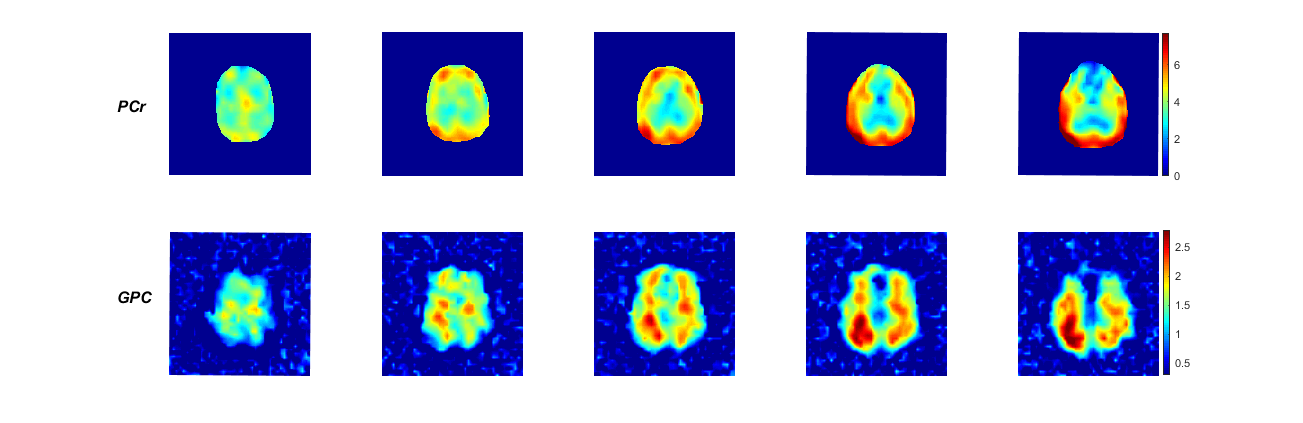
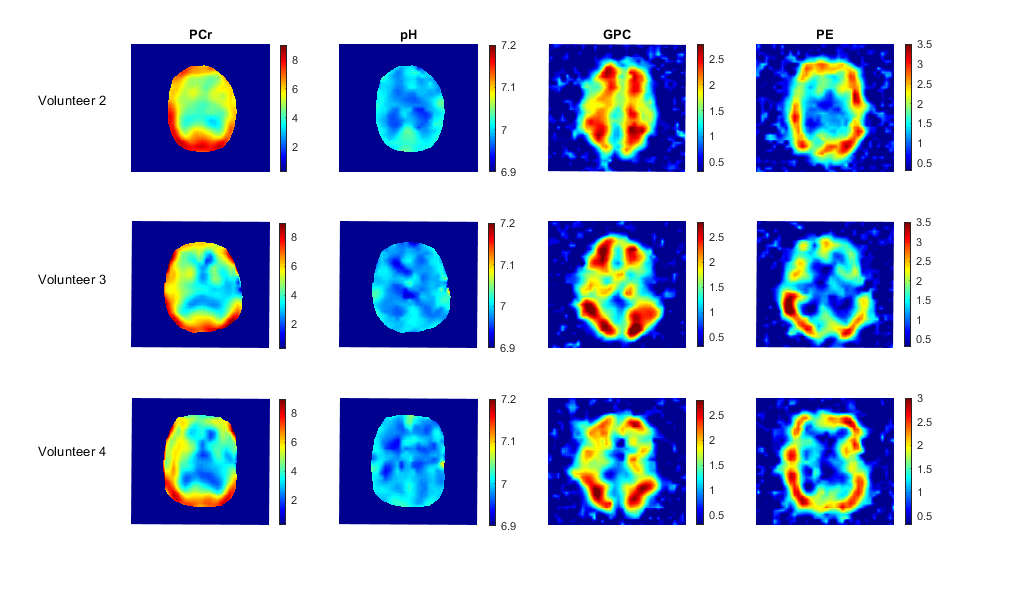
Fig. 2 shows CLORA noise reduced metabolite maps of phosphocreatine (PCr), adenosine triphosphate (ATP), glycerol-phosphorylcholine (GPC), glycerolphsophoryl-ethanolamine (GPE), inorganic phosphate (Pi) and phosphorylethanolamine (PE) as well as pH maps calculated from the relative frequency shift between Pi and PCr8. All components of the energy metabolism (PCr, Pi and ATP) show a signal contribution from the temporalis muscle; especially PCr, which has a high signal in muscle tissue. Inside the brain, PCr signal amplitudes are more comparable to the measured ATP signal amplitudes. As expected, the signal of PCr and ATP is reduced in voxels with CSF contribution. The pH seems to be inhomogeneous over the brain. In the frontal cortex, B0 inhomogeneities potentially impair quantification of the pH (see the spectra in Fig. 1). Nevertheless, the pH seems to show a GM/WM contrast with higher values in GM. This agrees with former publication9. Fig. 3 shows the PCr and GPC signal for different slices. GPC/GPE seem to have a higher signal amplitudes in WM whereas PE shows a higher signal in GM. These distributions are shown for different volunteers in Fig. 4. They also correspond to former publications9. Fig. 4 shows also PCr and pH maps for different volunteers. Note, that no quantitative interpretation of the data is possible as T1 and B1 corrections were not applied. Especially, volunteer 3 and 4 show a signal loss due to inhomogeneous B1 (Fig. 4).
Finally, denoising was tested on data with lower SNR by including only two averages (theoretical TA=28 min). Fig. 5 shows the corresponding PCr and GPC maps. The CLORA filtered maps corresponds well with the results shown in Fig. 1 whereas LORA shows again artifacts in the frontal cortex.
Conclusion
We successful applied LORA and CLORA noise reduction to 31P MRSI data with varying SNR. Results for CLORA denoising look most promising for the presented data. This work also shows the first high-resolved 31P metabolite maps acquired at the human brain at 9.4 T for seven different 31P metabolites.Acknowledgements
Funding by the European Union (ERC Starting Grant, SYNAPLAST MR, Grant Number: 679927) is gratefully acknowledged.References
1. C. Mirkes, et al. 31P CSI pf the human brain in healthy subjects and tumor patients at 9.4 T with a three-layered multi-nuclear coil: initial results. Magn Reson Mater Phy. 2016; 29: 579-589.
2. B. von de Bank, et al. Optimized 31P MRS in the human brain at 7 T with a dedicated RF coil setup. NMR Biomed. 2015; 28(11): 1570-1578.
3. A. Korzowski, et al. High-resolution 31P echo-planar spectroscopic imaging in vivo at 7T. Magn Reson in Med. 2018; 79(3): 1251-1259.
4. H. Nguyen, et al. Denosing MR Spectroscopic Imaging Data with Low-Rank Approximations. IEEE Trans Biomed Eng. 2013; 60(1): 78-89.
5. Y. Liu, et al. Improved Low-Rank Filtering of Magentic Resonance Spectroscopic Imaging Data Currupted by Noise and B0 Field Inhomogeneity. IEEE Trans Biomed Eng. 2016; 63(4): 841-849.
6. J. Ashburner, et al. SPM12 manual. Welcome Trust Center for Neuroimaging. London, UK. 2014 Jun 26.
7. L. Vanhammer,et al. Improved Method to Accurate and Efficient Quantification of MRS Data with Use of Prior Knowledge. J. Magn. Reson. 1997; 129.
8. R. de Graaf. In vivo NMR Spectroscopy – Principle and Techniques. WILEY.
9. W. Dudley, et al. Tissue dependent metabolism in the human brain suggested by quantitative phosphorus-31 MRSI. Journal of Spectroscopy and Dynamics. 2014; 4(19).
Figures