2475
Reducing Signal Spreading with Non-Cartesian Encoding Methods for abdominal 31P 3D-MRSI with Focus on the Gallbladder1Division of Endocrinology and Metabolism, Department of Medicine III, Medical University of Vienna, Vienna, Austria, 2High-field MR Centre, Department of Biomedical Imaging and Image-guided Therapy, Medical University of Vienna, Vienna, Austria, 3Center for Medical Physics and Biomedical Engineering, Medical University of Vienna, Vienna, Austria, 4Christian Doppler Laboratory for Clinical Molecular MR Imaging, Vienna, Austria
Synopsis
This study focuses on 31P 3D MR spectroscopic imaging (MRSI) of the gallbladder and the reduction of voxel bleeding by Non-Cartesian encoded data sampling. Our results demonstrate on a phantom that the contamination due to point-spread-function (PSF) can be decreased compared to conventional Cartesian phase encoding. Qualitative improvements were investigated by metabolic mapping of biliary phosphatidylcholine (PtdC) originating from the gallbladder.
Purpose
31P MR spectroscopic imaging (MRSI) offers a possibility to detect phosphatidylcholine (PtdC), the major component of the human bile1. Concentration changes may point towards altered metabolism2 or disturbed PtdC secretion into the bile which indicates possible hepatobiliary pathologies3. MRSI at ultra-high fields leads to an enhanced spectral resolution and improved SNR per time unit4. For a proper quantification of PtdC it is important that the apparent voxel size of the analyzed volume does not spread over the border of the gallbladder to adjacent hepatic tissue and vice versa due to partial volume effects. Thus, narrowing the point-spread-function (PSF) is advisable. This study focuses on the PSF analysis and comparison between different k-space sampling methods such as conventional Cartesian phase encoding (CPE), encoding using spiral trajectories (SPT)5 and encoding using concentric ring trajectories (CRT)6 and their feasibility for in vivo abdominal application. Due to faster sampling using SPT or CRT sensitivity to motion artifacts could be reduced.Methods
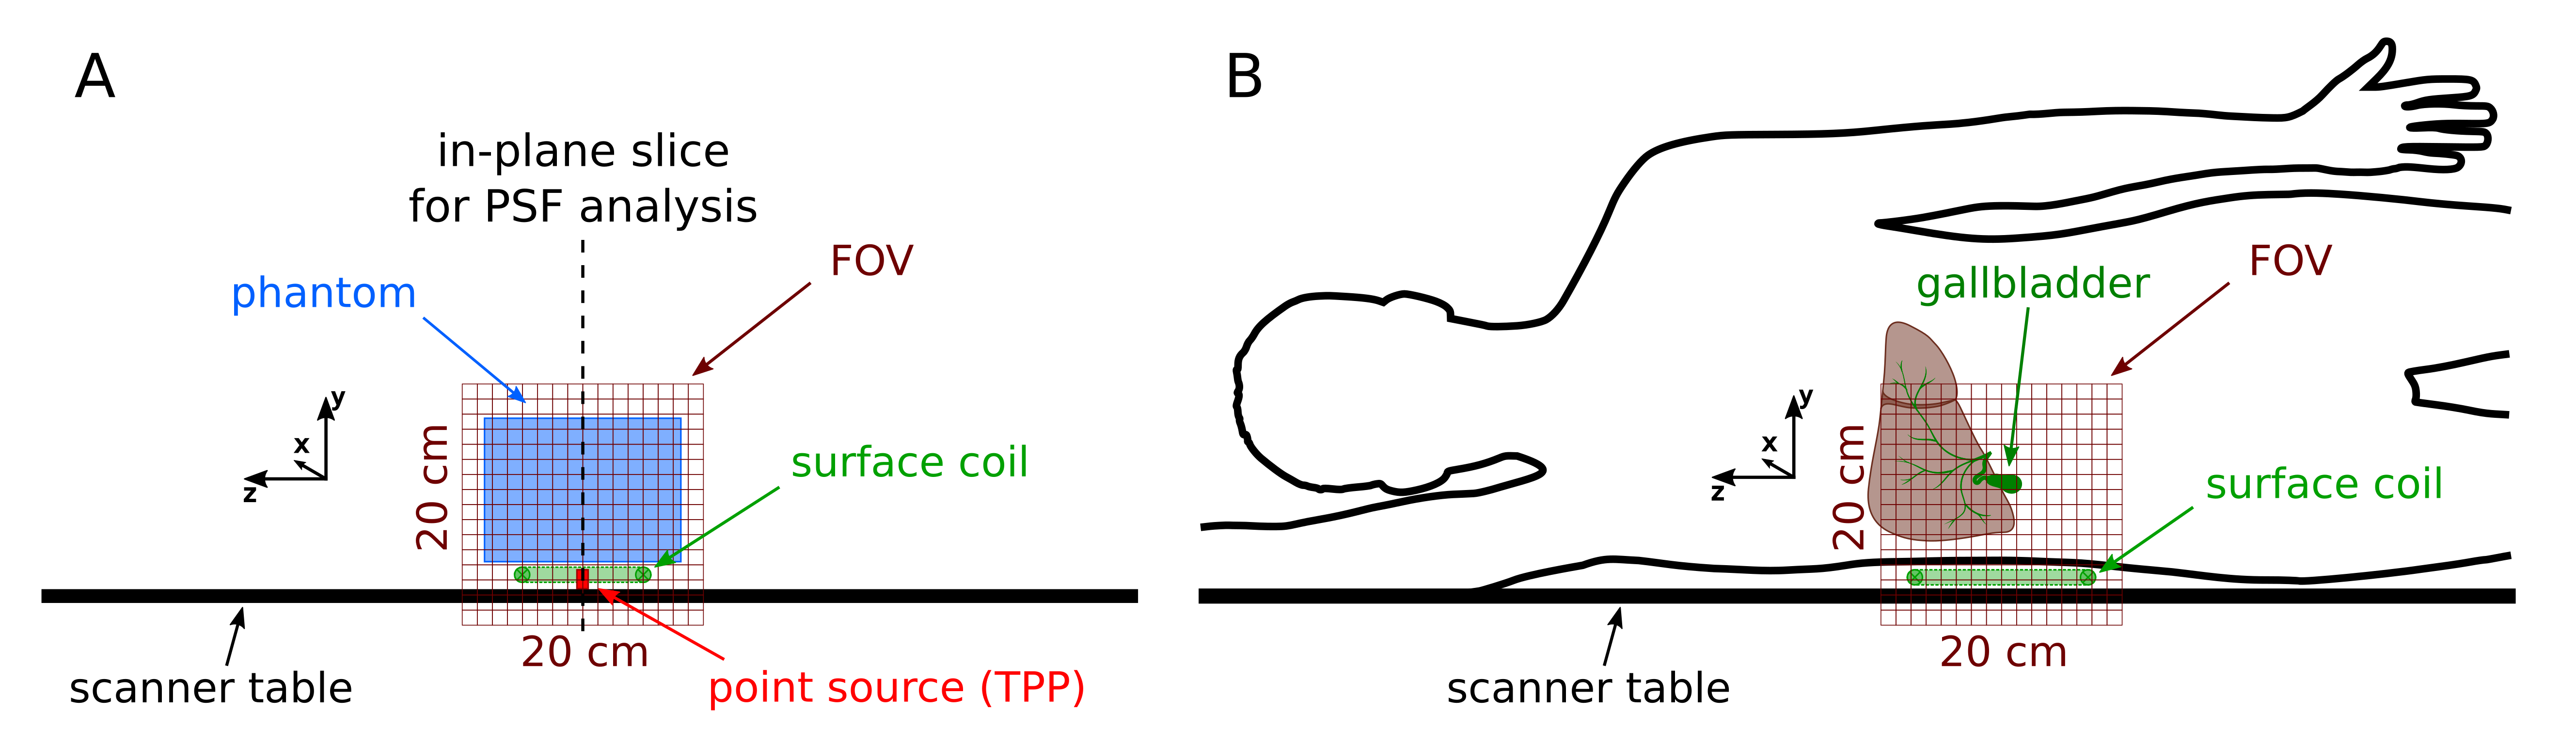
All measurements were performed on a 7T MR System (Siemens Healthineers, Erlangen, Germany) using double-tuned 1H/31P surface coils (31P-loops: 10.5cm and 14cm, Rapid Biomedical, Rimpar, Germany). The smaller one was used for a phantom measurement while in vivo the 14cm coil was used due to deeper B1 tissue penetration to localize the gallbladder properly. The point-spread-function (PSF) was determined by the following measurement: to ensure proper shimming and coil loading a large phantom (20mmol/L 31P, 5L) was placed on top of the coil and a small cylindrical vial (1mL, triphenylphosphate (TPP) diluted in chloroform) serving as the point source was positioned slightly below the coil (Fig.1A). Three different FID-based 3D-MRSI sequences (with the same settings for TE=0.9ms, TR=1.8s, FOV: 20x20x20cm³, 12x12x12 matrix zero-filled to 16x16x16 placed in the isocenter, frequency centered on the TPP signal) were used for acquisition: one with conventional Cartesian phase encoding (CPE, 600µs block pulse, 100V reference voltage, bandwidth 3500Hz), and two Non-Cartesian encoding sequences using spiral trajectories (SPT, 600µs block pulse, 100V reference voltage, bandwidth 3500Hz) and concentric ring trajectories (CRT, 600µs sinc pulse, 100V reference voltage, bandwidth 3846Hz) in-plane and phase encoding in partition direction. The k-space was sampled spherical with CPE and cylindrical with both SPT and CRT. To keep the measurement time similar averaging was applied for the Non-Cartesian sequences in partition direction. The total measurement time was 16:20min for CPE, 18:10min for SPT (5 averages) and 17:25min for CRT (4 averages). The TPP signal at 0ppm was fitted with a single peak with jMRUI using AMARES7,8 and its distribution was analyzed to characterize the PSF. The in-plane diameter of the ‘real’ voxel size was estimated as full-width-half-maximum (FWHM) of the interpolated signal distribution along the x-direction.
An in vivo measurement was performed using the same sequences with a reference voltage of 300V. The volunteer (male, 25y, BMI: 21.7kg.m-2) was measured after over-night fasting to ensure the gallbladder filled with bile. MR-acquisition was performed with the volunteer in a right lateral position and the gallbladder centered above the RF-coil (Fig.1B). A slice through the gallbladder was analyzed by fitting PtdC, the prominent signal of the bile (at ~2.2ppm).
Results
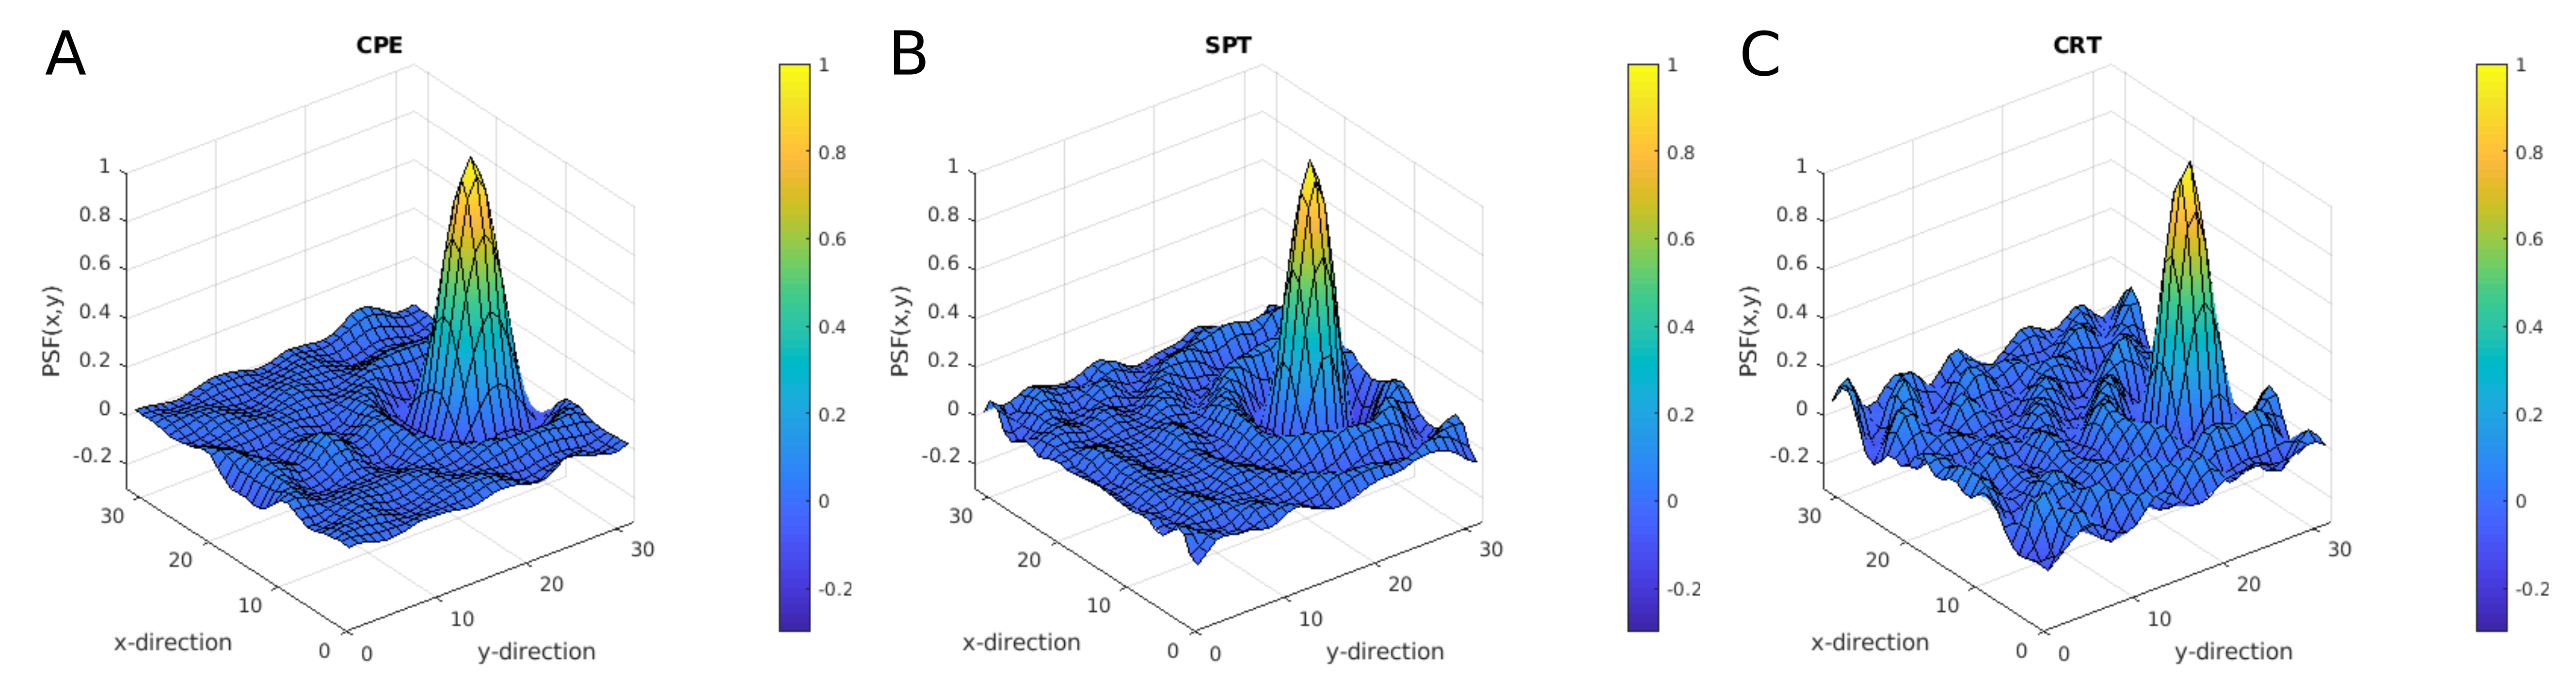
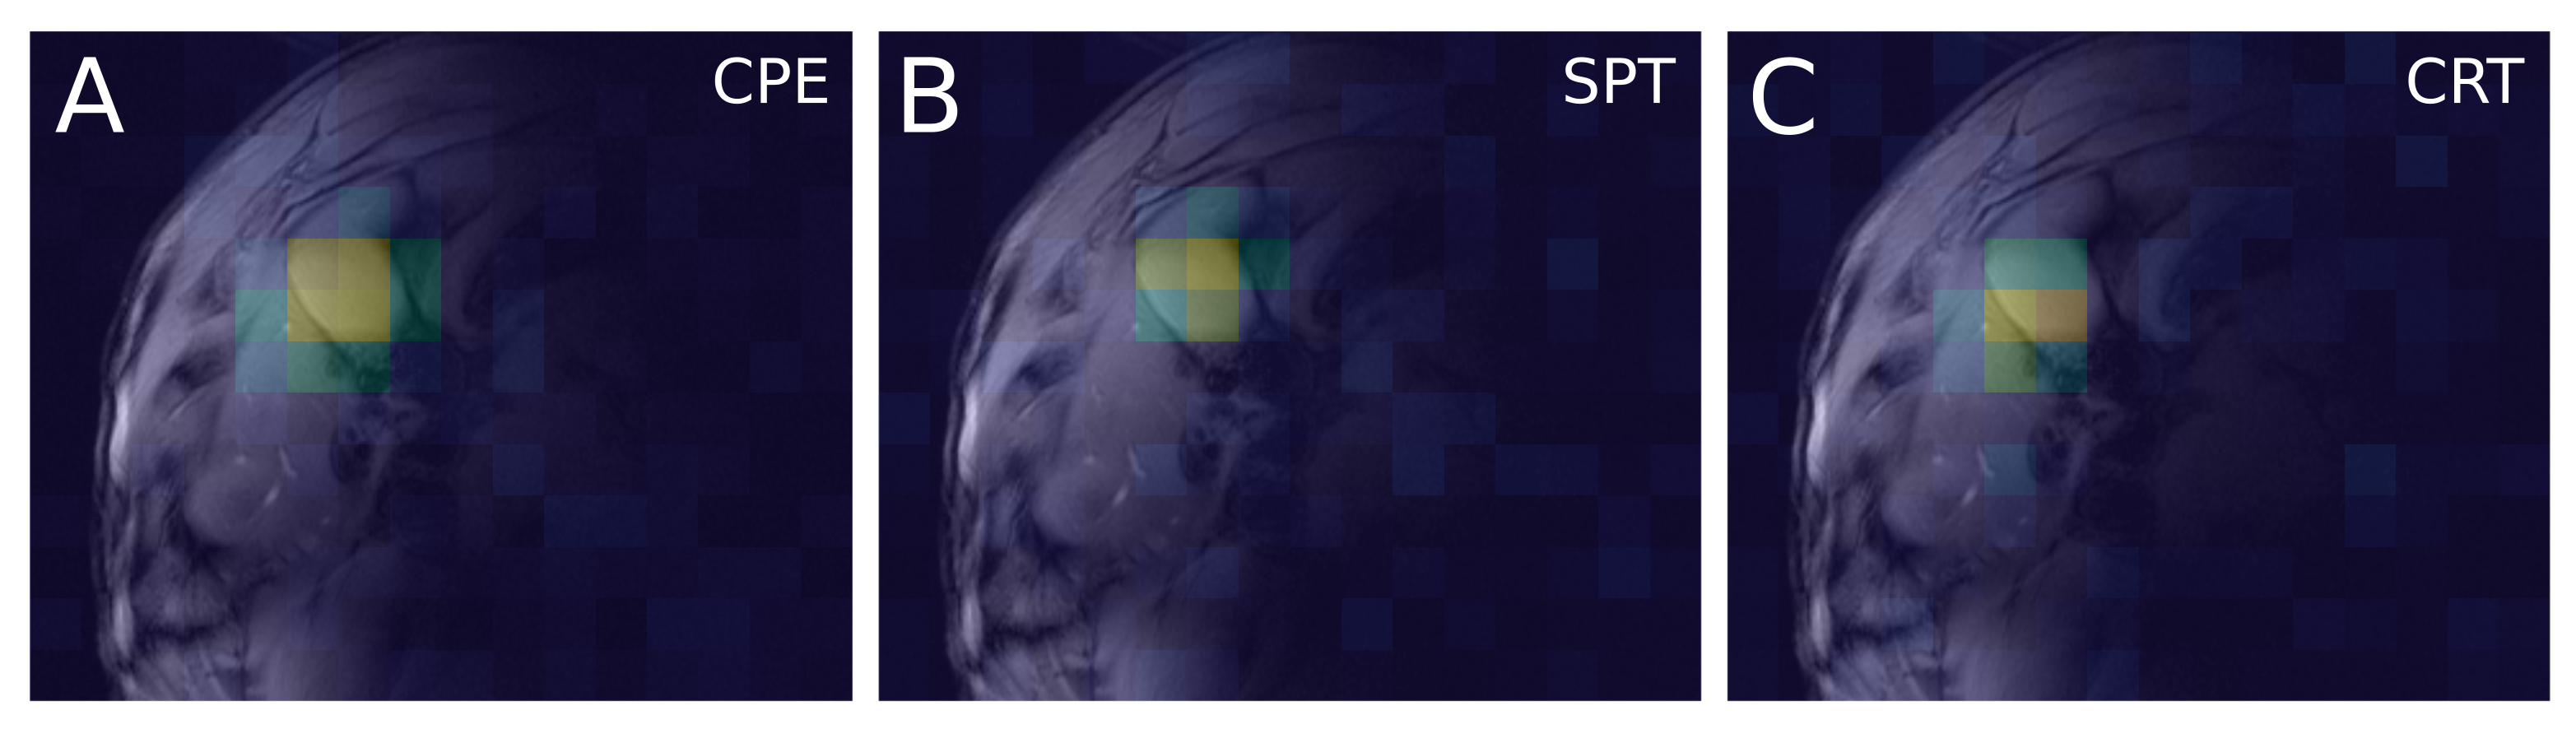
The signal distribution of TPP in-plane of the three methods visualizing the PSF is shown in Fig.2. The in-plane FWHM was calculated to be 31mm for CPE, and 26mm for both SPT and CRT and thus leading to a size reduction (in-plane) of about 30% for the Non-Cartesian encoding sequences. In vivo results are presented in Fig.3: The PtdC signal distribution of the slices containing the voxel of most PtdC signal is mapped on the corresponding anatomical localizer images. The area with high PtdC signal is less extended when using SPT or CRT compared to CPE.Discussion/Conclusion
The PSF analysis shows a great in-plane reduction when using Non-Cartesian encoding methods. This is beneficial for MRSI measurements and quantification of small volume organs such as the gallbladder due to reducing signal bleeding to adjacent voxels as well as signal contamination spreading from surrounding tissue into the organ of interest. The in vivo application of the three different acquisition methods shows that the localization can be achieved more accurate when encoding with CRT or SPT rather than with CPE. As a next step a quantitative SNR analysis needs to be performed to evaluate the characteristics of SPT and CRT in a more detail. This was not part of the study for various reasons: The measurement time could not be kept equal, the bandwidth is determined by other parameters and cannot be chosen freely for Non-Cartesian encoding and a block pulse for excitation was not yet available in our CRT sequence.Acknowledgements
The study was supported by the Austrian National Bank Project #16724.References
- Chmelík M, Valkovič L, Wolf P, et al. Phosphatidylcholine contributes to in vivo (31)P MRS signal from the human liver. Eur Radiol. 2015
- Khan SA, Cox IJ, Thillainayagam AV, et al. Proton and phosphorus-31 nuclear magnetic resonance spectroscopy of human bile in hepatopancreaticobiliary cancer. Eur J Gastroenterol Hepatol. 2005
- Valkovič L, Chmelík M, Krššák M. In-vivo 31P-MRS of skeletal muscle and liver: A way for non-invasive assessment of their metabolism. Anal Biochem 2017
- Chmelík M, Považan M, Krššák M, et al. In vivo (31)P magnetic resonancespectroscopy of the human liver at 7 T: an initial experience. NMRBiomed 2014
- Valkovič L, Chmelík M, Meyerspeer, M, et al. Dynamic 31P–MRSI using spiral spectroscopic imaging can map mitochondrial capacity in muscles of the human calf during plantar flexion exercise at 7 T. NMR Biomed 2016
- Hingerl L, Bogner W, Moser P, et al. Proton and phosphorus-31 nuclear magnetic resonance spectroscopy of human bile in hepatopancreaticobiliary cancer. Magn Reson Med. 2018
- Naressi A, Couturier C, Devos JM, et al. Java-based graphical user interface
for the MRUI quantitation package. MAGMA 2001
- Stefan D, Cesare FD, Andrasescu A, et al. Quantitation of magnetic resonance
spectroscopy signals: the jMRUI software package. Meas Sci Technol
2009
Figures