2470
Automated cloud-based workflow for quantification of MRI signal intensity – initial real-world clinical validation1QMENTA Inc., Barcelona, Spain, 2Bayer Radiology, Whippany, NJ, United States, 3Cedars Sinai Medical Center, Los Angeles, CA, United States
Synopsis
One-third of brain MRI scans performed worldwide make use of gadolinium-based contrast agent injections to enable detection of the breakdown in the blood brain barrier by the resulting enhancement. Observations have shown increased signal intensity particularly in the globus pallidus and thalamus after multiple doses of linear contrast agents but there is no standard procedure to measure this contrast intensity. Current quantitative methods are manual, labor intensive, time-consuming and provide variable results.
We present a fully automatic workflow which accelerates the investigation of signal intensity in these nuclei after multiple doses of contrast agents by extracting the T1-weighted modal intensity value and applying appropriate corrections and normalizations to allow comparison across acquisitions and protocols. Automatic results matched up to 94% correlation with manual results and reduced the time by 90%.
PURPOSE
A lot of research is now underway in trying to understand the mechanism of increased signal intensity (SI) and gadolinium presence in the brain and whether it has a clinical implication for patients1. The standard measuring procedure involves manual segmentation of brain regions and the SI measurement, which are labor-intensive, time-consuming steps and subjective to the neuroradiologist. To help address this challenge, an automated signal intensity quantification software was developed and validated against manually obtained values from clinical routine patient data2.METHODS
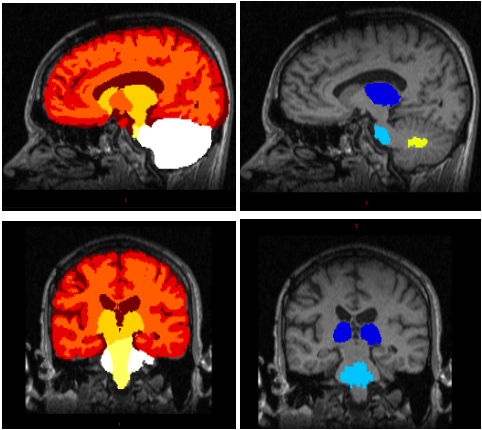
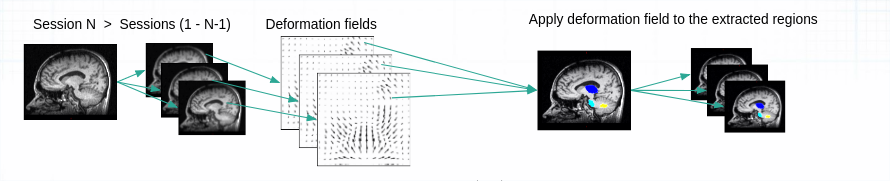
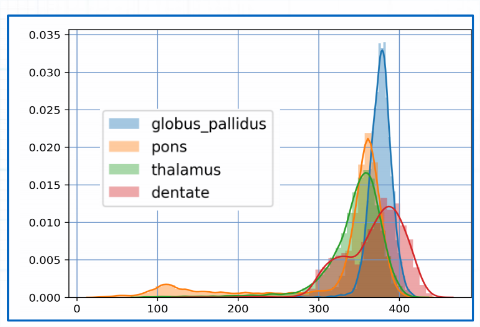
Pre-contrast T1-weighted images were collected retrospectively from an IRB approved study involving patients having undergone at least 8 gadolinium-based contrast agent enhanced MR scans at Cedars Sinai Medical Center in the 2008-2016 period (Optimark, MultiHance, Omniscan or Gadavist). T1 weighted images were acquired at 1.5T and 3T Siemens scanners (1.5T: TR 1330 ms; TE 4.8 ms; TI 800 ms; flip angle 15°; section thickness 12.5 mm; matrix size: 256 × 192; echo-train length 1 | 3T: TR 2100 ms; TE 3.0 ms; TI 900 ms; flip angle 9°; section thickness 11 mm; matrix size 256 × 256; echo train length 1). We have developed a workflow for the automated region of interest (ROI) segmentation and signal intensity parameter measurements, implemented within the QMENTA cloud platform3. The processing workflow takes as input all the available T1-weighted images for the different sessions of the selected subject. The region segmentation is done in the last session available with a pre-contrast T1. We perform a tissue segmentation and ROI extraction (fig. 1) using ANTs4 library and the DKT31 template5 to extract the globus pallidus and the thalamus. We segment the cerebellum using the SUIT6 template in order to extract the dentate nuclei, and the pons is extracted using an MNI152 template. The T1 used for ROI extraction is non-linearly registered to the corresponding T1 of each subject session using ANTs7 to correct for tumor-induced deformations. The warp fields generated are used to propagate the ROIs to each session (fig. 2). The modal signal intensity for the T1 weighted image (most recurrent value) is extracted from each ROI in each session (fig. 3). The obtained values are corrected for differing TE, TR, TI and field-strength values using the appropriate sequence signal equation and tissue constant values reported by Fletcher et al. (1993)8. Modal values for the dentate and the globus pallidus are normalized by the pons and thalamus modal values respectively, to compensate for inter-scanner variability and provide a value that has been suggested to be more comparable across time points (for the same sequence). For validation, manual segmentation and signal intensity measurements were conducted by an experienced neuroradiologist on the dentate nucleus (DN), globus pallidus (GP) and pons on the same data2.RESULTS
The automated longitudinal analysis processed successfully all the subjects9. Automated measurements were found to match manual results, with correlation coefficients 0.94, 0.90 and 0.93 for DN, GP, and pons, respectively. No obvious bias or trend was found on Bland-Altman plots as well.DISCUSSION
The tool saves a lot of radiologist time as the manual process for this kind of image processing can take up to 30 minutes per dataset. The radiologist time involved in this study amounted to over 100 hours while the automated processing was completed in 10 hours processed in the parallel computing cloud. Manual results might be a biased gold-standard as the signal intensity measurements during the manual review were made based on oval ROI while the software segments whole structure.CONCLUSION
We have presented a tool that can significantly accelerate current studies on contrast-agent MR safety, reducing costs and freeing up radiologists’ time for interpretation purposes. The software can be easily adapted to any other brain ROI and MRI sequences/modalities in order to standardize and objectivize SI measurements. This has applications not only in measuring contrast uptake and/or deposition of different compounds on other brain regions, but potentially in other clinical settings, such as studying tissue changes during brain development. Future work will focus on increasing correlation with the gold-standard by further improvement of ROI segmentation and modal value extraction methods, as well as the identification of additional clinically relevant applications.Acknowledgements
No acknowledgement found.References
1 Dr Vikas Gulani, MD. Prof Fernando Calamante, PhD. Prof Frank G Shellock, PhD. Prof Emanuel Kanal, MD. Prof Scott B Reeder, MD et al. (2017) Gadolinium deposition in the brain: summary of evidence and recommendations DOI: 10.1016/S1474-4422(17)30158-8.
2 F.G. Moser et al. (2018) High Signal Intensity in the Dentate Nucleus and Globus Pallidus on Unenhanced T1-Weighted MR Images: Comparison between Gadobutrol and Linear Gadolinium-Based Contrast Agents DOI: https://doi.org/10.3174/ajnr.A5538.
3 Lazovski, N., Ramos, M., Moreno-Dominguez, D., Sato, T., Peeters, T., Prčkovska, V., & Rodrigues, P. (2017). Neuroimaging workflow in the cloud : standardizing research. In OHBM 2017: 23rd Annual Meeting of the Organization for Human Brain Mapping. DOI: 10.13140/RG.2.2.30763.75041.
4 Avants, B.B., Tustison, N.J., Wu, J. et al. (2011) Neuroinform 9: 381.
5 Klein A and Tourville J (2012) 101 labeled brain images and a consistent human cortical labeling protocol. Front. Neurosci. 6:171.
6 Diedrichsen, J. et al. (2011) Imaging the deep cerebellar nuclei: A probabilistic atlas and normalization procedure.
7 Avants B.B., Epstein C.L., Grossman M., Gee J.C. (2008) Symmetric diffeomorphic image registration with cross-correlation: Evaluating automated labeling of elderly and neurodegenerative brain. Medical Image Analysis, 12 (1), pp. 26-41.
8 L.M. Fletcher, J.B. Barsotti, J.P. Hornak (1993) "A Multispectral Analysis of Brain Tissues." Magn. Reson. Med. 29:623-630.
9 Jinnan W. et al (2018) Automated signal intensity quantification software – initial “real world” clinical validation.
Figures