2469
Simultaneous Voxel-based Magnetic Susceptibility and Morphometry Analysis in Patients with Alzheimer’s Disease1Department of Radiology, Nagoya City University Hospital, Nagoya, Japan, 2Department of Neurology, Nagoya City University, Nagoya, Japan, 3Department of Rehabilitation Medicine, Nagoya City University, Nagoya, Japan, 4Department of Radiology, Toyokawa City Hospital, Yoyohashi, Japan
Synopsis
This abstract introduces an analysis pipeline of voxel-based magnetic susceptibility and morphometry (VBMSM) on single MR scan. To validate the proposed pipeline, we conducted VBMSM in control and Alzheimer’s disease (AD) groups. VBM was performed using the magnitude image. The susceptibility map was estimated by new dipole inversion utilized segmentation result. For whole brain susceptibility comparison, the susceptibility map was spatially normalized by the same transformation parameter for VBM. Significant susceptibility increases could be detected in regions associated withβ-amyloid deposition in AD. Brain atrophy also could be detected in AD. VBMSM is adaptable to neurodegenerative diseases including AD.
Purpose
Quantitative susceptibility mapping (QSM) and voxel-based morphometry (VBM) analyses are helpful for detecting abnormal iron overload1-4 and brain atrophy5, 6. To develop and validate an analysis pipeline of voxel-based magnetic susceptibility and morphometry (VBMSM) on single dataset with a novel dipole inversion, we conducted magnetization-prepared spoiled turbo multiple gradient echo sequence with inversion pulse for QSM (MP-QSM) sequence in elderly healthy volunteers and patients with Alzheimer’s disease (AD).
Material and Method
On 3.0 T MRI scanner (Ingenia 3.0 T, Philips), 1 mm3 iso-voxel MP-QSM which provided T1-weighted and multi-echo phase images was conducted in 19 elderly healthy volunteers and 38 patients with AD (71 ± 5 y.o. and 80 ± 6 y.o., respectively). The scan parameters for MP-QSM were: TE = 6.0 – 30.8 ms with 6.2 ms interval, TR = 35 ms, flip angle = 15 degrees, acquisition matrix = 192 × 192 × 140, inversion time = 1200 ms, and shot interval = 2400 ms.
Voxel-based magnetic susceptibility and morphometry (VBMSM)
1. Voxel-based morphometry
In left side of Fig. 1, the magnitude image of first echo was segmented into the white matter, gray matter (GM), and cerebrospinal fluid (CSF) on SPM12. The GM images were spatially normalized into MNI space by using the subject-specific template generated from DARTEL algorithm7. The segmented GM images were modulated and smoothed with 8 mm FWHM Gaussian kernel.
2. Voxel-based magnetic susceptibility
In right side of Fig. 1, the local field map was estimated from multi-echo phase images using Laplacian-based phase unwrapping8 and spherical mean value filtering with varying kernel sizes from 0.75 to 25 mm9. The susceptibility map was reconstructed from the local field by an extended iLSQR10, 11 (e-iLSQR) algorithm (Eq. 1 – 3).
$$ argmin_{\chi_{int}}\parallel{W(F^{-1}DF\chi_{int}-\phi)}\parallel_2^2+\lambda_{CSF}\parallel{M_{CSF}\chi_{int}}\parallel_2^2 [1] $$
$$ argmin_{\chi_{SA(k)}}\sum_{i=1}^3\parallel{W_{G_{i}}F^{-1}G_{i}F(\chi_{int}-F^{-1}(\chi_{SA(k)}M_{IC}))}\parallel_2^2 [2] $$
$$ \chi_{e-iLSQR}=\chi_{int}-F^{-1}(\chi_{SA(k)}M_{IC}) [3] $$
where W is a spatial weighting term generated by quadratic differentiation of local field, D is the dipole kernel, and 𝜙 is local field. and are regularization parameter and CSF images segmented for VBM. χSA(k) is the streaking artifacts estimated from χint, Gi are the gradient operators in each coordinate in the Fourier domain, WGi is the weighting mask, and MIC is the binary mask of the ill-conditioned points in the dipole kernel. The remarkable point of e-iLSQR is that the L2-regularization within MCSF segmented by SPM12 is combined with initial susceptibility map estimation in Eq. 1 to minimize streaking artifact induced by low SNR area of CSF. The final susceptibility map was calculated by subtraction between initial susceptibility map and streaking artifact estimated by Eq. 2, as expressed by Eq. 3. Next, the susceptibility map was multiplied with the binary mask based on segmentation result of GM. The resulted susceptibility map and brain mask after QSM process were applied to the same transformation parameter for VBM. The significant benefit of VBMSM is that any image registrations prior to spatial normalization are unnecessary between susceptibility map and structural image. To restrict the analytical area for voxel-based magnetic susceptibility, the analytical mask was generated following Fig. 2.
3. Statistical analyses for VBMSM
Voxel-wise whole GM comparisons were made to determine the regions of differences in volumes and susceptibility value between elderly volunteers and patients with AD. A significant level of p = 0.05 was applied with family-wise error correction for multiple comparisons, and intracranial volume (VBM only) and age as covariates.
Results and Discussion
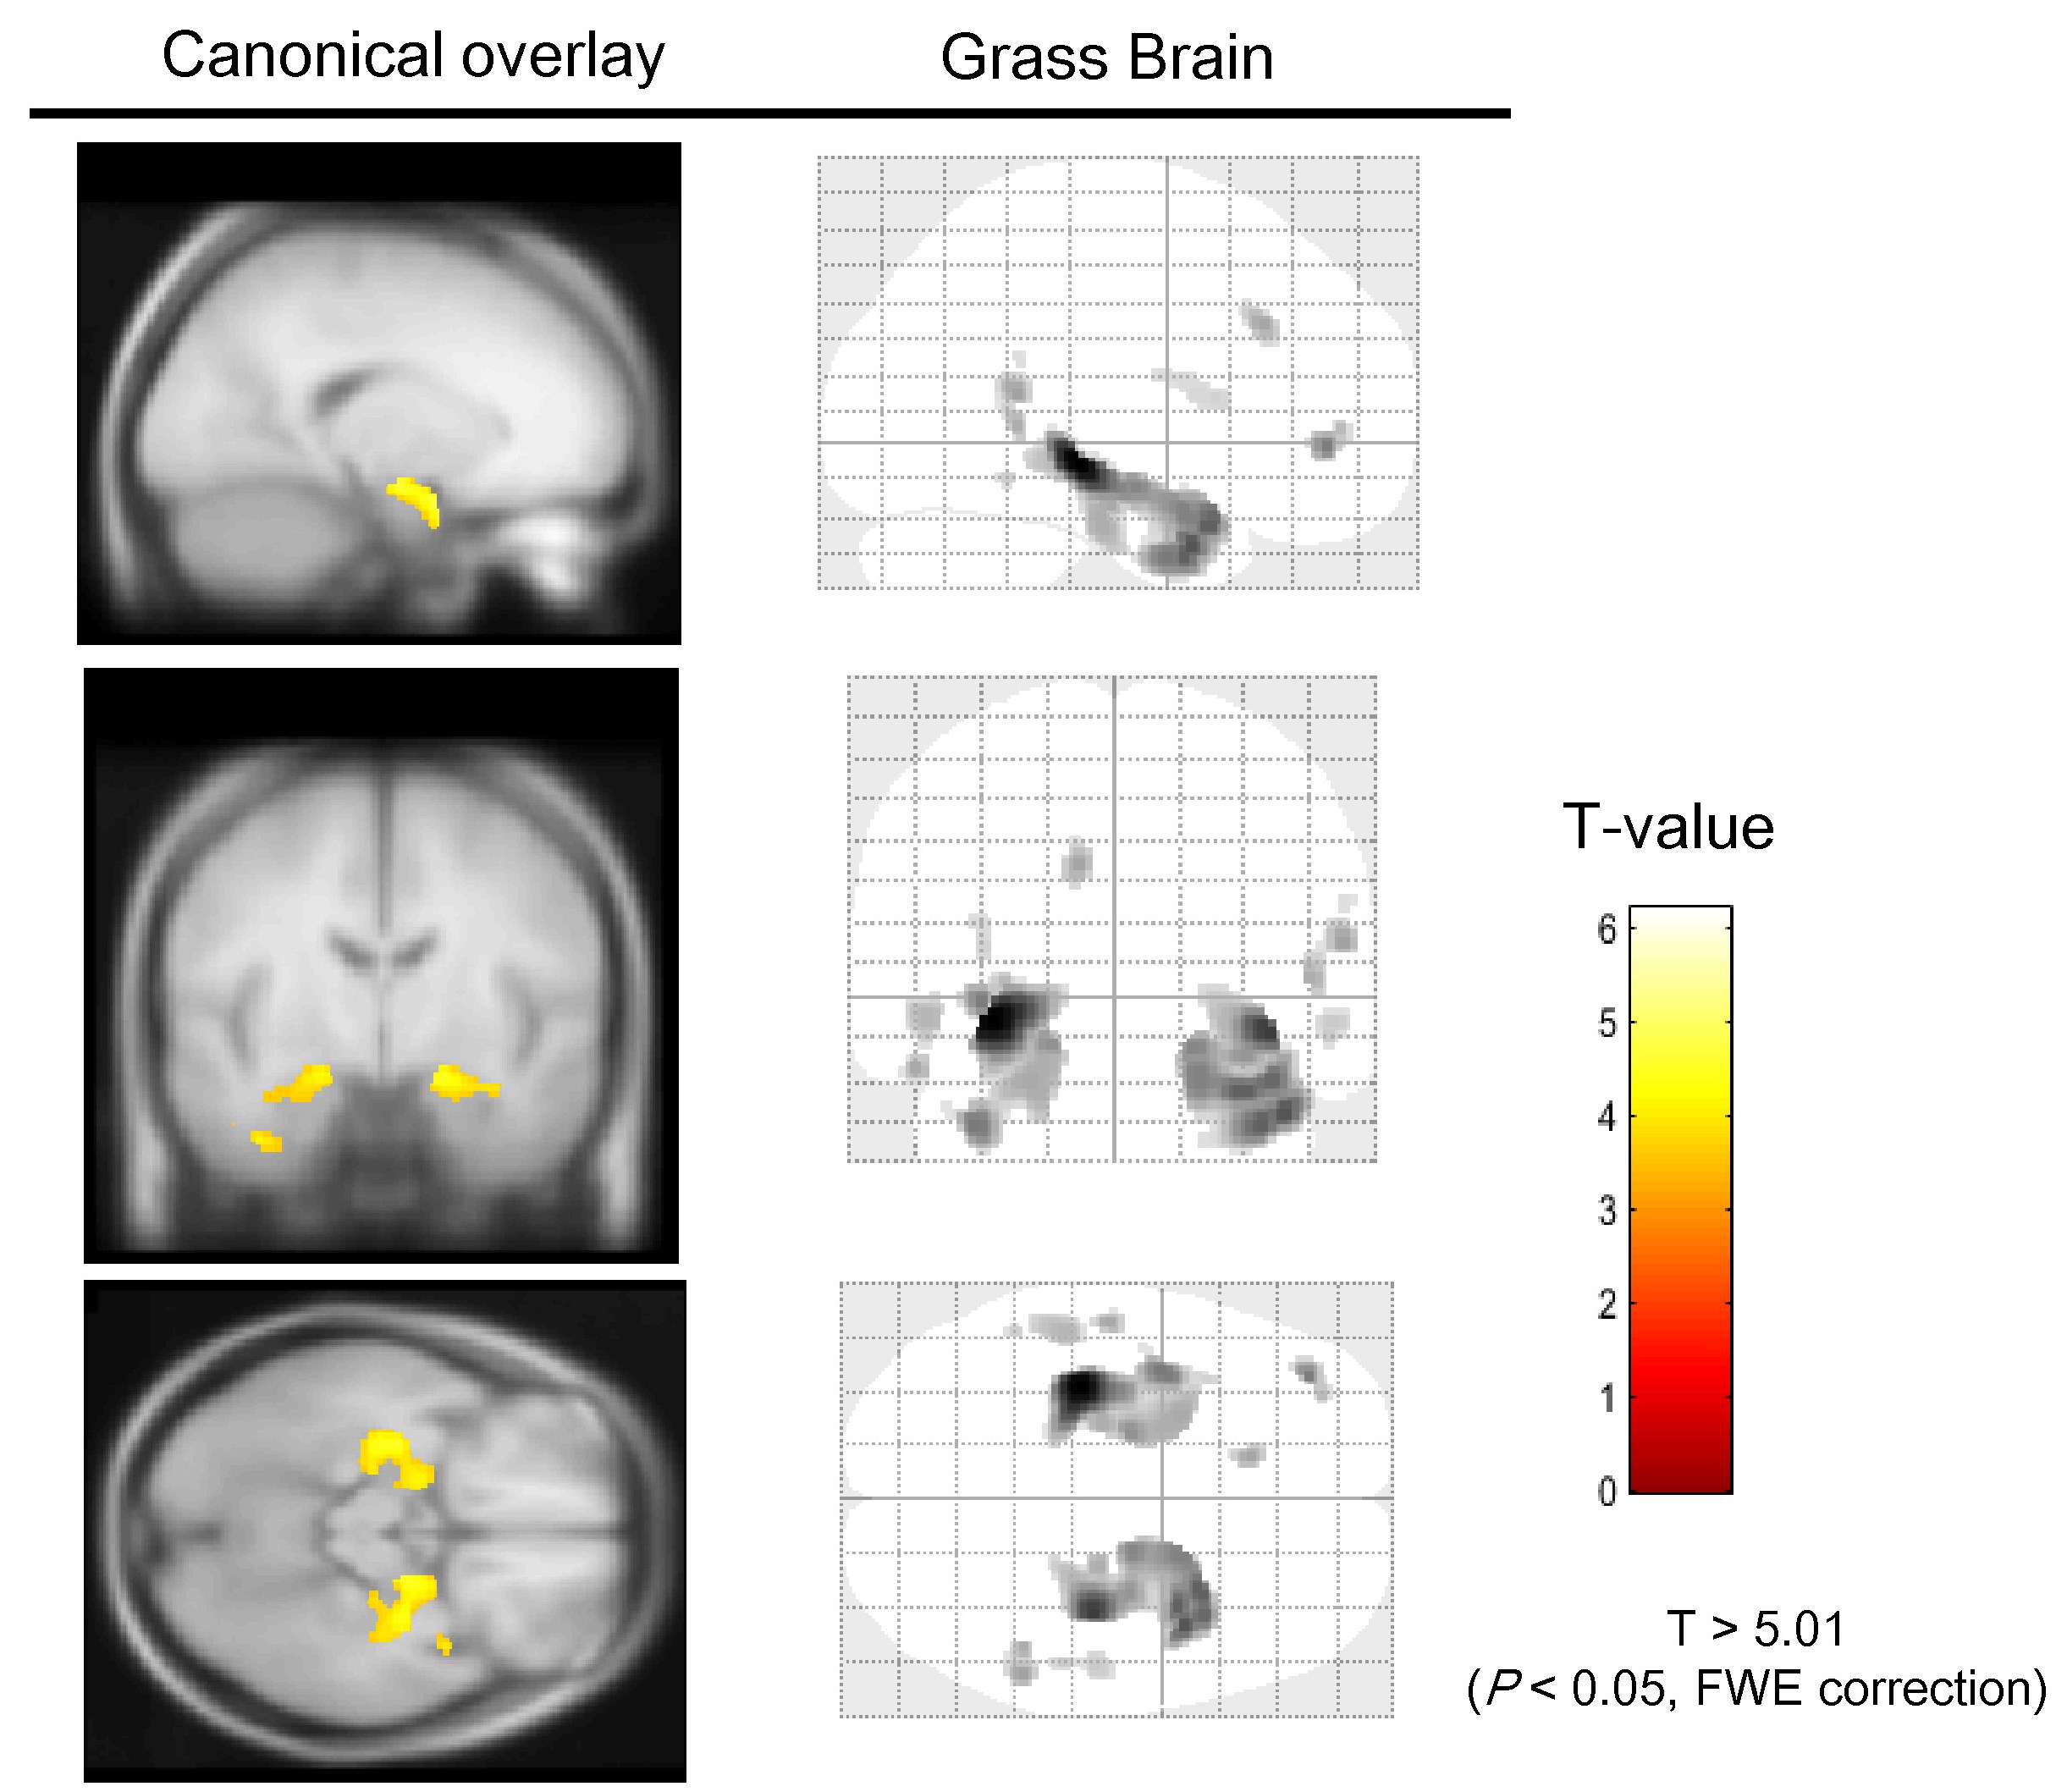
The susceptibility map reconstructed by e-iLSQR and segmented GM images were shown in Fig. 3. The novel dipole inversion was successful to reconstruct the susceptibility map while minimizing severe streaking artifact owing to the low SNR in CSF area by L2-regulariztation for CSF in Eq. 1. Moreover, the GM images were also correctly estimated from magnitude image of first echo with strong T1 contrast induced by inversion pulse in MP-QSM. Significant susceptibility increases in the AD group could be observed in the bilateral hippocampus and amygdala (Fig. 4). This result was explain by that the abnormal iron overload associated withβ-amyloid deposition in AD influenced the magnetic susceptibility2, 12. On the other hand, there were significant decreases in the volumes of the bilateral hippocampus, middle frontal gyrus, and temporal gyrus between the groups (Fig. 5). This abnormal GM atrophy is a characteristic feature in AD, in accordance with previous studies5, 6. These results might show that the VBMSM is adaptable to neurodegenerative diseases including AD.Conclusion
The proposed VBMSM analysis enables to simultaneously investigate regional changes of brain volume and susceptibility distribution without any image registration and might contribute to future studies of neurological and psychiatric disorders such as AD.
Acknowledgements
This work was supported by JSPS KAKENHI Grant Number JP17K15805.
References
1. O'Callaghan J, Holmes H, Powell N, et al. Tissue magnetic susceptibility mapping as a marker of tau pathology in Alzheimer's disease. Neuroimage. 2017; 159: 334-45.
2. Kim H-G, Park S, Rhee HY, et al. Quantitative susceptibility mapping to evaluate the early stage of Alzheimer's disease. NeuroImage: Clinical. 2017; 16: 429-38.
3. Guan X, Xuan M, Gu Q, et al. Regionally progressive accumulation of iron in Parkinson's disease as measured by quantitative susceptibility mapping. NMR Biomed. 2017; 30 (4): e3489.
4. Ayton S, Fazlollahi A, Bourgeat P, et al. Cerebral Quantitative Susceptibility Mapping Peredicts Amyloid-B-related Cognitive Decline. Brain. 2017; 140: 2112-9.
5. Henneman WJ, Sluimer JD, Barnes J, et al. Hippocampal atrophy rates in Alzheimer disease: added value over whole brain volume measures. Neurology. 2009; 72 (11): 999-1007.
6. Yamaguchi S, Meguro K, Itoh M, et al. Decreased cortical glucose metabolism correlates with hippocampal atrophy in Alzheimer's disease as shown by MRI and PET. J Neurol Neurosurg Psychiatry. 1997; 62 (6): 596-600.
7. Ashburner J. A fast diffeomorphic image registration algorithm. Neuroimage. 2007; 38 (1): 95-113.
8. Bagher-Ebadian H, Jiang Q, Ewing JR. A modified fourier-based phase unwrapping algorithm with an application to MRI venography. J Magn Reson Imaging. 2008; 27 (3): 649-52.
9. Wu B, Li W, Guidon A, et al. Whole brain susceptibility mapping using compressed sensing. Magn Reson Med. 2012; 67 (1): 137-47.
10. Li W, Wang N, Yu F, et al. A method for estimating and removing streaking artifacts in quantitative susceptibility mapping. Neuroimage. 2015; 108: 111-22.
11. Kan H, Arai N, Kasai H, et al., cartographers. Quantitative susceptibility mapping using principles of echo shifting with a train of observations sequence on 1.5T. Magn Reson Imaging. 2017; 42: 37-42.
12. van Bergen JMG, Li X, Quevenco FC, et al. Simultaneous quantitative susceptibility mapping and Flutemetamol-PET suggests local correlation of iron and beta-amyloid as an indicator of cognitive performance at high age. Neuroimage. 2018 in press.Figures
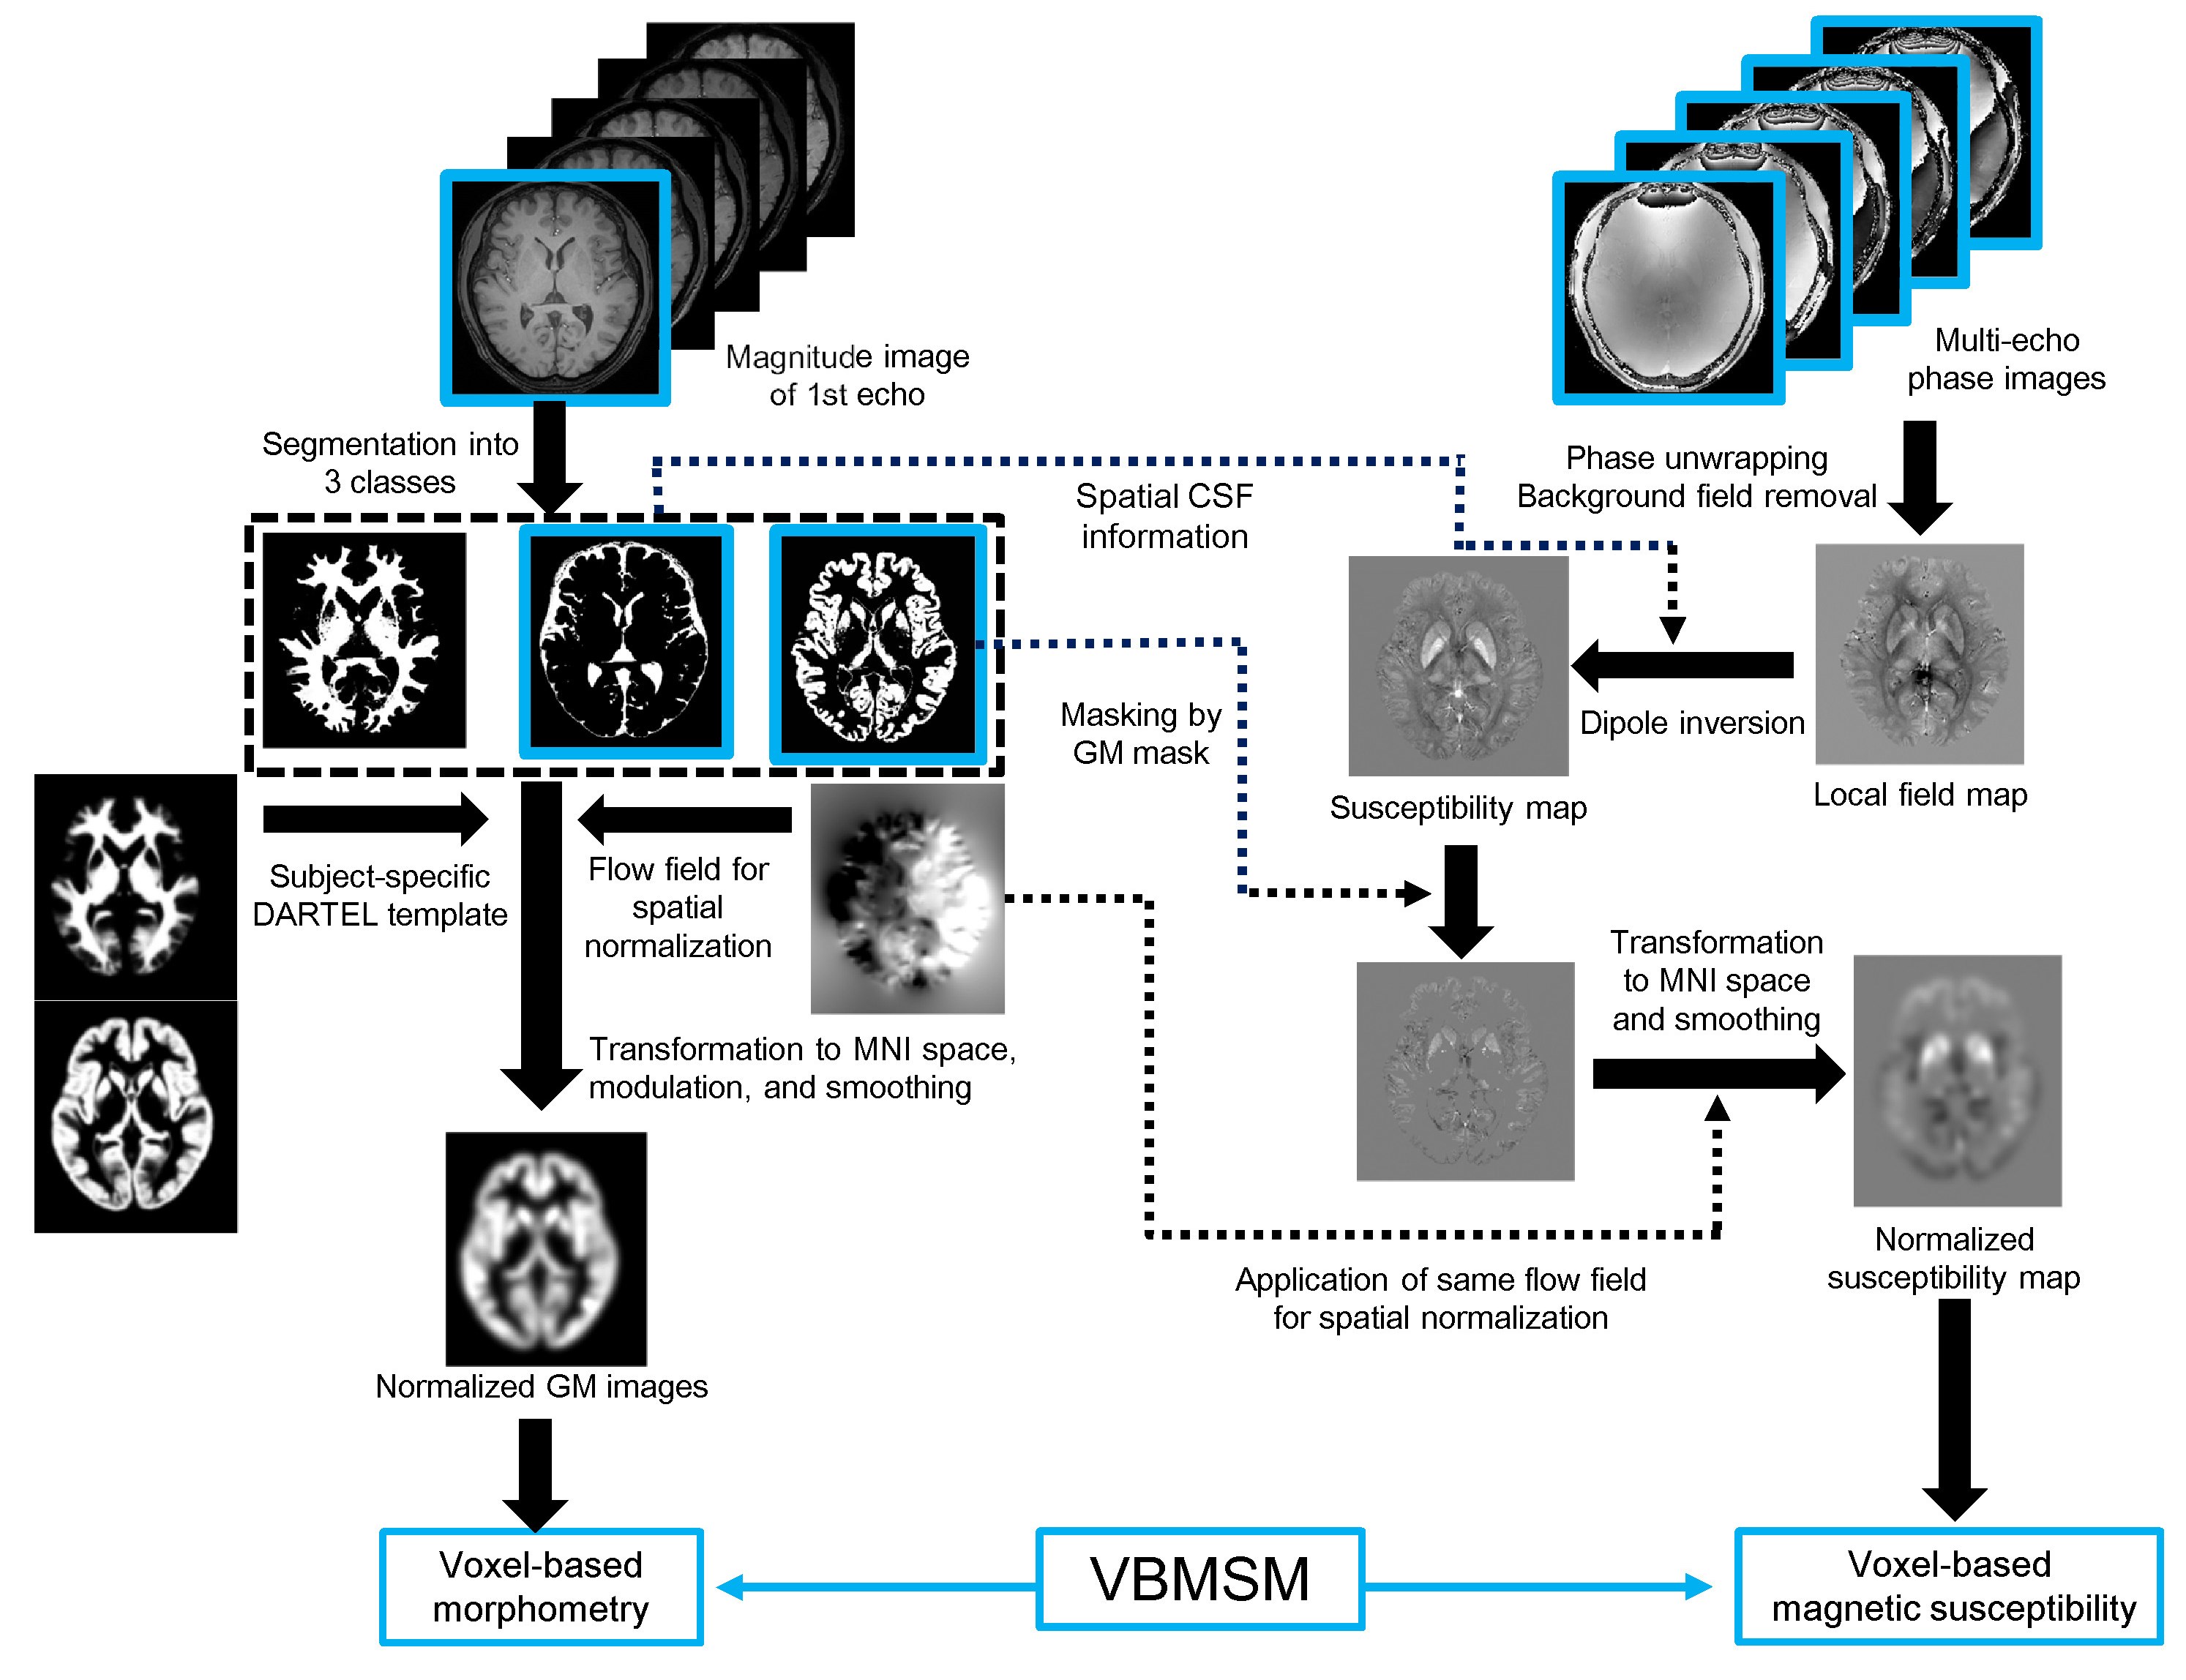
Fig. 1 Schematic flowchart of voxel-based magnetic susceptibility and morphometry (VBMSM). For voxel-based morphometry (VBM), the images segmented from the magnitude image of first echo are transformed to MNI space with volume modulation and spatial smoothing using subject-specific template. For voxel-based magnetic susceptibility, the local field map is estimated from multiple phase images by applications of phase unwrapping and background field removal. The susceptibility map was reconstructed by the extended iLSQR method using segmentation-based cerebrospinal fluid information. The susceptibility map is multiplied with binary gray matter mask. The resulted susceptibility map is normalized using the same transformation parameter for VBM.
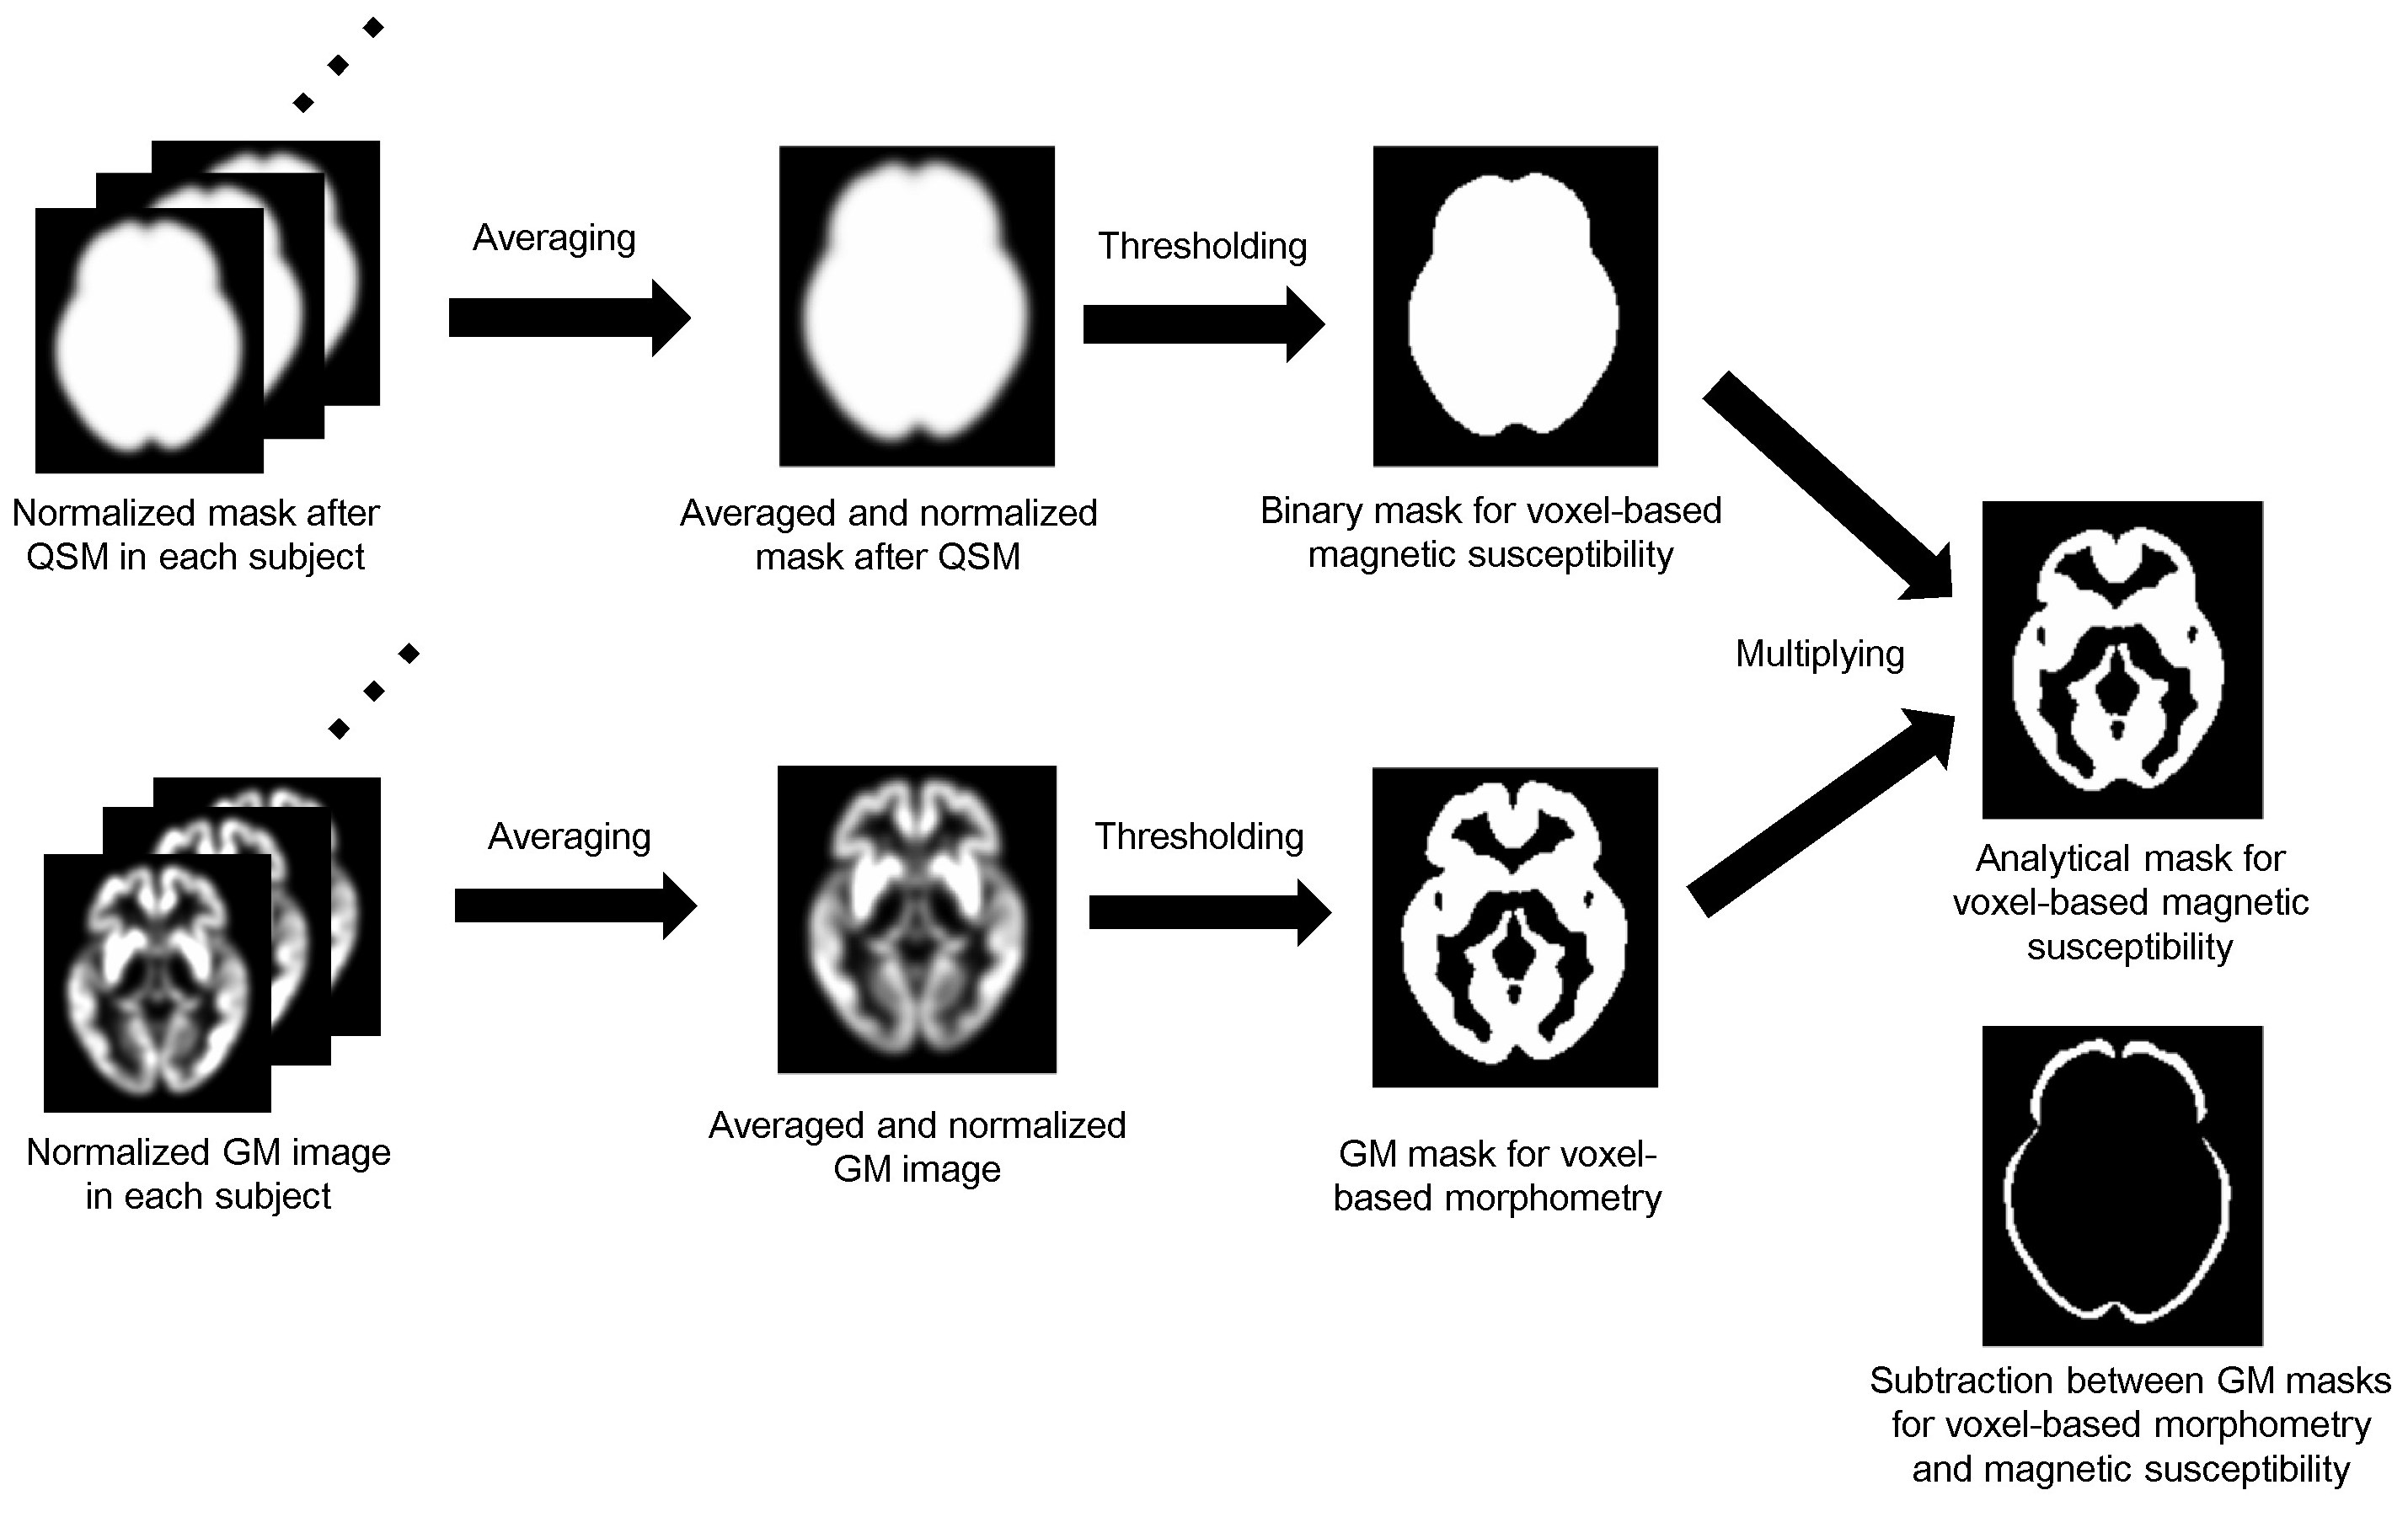
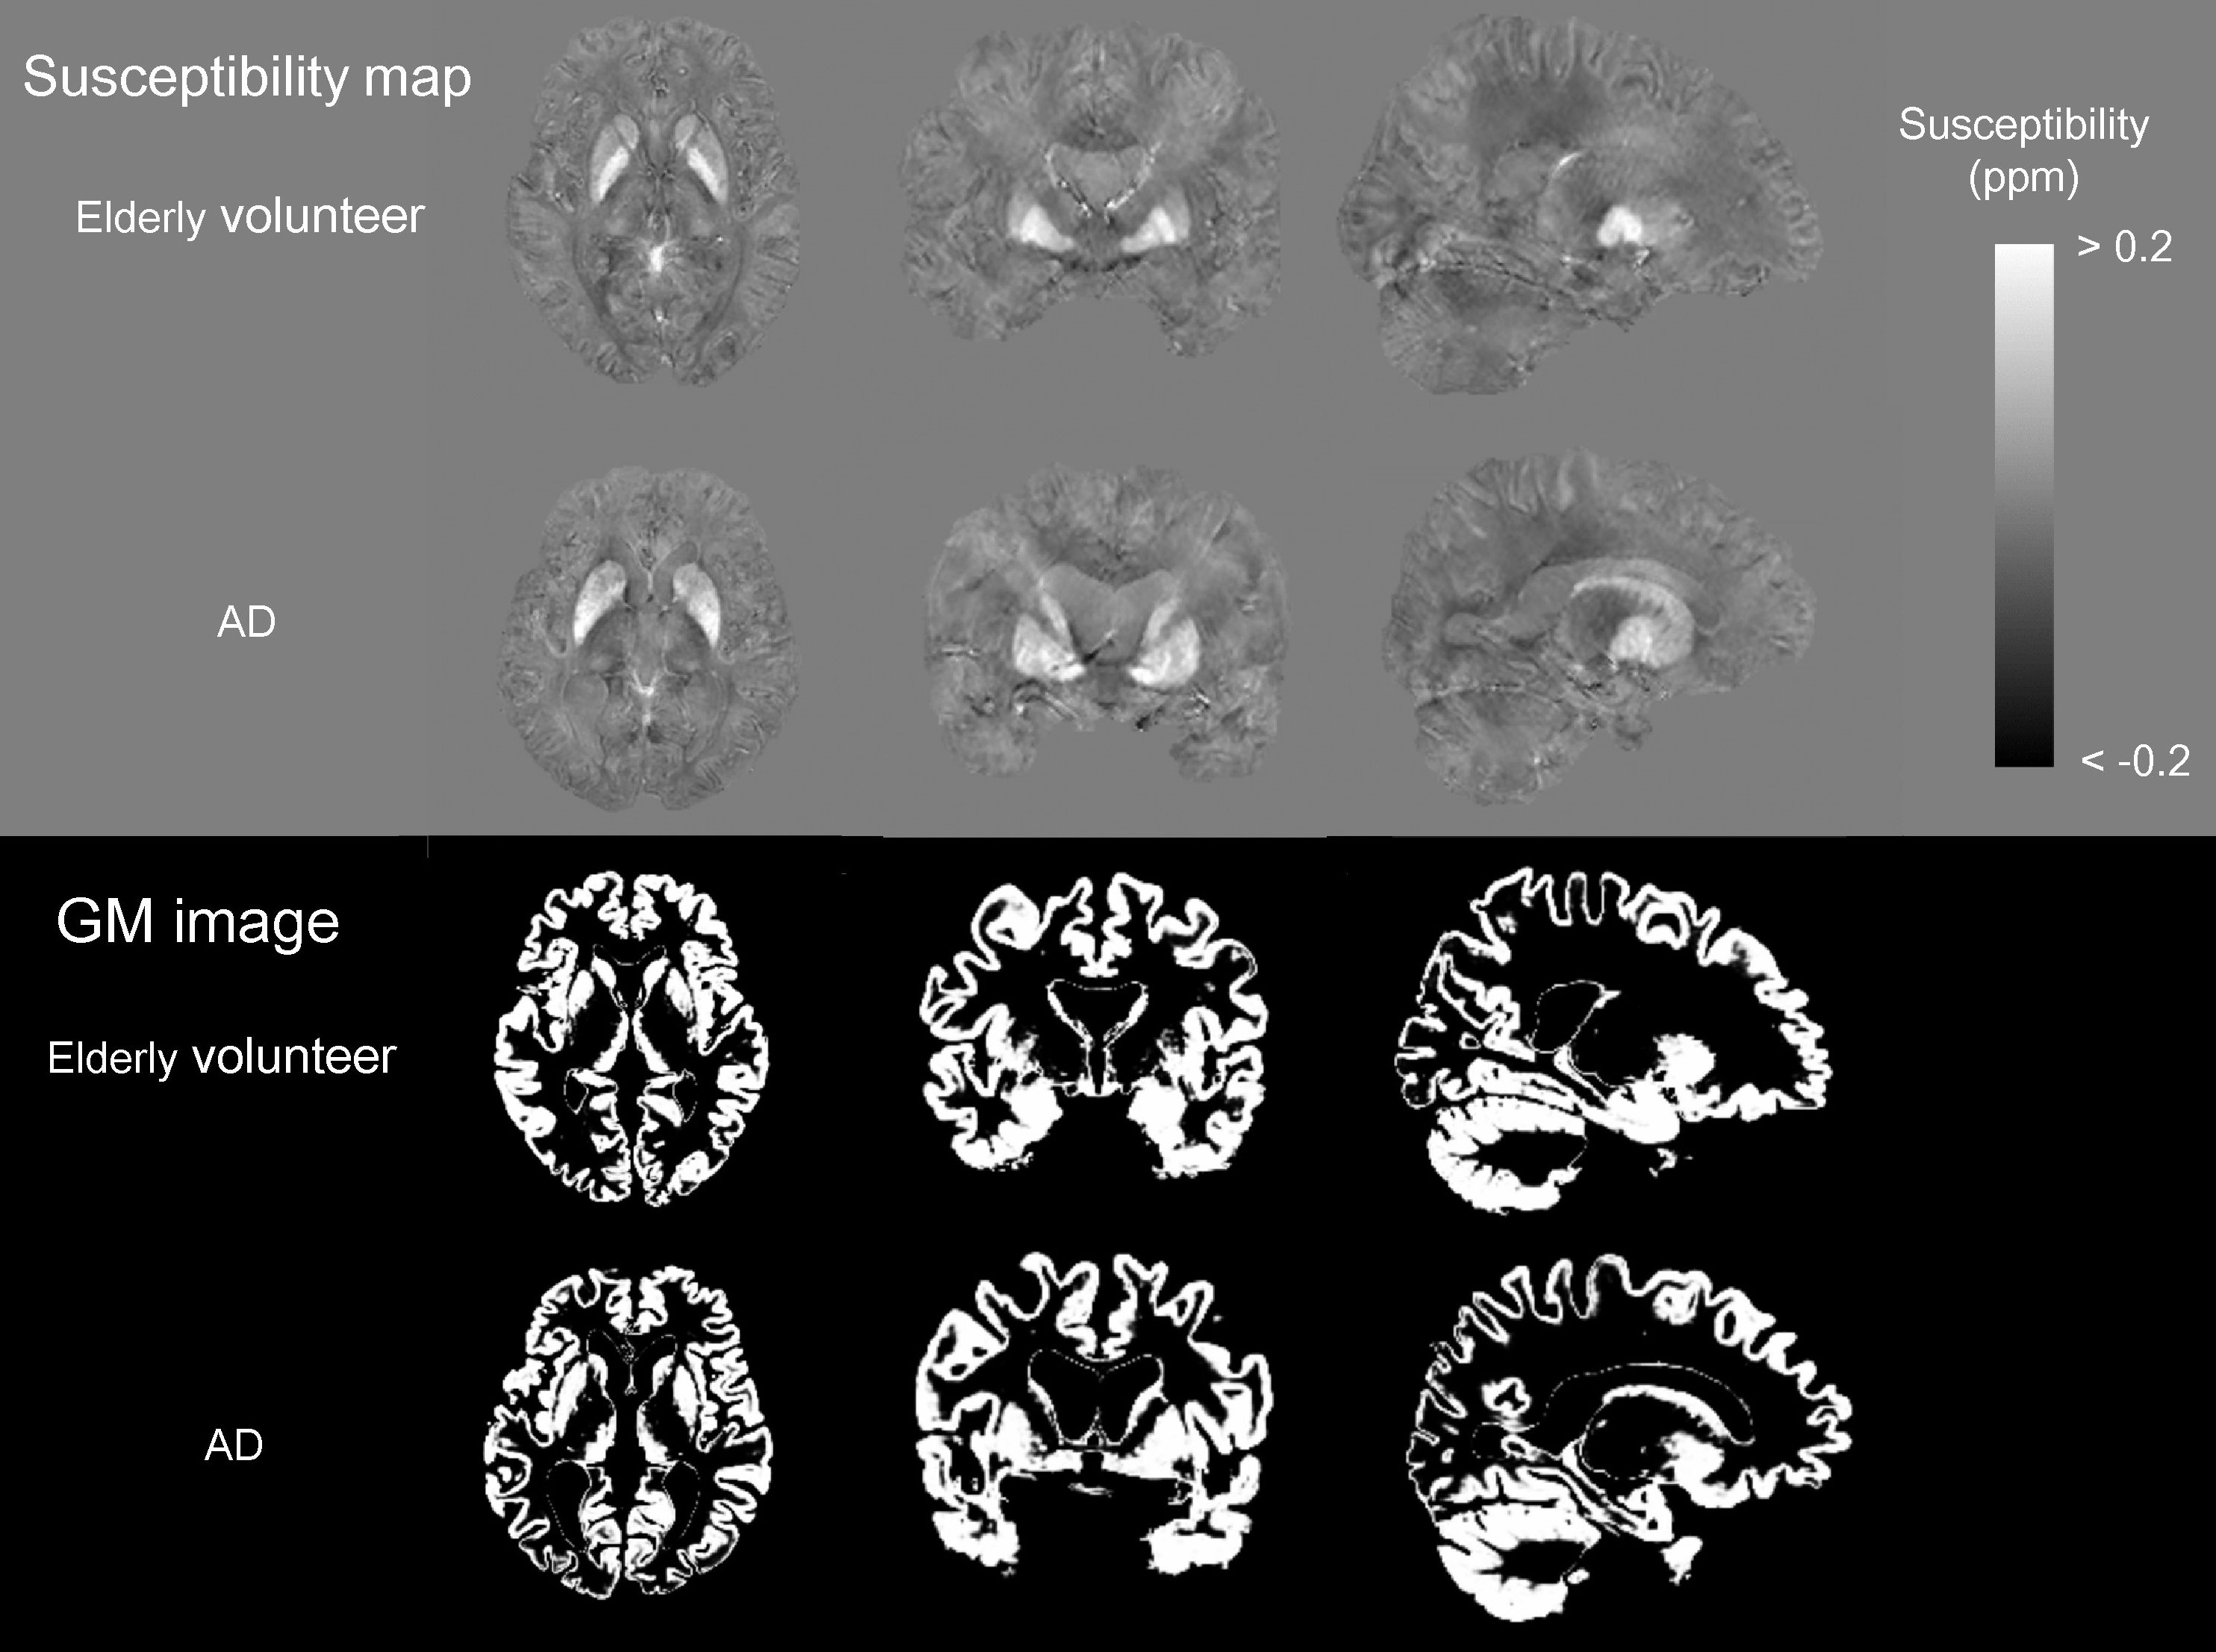
Fig. 3 Representative maps of susceptibility and gray matter volume segmented by SPM12 in an elderly healthy volunteer and a patient with Alzheimer’s disease. In the susceptibility map, the susceptibility inhomogeneity in cerebrospinal fluid area was improved by the extended iLSQR method. The volume images of the matter in each group were also estimated correctly.
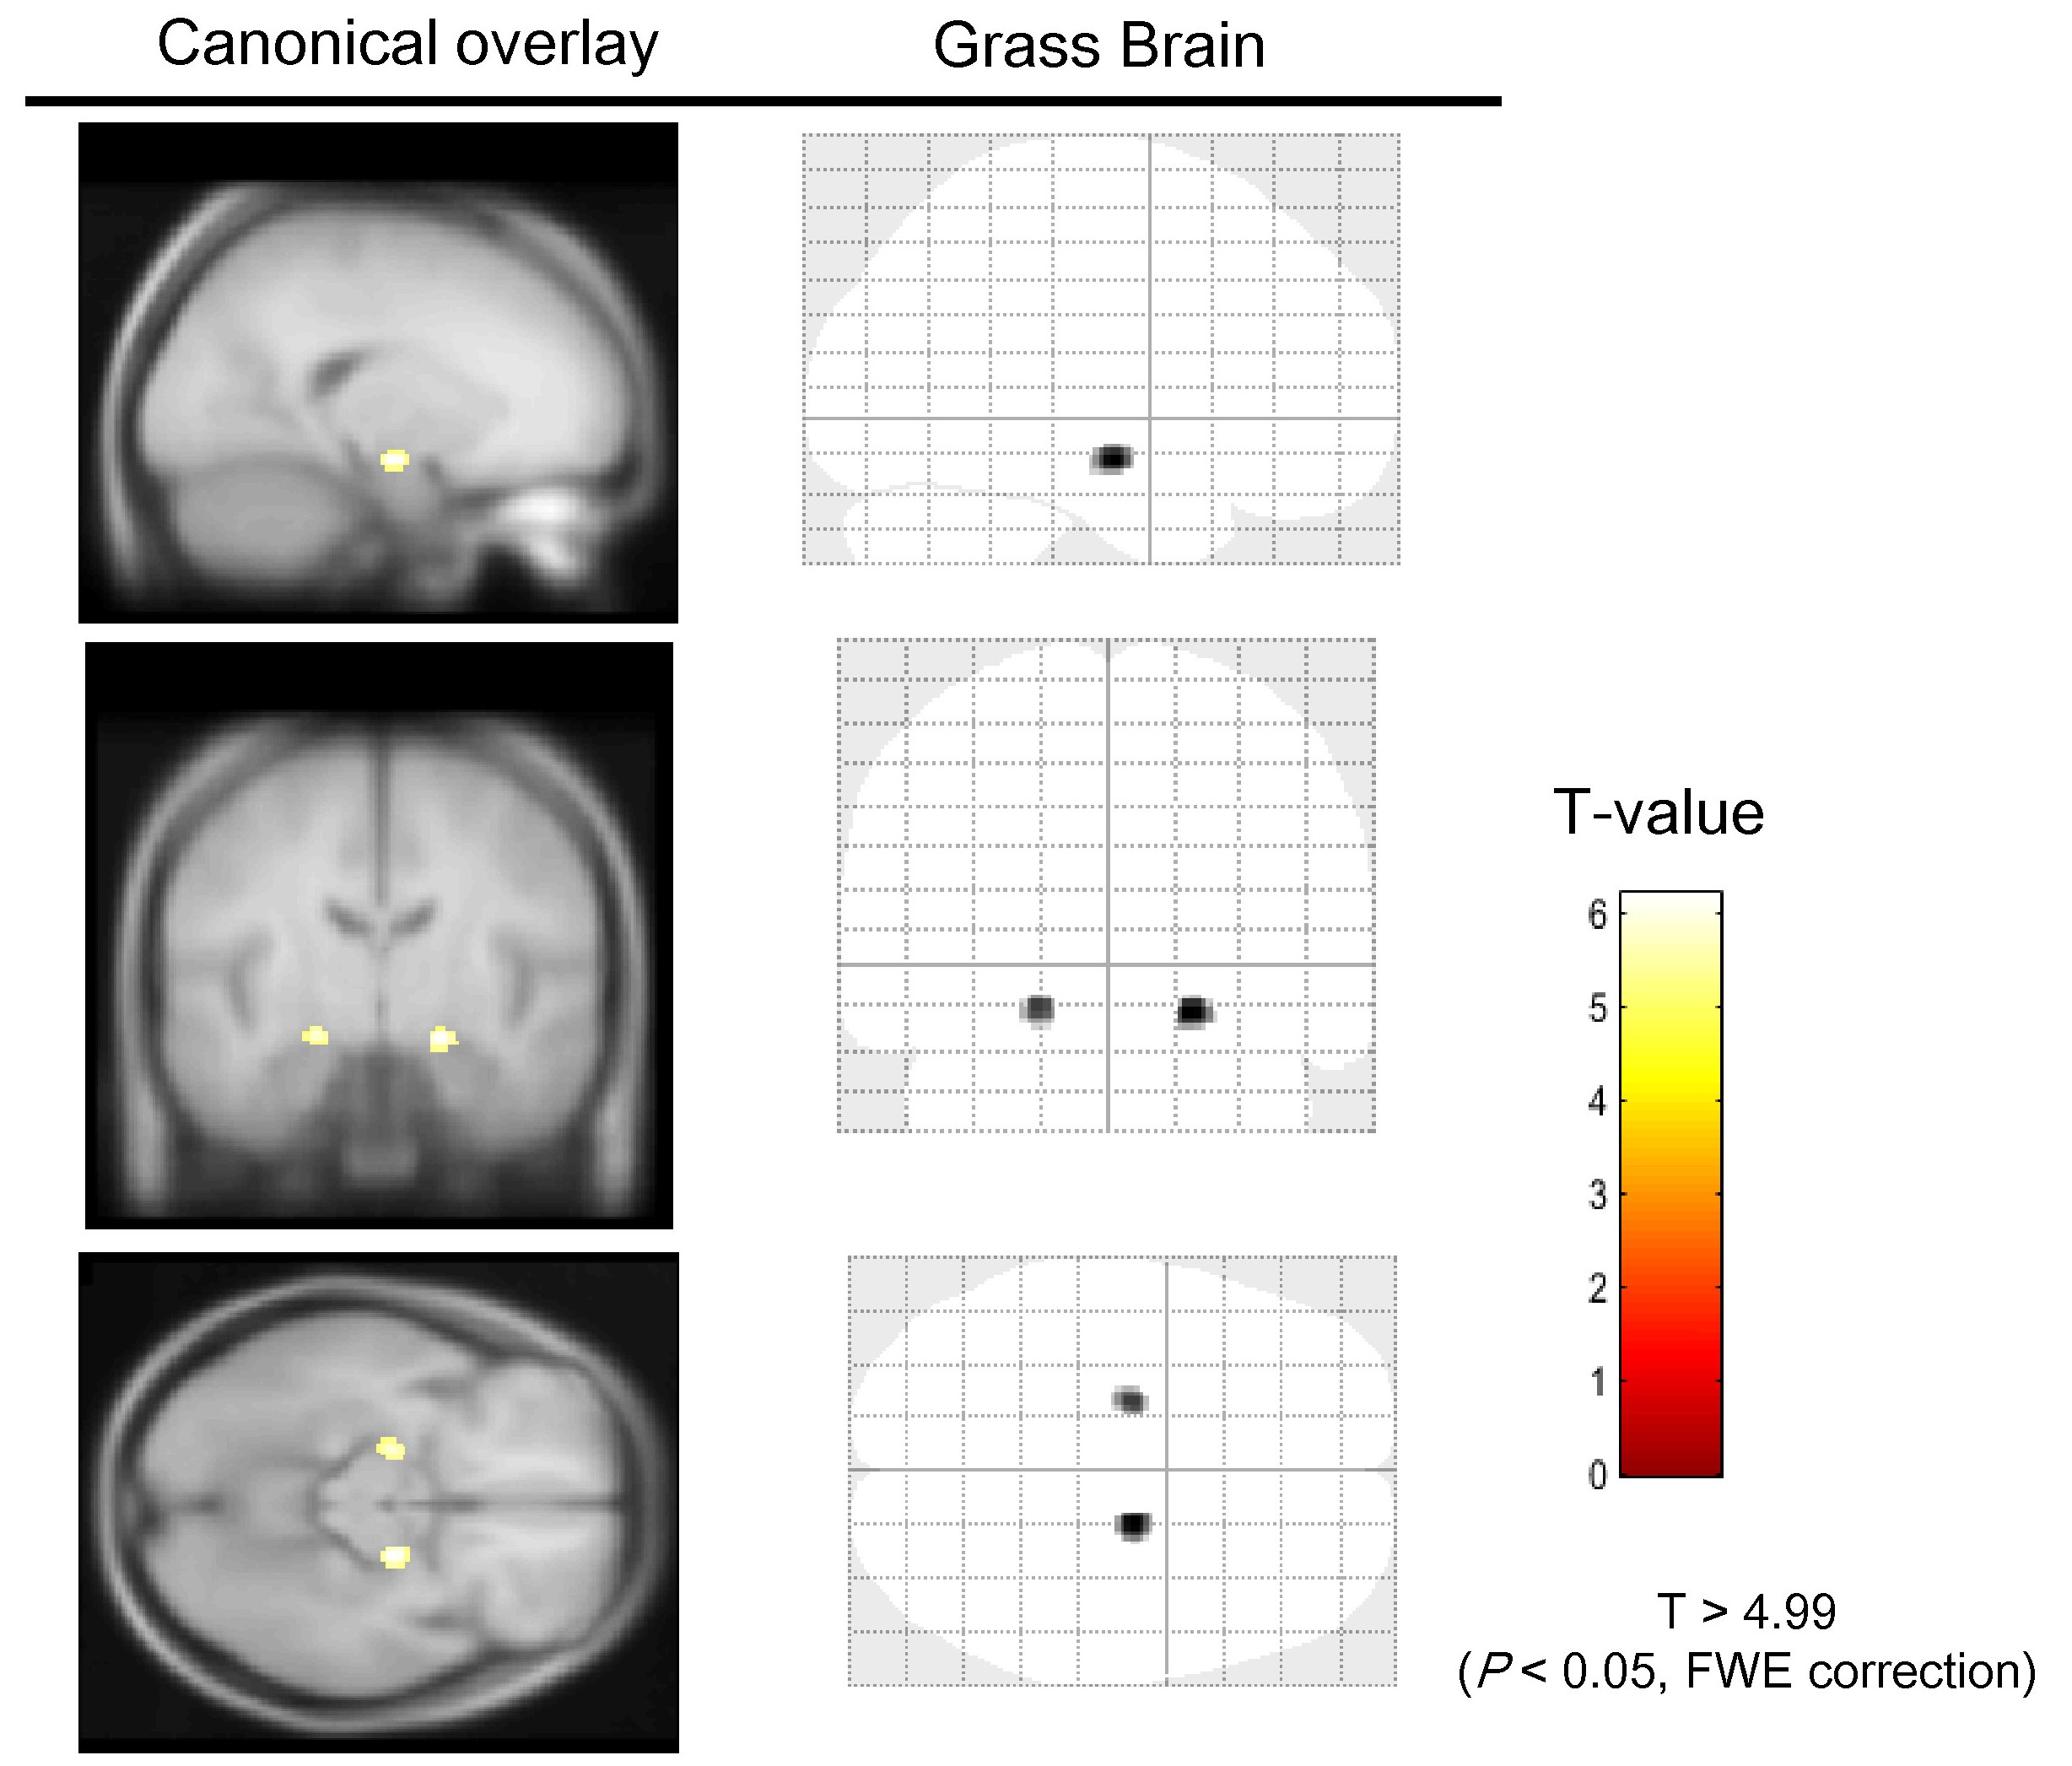
Fig. 4 Canonical overlay and grass brain showing significant susceptibility increases in the bilateral hippocampus and amygdala between elderly healthy volunteers and patients with AD.