2467
Test-retest reliability of resting-state brain small-world network properties across different data processing and modeling strategies1University of Science and Technology of China, Hefei, China, 2University of Pennsylvania, Philadelphia, PA, United States
Synopsis
Resting-state fMRI assessed with graph theoretical modeling provides a noninvasive approach for measuring brain network topological organization properties, yet their reproducibility remains uncertain. Here we examined the test-retest reliability of seven brain small-world network metrics from well-controlled resting-state scans of 16 healthy adults using different data processing and modeling strategies. Among the seven network metrics, Lambda exhibited highest reliability whereas Sigma performed the worst. Weighted network metrics provided better reliability than binary network metrics, while reliability from the AAL90 atlas outweighed those from the Power264 parcellation. Global signal regression had no consistent effect on reliability of these network metrics.
Introduction
Accumulating evidence suggests that the human brain is organized as a small-world network to balance the network wiring cost and information processing efficiency1. Resting-state fMRI (RS-fMRI) assessed with graph theoretical modeling provides a noninvasive approach for measuring brain small-world network topological organization properties2,3. However, there are a range of different strategies used in the processing and modeling of resting-state BOLD fMRI data, such as how to define the ‘nodes’ and ‘edges’ of network using different brain parcellation atlas and network density thresholds, how to model the network using a binary or weighted approach, and whether to include global signal regression (GSR)2-8. For studies using graphical metrics as biomarkers for brain function, assessing test-retest reliability provides a means for comparing processing strategies. In this study, we examined test-retest reliabilities of brain small-world network metrics using resting-state fMRI scans from a well-controlled in-laboratory study under different data processing and modeling strategies.Methods
Data from 16 healthy adults (8 males, mean age =35 years) in the control group of a 5-day and 4-night strictly controlled in-laboratory sleep study are included in the analyses. Using a Siemens 3T Trio scanner, resting-state BOLD data were acquired on the morning (0700-1000) of days 2, 3 and 5. Imaging data were preprocessed using SPM8 and graph analysis were conducted using GRETNA toolbox3. Undirected networks were constructed based on the AAL90 or the Power264 atlases for brain parcellation, using 5 different network density levels (0.15, 0.20, 0.25, 0.30, and 0.35), modeled in a binary or weighted network, and with or without GSR. Seven typical brain small-world network metrics were calculated, including the absolute clustering coefficients (Cp), normalized clustering coefficients (Gamma), shortest path length (Lp), normalized characteristic path length (Lambda), global efficiency (Eglobal), local efficiency (Elocal), and small-worldness (Sigma). Test-retest reliabilities were measured by the intraclass correlation coefficient (ICC).Results
Fig.1 displays the ICC values for all 7 network metrics across different data processing and modeling strategies. In general, most brain network metrics exhibited poor to fair reliability under all strategies, with the poorest reliability for Sigma (mean ICC = 0.19 ± 0.07). The highest reliability across all density levels was found for the Lambda (mean ICC = 0.71 ± 0.002), using the AAL90 atlas, weighted network modeling, and including GSR. Neither change of network density level nor inclusion of GSR had a consistent effect on the ICC values (both p>0.05). However, the reliability of weighted network metrics was significantly higher than that of binary network metrics (p<0.05), and the use of the AAL90 atlas for brain parcellation provided higher ICC values than the use of the Power264 atlas (p<0.001, Fig.2).Conclusion
This study provides quantitative evidence on how RS-fMRI data processing and modeling strategies affect the reliability of brain small-world network metrics. Consistent with previous studies 7,8, our results suggest that Lambda is the most reliable brain network metric whereas Sigma has the poorest reliability as a second order metric, and weighted network may reserve more information and exhibit better reproducibility than binary network.Acknowledgements
This research was supported in part by NIH grants R01-HL102119, R01-MH107571, CTRC UL1RR024134, and P30-NS045839.References
1. Bullmore, E. and O. Sporns, The economy of brain network organization. Nat Rev Neurosci, 2012. 13(5): p. 336-49.
2. Medaglia, J.D., Graph Theoretic Analysis of Resting State Functional MR Imaging. Neuroimaging Clin N Am, 2017. 27(4): p. 593-607.
3. Wang, J., et al., GRETNA: a graph theoretical network analysis toolbox for imaging connectomics. Front Hum Neurosci, 2015. 9: p. 386.
4. Murphy, K., et al., The impact of global signal regression on resting state correlations: are anti-correlated networks introduced? Neuroimage, 2009. 44(3): p. 893-905.
5. Braun, U., et al., Test-retest reliability of resting-state connectivity network characteristics using fMRI and graph theoretical measures. Neuroimage, 2012. 59(2): p. 1404-12.
6. Wang, J., et al., Parcellation-dependent small-world brain functional networks: a resting-state fMRI study. Hum Brain Mapp, 2009. 30(5): p. 1511-23.
7. Wang, J.H., et al., Graph theoretical analysis of functional brain networks: test-retest evaluation on short- and long-term resting-state functional MRI data. PLoS One, 2011. 6(7): p. e21976.
8. Rubinov, M. and O. Sporns, Complex network measures of brain connectivity: uses and interpretations. Neuroimage, 2010. 52(3): p. 1059-69.
Figures
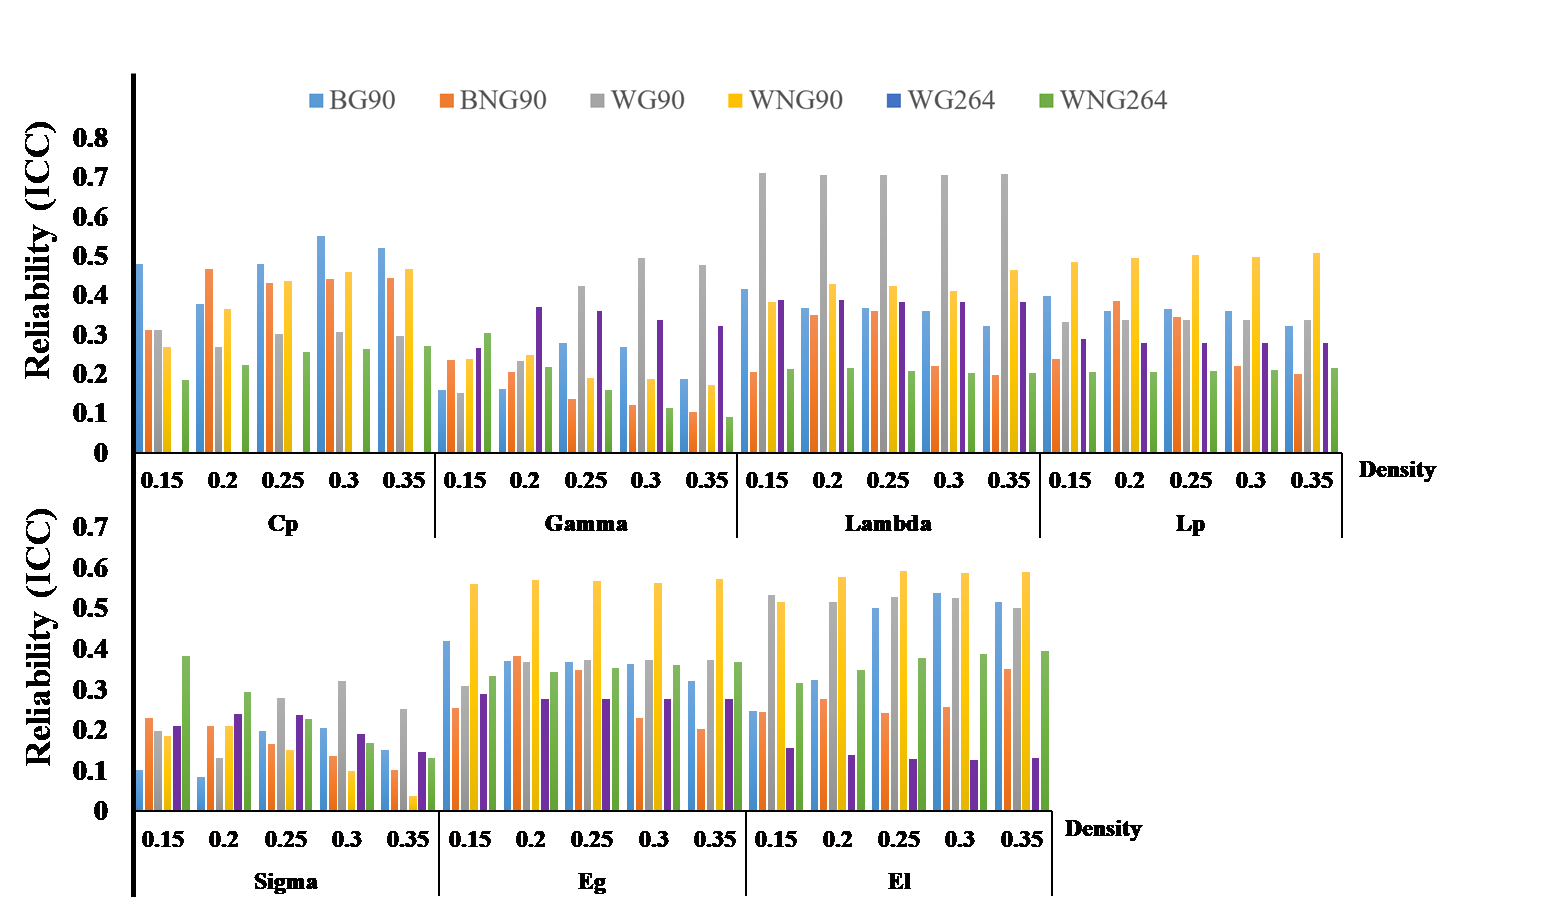
Fig.1 ICC values of seven metrics under six methods. Lambda showed high ICCs using WG90 method. BG90: binary + global signal regression + AAL90, BNG90: binary + no global signal regression + AAL90, WG90: weighted + global signal regression + AAL90, WNG90: weighted + no global signal regression +AAL90, WG264: weighted + global signal regression + POWER264, WNG264: weighted + no global signal regression + POWER264
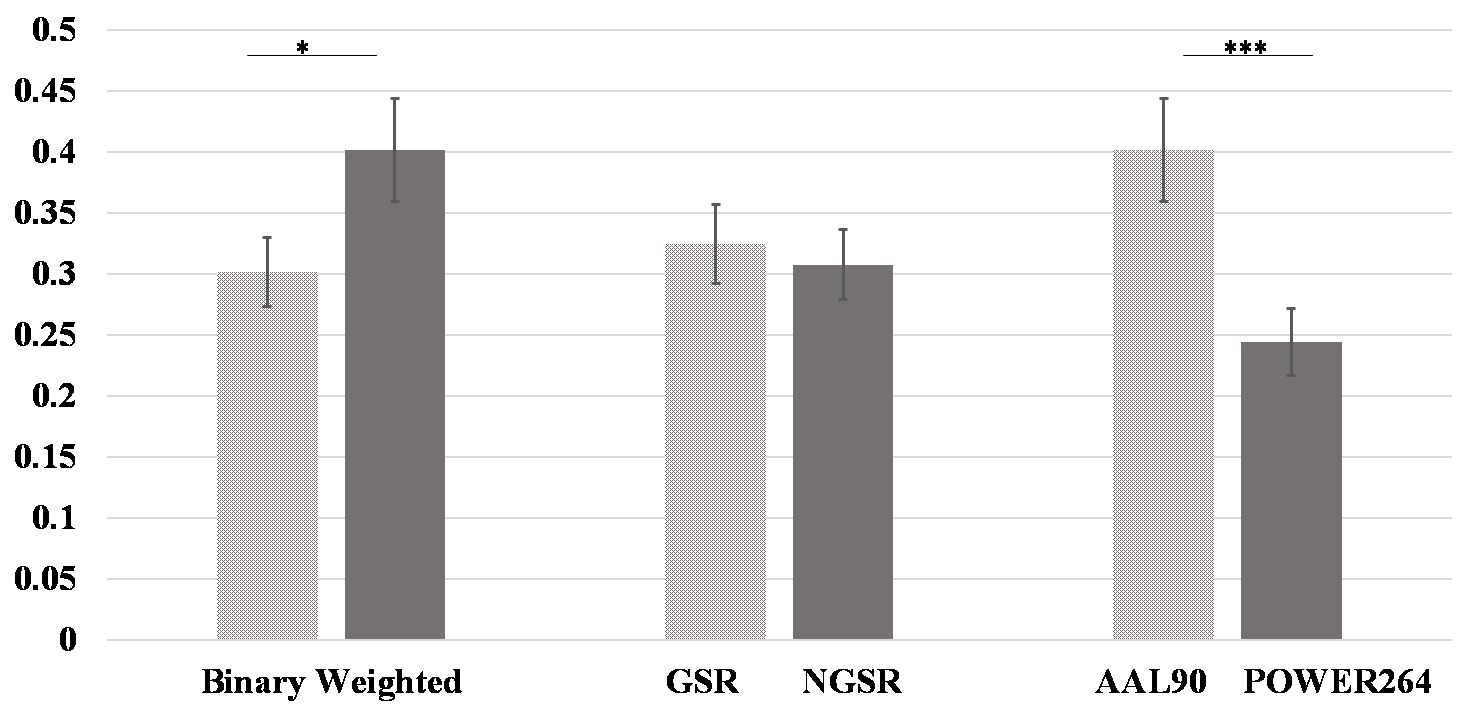
Fig.2 Comparisons among three sets of methods. Weighted networks yielded significantly higher ICCs than Binary networks, AAL90 yielded significantly higher ICCS than POWER264. *: p<0.05, **: p<0.01, ***: p<0.001