2466
Signal intensity form of Tofts model for quantitative analysis of dynamic contrast enhanced MRI data1Radiology, University of Chicago, Chicago, IL, United States
Synopsis
The Tofts pharmacokinetic model
requires contrast agent concentration as function of time (C(t)), which is normally
calculated using the non-linear model that could contribute some errors. Here,
we present signal intensity (S(t)) form of standard Tofts pharmacokinetic model
without calculating C(t). Human prostate DCE-MRI data were analyzed to compare
physiological parameters calculated from the Tofts model using S(t) and C(t).
The Ktrans and ve calculated from S(t) were correlated
strongly with the values calculated from C(t). Bland–Altman
analysis showed moderate to good agreement between for the Ktrans
and ve calculated from Tofts model with S(t) and C(t).
INTRODUCTION
It is important to quantitatively analyze dynamic contrast enhanced (DCE) MRI in detection and diagnosis of cancers. The standard and extended Tofts models 1,2 are the most common pharmacokinetic models used to extract physiological parameters (Ktrans and ve). However, use of pharmacokinetic models requires calculation of contrast agent concentration in tissue as a function of time (C(t)) based on T1-weighted signal intensity (S(t)). There are several ways to calculate C(t), including: (i) using the gradient echo signal equation (non-linear model) with pre-contrast tissue T1 values;3 and (ii) using the ‘reference tissue’ model under a simple linear approximation.4 Theoretically speaking, the C(t) calculated from the non-linear model is more accurate than the ‘reference tissue’ model, but its precision is strongly influenced by the native T1 values. Measurements of pre-contrast tissue T1 values also contribute some error to calculations of C(t) using non-linear model.
In this study, the standard Tofts model with signal intensity was developed without using C(t). The physiological parameters calculated from the standard Tofts model using S(t) were compared with results obtained using C(t) for human prostate DCE-MRI data.
THEORY and METHODS
Based on the standard Tofts model of DCE-MRI, changes of C(t) in tissue following bolus contrast agent injection is given by:
$$C(t) =K^{trans}\int_{0}^{t}C_{p}(\tau)\exp\left(-(t-\tau)K^{trans}/v_e\right)d\tau,-----[1]$$
where Ktrans is the volume transfer constant between blood plasma and extravascular extracellular space (EES), ve is the volume of EES per unit volume of tissue, Cp(t)=Cb(t)/(1-Hct) is the arterial input function (AIF), Cb(t) is contrast agent concentration in blood, and Hct is the hematocrit (=0.42).
Using the ‘reference tissue’ model, C(t) can be approximated from the signal intensity S(t) when a reference tissue with a known native T1 (T1ref) is available, i.e.,
$$C(t) =\frac{1}{r_{1}\cdot{T1_{ref}}}\frac{S(t)-S(0)}{S_{ref}(0)},-----[2]$$
where r1 is the longitudinal relaxivity of the contrast agent, and S(0) and Sref(0) are the tissue and reference tissue signal intensities before contrast agent injection, respectively. Combining Eq. [1] and Eq. [2], the following formula can be obtained:
$$S_{r}(t) =\frac{S_{b}(0)}{(1-Hct)\cdot{S(0)}}K^{trans}\int_{0}^{t}S_{rb}(\tau)\exp\left(-(t-\tau)K^{trans}/v_e\right)d\tau,-----[3]$$
where Sb(t) is signal intensity in blood, $$$S_{r}(t) =\frac{S(t)-S(0)}{S(0)}$$$ and $$$S_{rb}(t) =\frac{S_b(t)-S_b(0)}{S_b(0)}$$$.
Eighteen patients with biopsy-confirmed prostate cancer were included in this IRB-approved study (mean age=60 years old). MRI data were acquired on a Philips Achieva 3T-TX scanner. After T2-weighted and diffusion-weighted imaging, baseline T1 mapping was performed with variable flip angles. Subsequently, DCE 3D T1-FFE data were acquired pre- and post-contrast media injection (0.1 mmol/kg DOTAREM; TR/TE = 3.5/1.0 ms, FOV = 180×180 mm2, matrix size = 160×160, flip angle = 10°, slice thickness = 3 mm, typical number of slices = 24, SENSE factor = 3.5, half scan factor = 0.625) for 150 dynamic scans with typical temporal resolution of 2.2 sec/image (1.0-4.3 sec).
Regions-of-interest (ROIs) for prostate cancer, normal tissue in different prostate zones and gluteal muscle were drawn on T2W images and transferred to DCE images. ROI’s for blood vessels were manually traced on the iliac artery on a slice with cancer. For each ROI, the average S(t) was calculated, and then C(t) was calculated from the non-linear model using the gradient echo signal equation.3
Pearson’s correlation coefficient
was calculated between physiological parameters (Ktrans and ve)
obtained from C(t) and S(t). Bland-Altman analysis was performed to evaluate
the agreement of two methods calculated physiological parameters. A p-value
less than 0.05 was considered statistically significant.
RESULTS
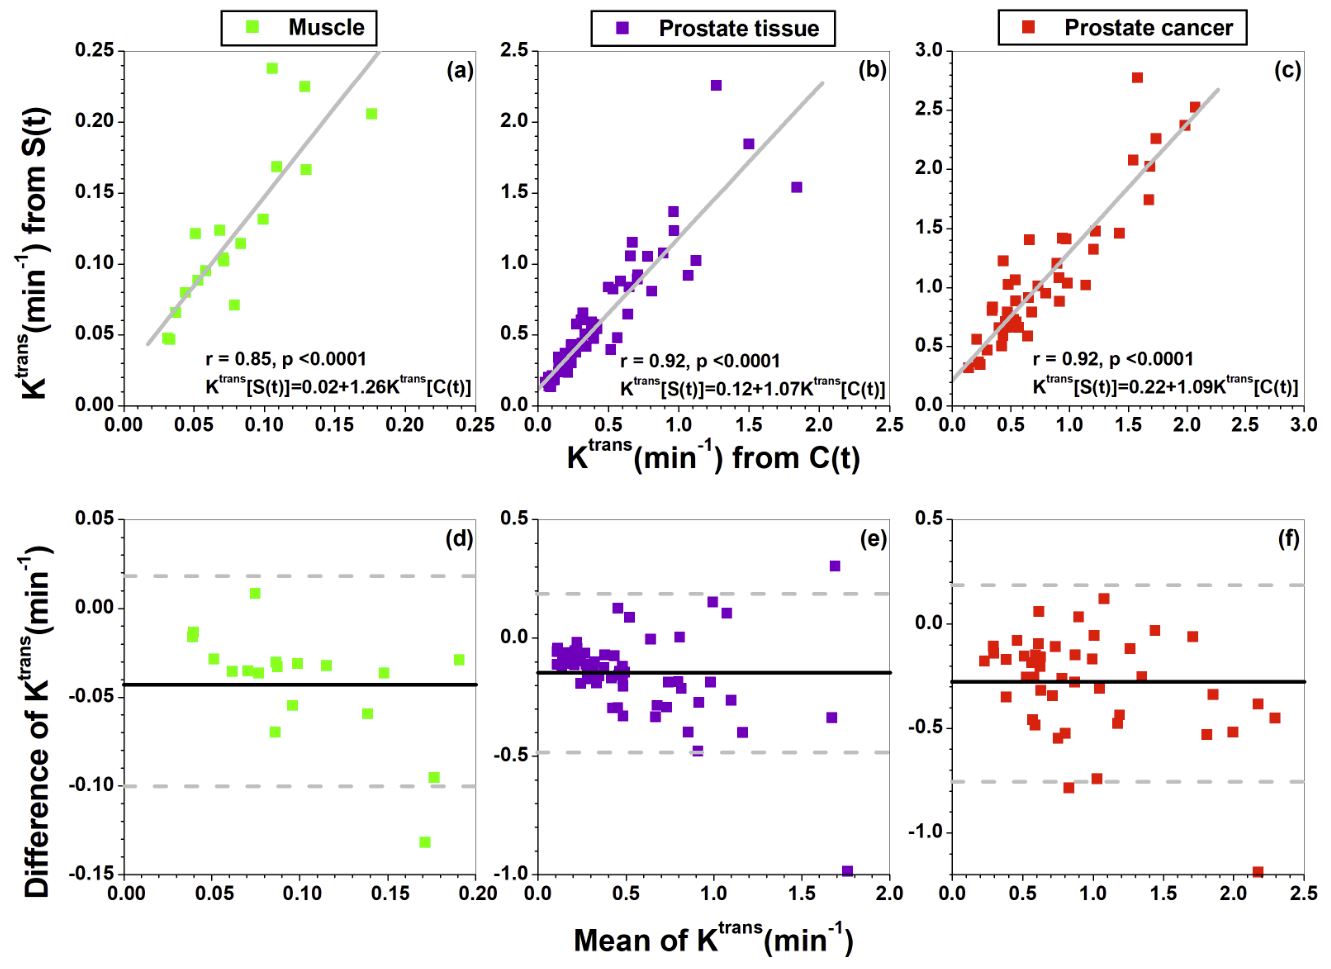
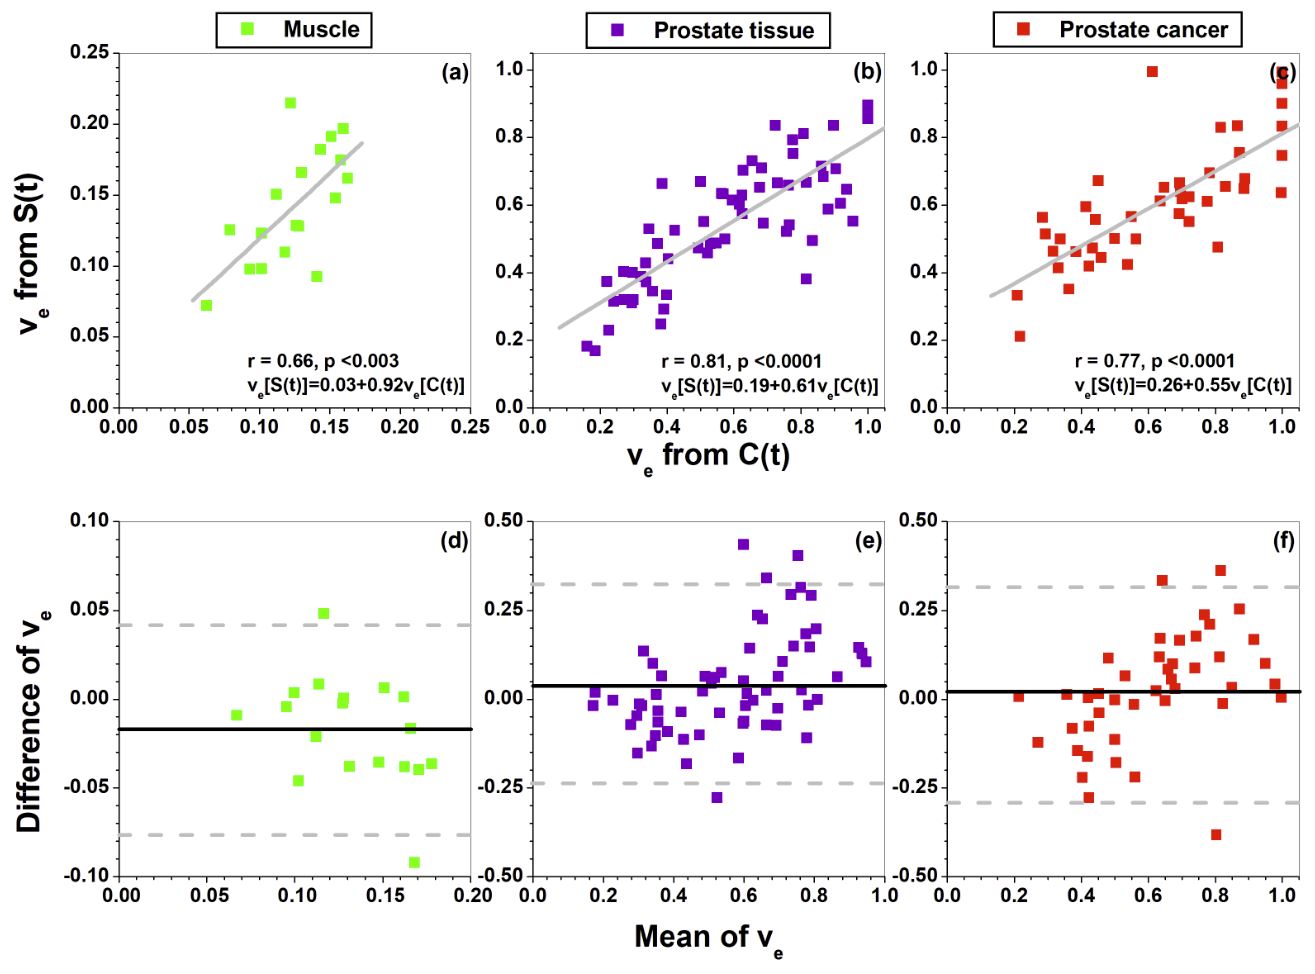
Figure 1 (a-c) shows the scatter plots of calculated Ktrans from C(t) (Eq.[1]) vs. from S(t) (Eq. [3]) for (a) muscle, (b) prostate tissue, and (c) prostate cancer ROIs. There was strong (r=0.85 to 0.92, p<0.0001) correlation between Ktrans measured using the two methods. There was moderate correlation between ve calculated using the two methods (r=0.66 to 0.81, p<0.003) (Figure 2 (a-c)). The corresponding Bland–Altman plots (Figures 1-2 (d-f)) show moderate to good agreements between physiological parameters calculated from C(t) and S(t).DISCUSSION
DCE-MRI data from human prostates was used to validate the Tofts model with S(t) for estimation of physiological parameters. Overall correlation between physiological parameters (Ktrans and ve) calculated from C(t) and S(t) was good. On average, the Ktrans calculated from S(t) was about 30% larger than calculated from C(t). The concept used here can be easily applied to the extended Tofts model including estimation of fractional plasma volume vp, such as:
$$S_{r}(t) =\frac{S_{b}(0)}{(1-Hct)\cdot{S(0)}}K^{trans}\int_{0}^{t}S_{rb}(\tau)\exp\left(-(t-\tau)K^{trans}/v_e\right)d\tau+{\frac{S_{b}(0)}{(1-Hct)\cdot{S(0)}}}S_{rb}(t)v_p$$
The main advantage of using the Tofts model with S(t) is that it avoids error propagation associated with calculation of C(t). Implementation of signal intensity form of Tofts model in clinical practice may facilitate quick estimation of physiological parameters.
CONCLUSION
DCE-MRI physiological parameters can be reliably calculated from the Tofts model using signal measurements without concentration calculation.Acknowledgements
This research is supported by National Institutes of Health (R01 CA172801-01, R01 CA218700-01, and 5U01 CA142565-09).References
1. Tofts PS. Modeling tracer kinetics in dynamic Gd-DTPA MR imaging. J Magn Reson Imaging 1997;7(1):91-101.
2. Tofts PS, Brix G, Buckley DL, Evelhoch JL, Henderson E, Knopp MV, Larsson HB, Lee TY, Mayr NA, Parker GJ, Port RE, Taylor J, Weisskoff RM. Estimating kinetic parameters from dynamic contrast-enhanced T(1)-weighted MRI of a diffusable tracer: standardized quantities and symbols. J Magn Reson Imaging 1999;10(3):223-232.
3. Dale BM, Jesberger JA, Lewin JS, Hillenbrand CM, Duerk JL. Determining and optimizing the precision of quantitative measurements of perfusion from dynamic contrast enhanced MRI. J Magn Reson Imaging 2003;18(5):575-584.
4. Medved M, Karczmar G, Yang C, Dignam J, Gajewski TF, Kindler H, Vokes E, MacEneany P, Mitchell MT, Stadler WM. Semiquantitative analysis of dynamic contrast enhanced MRI in cancer patients: Variability and changes in tumor tissue over time. J Magn Reson Imaging 2004;20(1):122-128.
Figures