2465
Are Root Mean Squared Error (RMSE) and Structural Similarity Index (SSIM) the Most Appropriate Metrics for Assessment of MR Image Quality?1Physics and Atmospheric Science, Dalhousie University, Halifax, NS, Canada, 2Biomedical Translational Imaging Centre (BIOTIC), Nova Scotia Health Authority, Halifax, NS, Canada, 3Diagnostic Radiology, Dalhousie University, Halifax, NS, Canada
Synopsis
Quantifying MR image quality is important for the evaluation of new image acquisition and reconstruction techniques. Automated objective image quality metrics (IQMs) such as root mean squared error (RMSE) and the structural similarity index (SSIM) are commonly used surrogates for radiologists’ perception of image quality, which can be considered the gold standard. By calculating the correlation between radiologists’ subjective grading and various IQM scores on degraded MR images, we demonstrate that RMSE and SSIM do not correlate as well as other IQMs and are potentially not the most appropriate metrics for assessment of MR image quality.
Introduction
Quantifying the quality of an MR image is a difficult but important problem. In a sense, it is the radiologists’ perception that can be considered the gold standard, since clinical MR images are generated for their assessment. However, large-scale radiologist assessment of image quality can be challenging due to the size of image libraries and issues of inter- and intra- reader agreement. This has led to the introduction of objective image quality metrics (IQMs) as a surrogate, the most common of which is the root mean squared error (RMSE). Recently, more sophisticated metrics, such as the structural similarity index (SSIM1), have also gained widespread usage in the MRI community.
IQMs, such are RMSE and SSIM, are frequently applied towards assessing the quality of new image acquisition and reconstruction techniques2,3, including machine learning techniques4-6. The implicit assumption is that RMSE/SSIM correlate well with radiologists’ assessment of image quality. To our knowledge, however, these IQMs have not been validated in such a manner. This problem is particularly important as we are currently in a critical phase of the development of machine learning techniques. The purpose of this study was to assess the correlation between various IQMs and the opinion of expert radiologists. In addition to RMSE and SSIM, a broad range of objective IQMs that have been proposed in the image processing literature was assessed to identify potentially more appropriate IQMs.
Experimental Methods
Research ethics board approval was obtained and the need for patient consent was waived. Ten full-reference IQMs were chosen for this study: RMSE, SSIM1, PSNR, GMSD7, IWSSIM8, FSIM9, HDRVDP10, MSSSIM11, NQM12, and VIF13. For reference images, nine brain and nine abdominal MR images were selected from the hospital’s picture archiving and communication system by board-certified radiologists and anonymized. Three abdominal radiologists and two neuroradiologists were included as readers in the study.
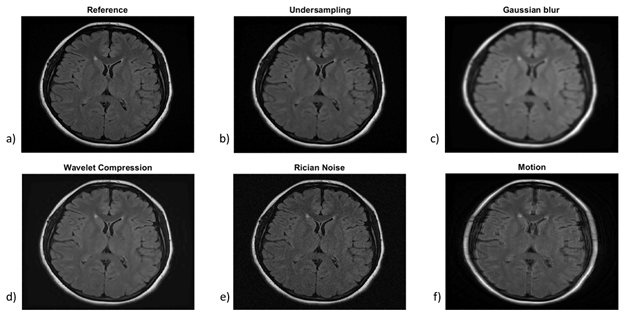
A set of degraded images was generated by applying one of six degradation techniques to the reference images. This approach was required because a known reference is needed for the IQM calculations and it also allows the strengths of the degradations to be applied in a controlled manner. Representative images are shown in Figure 1. Each degradation technique was applied at four different strengths to each reference image, except for the motion artifacts, which were only added to the brain images. This resulted in an image library of 414 images including the reference image, and 1017 manual scorings by the radiologists. The radiologists scored overall image quality on a 1-5 Likert scale that was determined by consensus on a training set before scoring the images included in the results. Each radiologist only scored images from anatomical areas corresponding to their specialty. IQMs for each degraded image were calculated using the corresponding reference image.
Correlations between each IQM scores and the radiologists’ scores were measured using the Pearson linear (PLCC) and the Spearman rank order (SROCC) correlation coefficients.
Results and Discussion
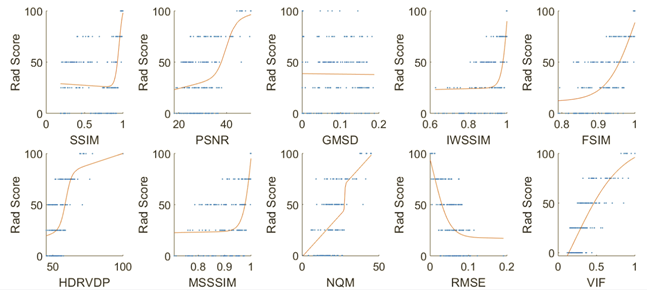
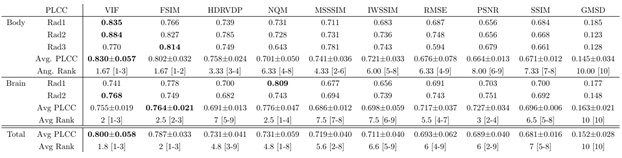
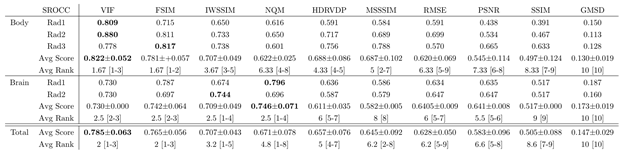
Trends between the radiologists’ scores and IQMs were observed with varying degrees of agreement (Figure 2). This suggests that some metrics perform better than others in capturing the features that radiologists deem important to MR image quality. Correlation coefficients for each radiologist’s rankings are shown in Tables 1 and 2, respectively. While there is some fluctuation in the ranks of the middle performing metrics (NQM, HDRVDP, IWSSIM, and MSSIM), the performance of the top ranking (FSIM and VIF) and bottom ranking (PSNR, RMSE, GMSD, and SSIM) metrics are quite consistent between radiologists.
These results suggest that SSIM and RMSE may not be the most appropriate metrics for automated assessment of MR image quality if radiologist assessment is considered the gold standard. When choosing a metric to assess a new image reconstruction technique, our results suggest that a metric such as FSIM or VIF will correlate better with radiologists’ opinion. In the future, this work will be extended to include images from other radiological subspecialties. The results presented herein can be applied towards evaluating the performance of future proposed reference or no-reference IQMs.
Conclusions
In this study, it is found that the most commonly used metrics for MR image quality evaluation, SSIM and RMSE, do not perform as well as many other metrics evaluated herein demonstrating the shortcoming of these metrics. Our results have important implications for the significant number of investigators recently adopting such metrics to evaluate new image acquisition and reconstruction techniques, particularly those assessing performance of machine learning techniques.Acknowledgements
Funding for this research was provided by NSERC, Brain Canada, the Atlantic Innovation Fund, and an Investigator Sponsored Research Agreement with GE Healthcare.References
[1] Wang Z, Bovik Z, Sheikh H, and Simoncelli P. Image Quality Assessment: From Error Visibility to Structural Similarity. IEEE Trans Image Proc. 2004; 13(4):1-14.
[2] Zheng H, Zend K, Guo D, et al. Multi-contrast Brain MRI Image Super resolution with Gradient-guided Edge Enhancement. Proc. Intl. Soc. Mag. Reson. Med. 2018; 26:3169.
[3] Kumar N, Kumar S, and Fritz J. Whole-Volume, High-Resolution, In-Vivo Signal-to-Noise Ratio and G-factor Superiority, and Structural Similarity Index Differences, of Compressed Sensing SPACE and CAIPIRINHA SPACE over GRAPPA SPACE. Proc. Intl. Soc. Mag. Reson. Med. 2018; 26:3513.
[4] Huang J, Qin J, Wang L, et al. CNN based Super-Resolution of Intravoxel Incoherent Motion Imaging for Liver. Proc. Intl. Soc. Mag. Reson. Med. 2018; 26:4620.
[5] Hammernik K, Klatzer T, Kobler E, et al. Learning a Variational Network for Reconstruction of Accelerated MRI Data. Mag Res Med 2018; 79:3055-3071.
[6] Gozcu B, Mahabadi R, Li Y, et al. Learning-Based Compressive MRI. IEEE Trans Med Img 2018. 37(6):1394-1406.
[7] Xue W, Zhang L, Mou X, and Bovik A. Gradient Magnitude Similarity Deviation: A Highly Efficient Perceptual Image Quality Index. IEEE Trans on Image Proc 2013. 223(2):684-695.
[8] Wang Z, and Li Q. Information Content Weighting for Perceptual Image Quality Assessment. IEEE Trans on Image Proc 2011. 20(5):1185-1198.
[9] Zhang L, Zhang L, Mou X, and Zhang D, FSIM: A Feature Similarity Index for Image Quality Assessment. IEEE Trans on Image Proc 2011. 20(8):2378-2386.
[10] Mantuik R, Daly S, Myszkowski K, and Seidel H. Predicting Visible Differences in High Dynamic Range Images – Model and its Calibration. SPIE Proc 2005. 204-214.
[11] Wang Z, Simoncelli E, and Bovik A, Multi-Scale Structural Similarity for Image Quality Assessment. Proceedings of the 37th IEEE Asilomar Conference on Signals, Systems and Computers 2003.
[12] Damera-Venkata N, Kite T, Geisler W et al. Image Quality Assessment Based on a Degradation Model. IEEE Trans on Image Proc. 2000. 9(4):636-650.
[13] Sheikh H and Bovik A. Image Information and Visual Quality. IEEE Trans on Image Proc. 15(2):430-444.
[14] Sheikh H, Sabir, M, and Bovik A. A Statistical Evaluation of Recent Full Reference Image Quality Assessment Algorithms. IEEE Trans on Image Proc. 15(11):3441-3452.
Figures