2461
Spherical harmonics coefficients estimation using deep neural network1Center for Biomedical Imaging Research, Department of Biomedical Engineering, School of Medicine, Tsinghua University, Beijing, China, 2China National Clinical Research Center for Neurological Diseases, Beijing Tiantan Hospital, Capital Medical University, Beijing, China, 3Vascular Imaging Laboratory, Department of Radiology, University of Washington, Seattle, WA, United States
Synopsis
Diffusion-weighted imaging can be used to detect orientations of fibers to study human brain connectivity using tractography techniques. Spherical deconvolution based techniques have been widely used for the estimation of fiber orientation distribution (FOD), in which FODs are represented using spherical harmonics coefficients. However, high quality FOD estimation still requires large number of measurements. In this study, a deep neural network based method is proposed to estimate high quality FODs using highly q-space undersampled measurements thus to improve the acquisition efficiency.
Introduction
Diffusion-weighted imaging can be used to detect the orientations of fibers to study human brain connectivity using tractography techniques. Various methods have been proposed to estimate the fiber orientations, such as diffusion spectrum imaging (DSI) technique 1, which samples the diffusion signals on a three-dimensional Cartesian lattice and is time-intensive. To reduce the number of required measurements, methods have been developed to model the diffusion signals with adequate bases, such as spherical deconvolution technique 2, and later proposed constrained spherical deconvolution (CSD) 3, in which signals on spherical shells are sampled. With these methods, the estimation of fiber orientation distribution (FOD) is equivalent to the estimation of spherical harmonic (SH) coefficients. The number of measurements required by CSD is decided by the harmonic order $$$lmax$$$ , for example, for $$$ lmax=8$$$, 45 DW measurements are needed. However, in practice, using more measurements than CSD requires can evidently improve the quality of the estimated FODs. Deep learning has been successfully attempted to various MR imaging analysis tasks, including the computation of some diffusion properties. For example, in Ref. [4], a multiple layer perceptron (MLP) was used to predict features, such as diffusion kurtosis 4. In this work, a deep learning algorithm is proposed to estimate high quality FODs using highly q-space undersampled measurements to improve the feasibility of clinical use.Methods
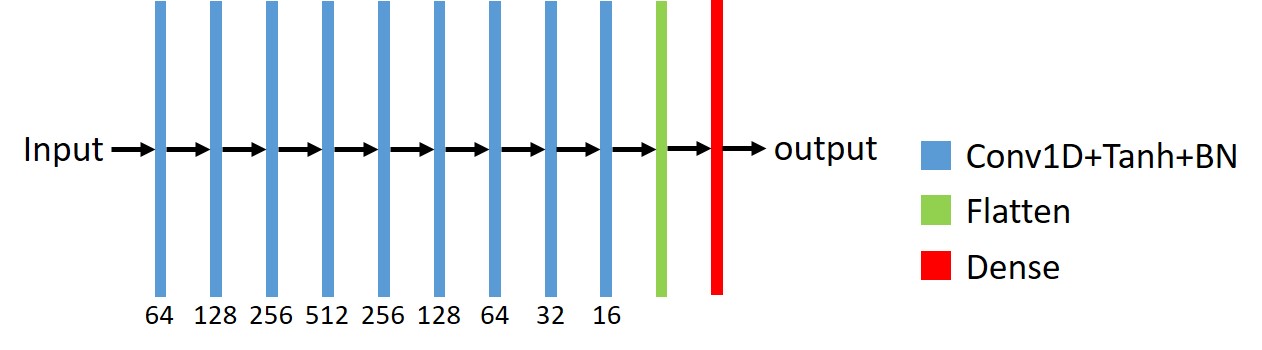
(1) FOD representation using SH basis: Suppose the signal associated with a diffusion gradient $$$q_k$$$ (k = 1, … , K) is denoted by $$$S(q_k )$$$ and the signal without diffusion weighting is $$$S_0$$$, the diffusion behavior can be modeled as: $$$S(q_k)/S_0=\sum_{l=1}^{lmax}\sum_{m=-l}^{l}c_{lm}Y_{lm}(q_k) $$$, where $$$Y_{lm}$$$ is the SH basis element, and $$$c_{lm}$$$ is the corresponding coefficient. The orientation distribution function (ODF) of fiber can be obtained through a linear transformation of coefficients $$$C$$$. Let $$$v$$$ be the ODF values in a set of discrete directions, then $$$v = FC$$$, where $$$F$$$ is the constant transformation matrix. (2) Deep neural network (DNN): The network was designed to learn the 45 coefficients ($$$lmax=8$$$) from 48 measurements (45 with diffusion weighting and 3 without) normalized by $$$S_0$$$. The structure is shown in Fig. 1, including 9 one-dimensional convolutional layers (kernel size = 5), 1 flatten layer and 1 dense layer. The number of input neurons is 48 and the number of output neurons is 45. The loss function was designed to capture the consistency of basis coefficients and the ODFs:$$$min\parallel{C-C_{label}}\parallel_2+\lambda\parallel{FC-FC_{label}}\parallel_1$$$ , where $$$λ=0.01$$$ is the weighting factor and $$$C_{label}$$$ is the label of the coefficients. (3) Materials: Eight different subjects from the Human Connectome Project (HCP) were used 5. For the first six subjects, 100000 white matter voxels were extracted randomly from each subject, resulting in 700000 voxels in total. The voxels from the first 5 subjects were used for training and the voxels from the other one were used for validation. All the voxels of the last two subjects were used for test and evaluation. The 48 measurements included 3 b = 0 s/mm2 measurements and 15 DW images for each b = 1000, 2000, 3000 s/mm2 (the first 48 measurements in HCP datasets). The ground truth of FODs was generated using the whole 288 measurements by the CSD algorithm in MRtrix (http://www.mrtrix.org/), which were used as the labels of the network. (4) Evaluation: To evaluate the accuracy improvement of this DNN based method, FODs by the CSD method were also computed using the 48 measurements (denoted as CSD). The mean-squared-errors (MSE) between the ground truth and the FODs generated by DNN and CSD were calculated respectively. Fiber tracking was performed for the FODs generated by DNN, CSD and the ground truth separately using MRtrix.Results and Discussion
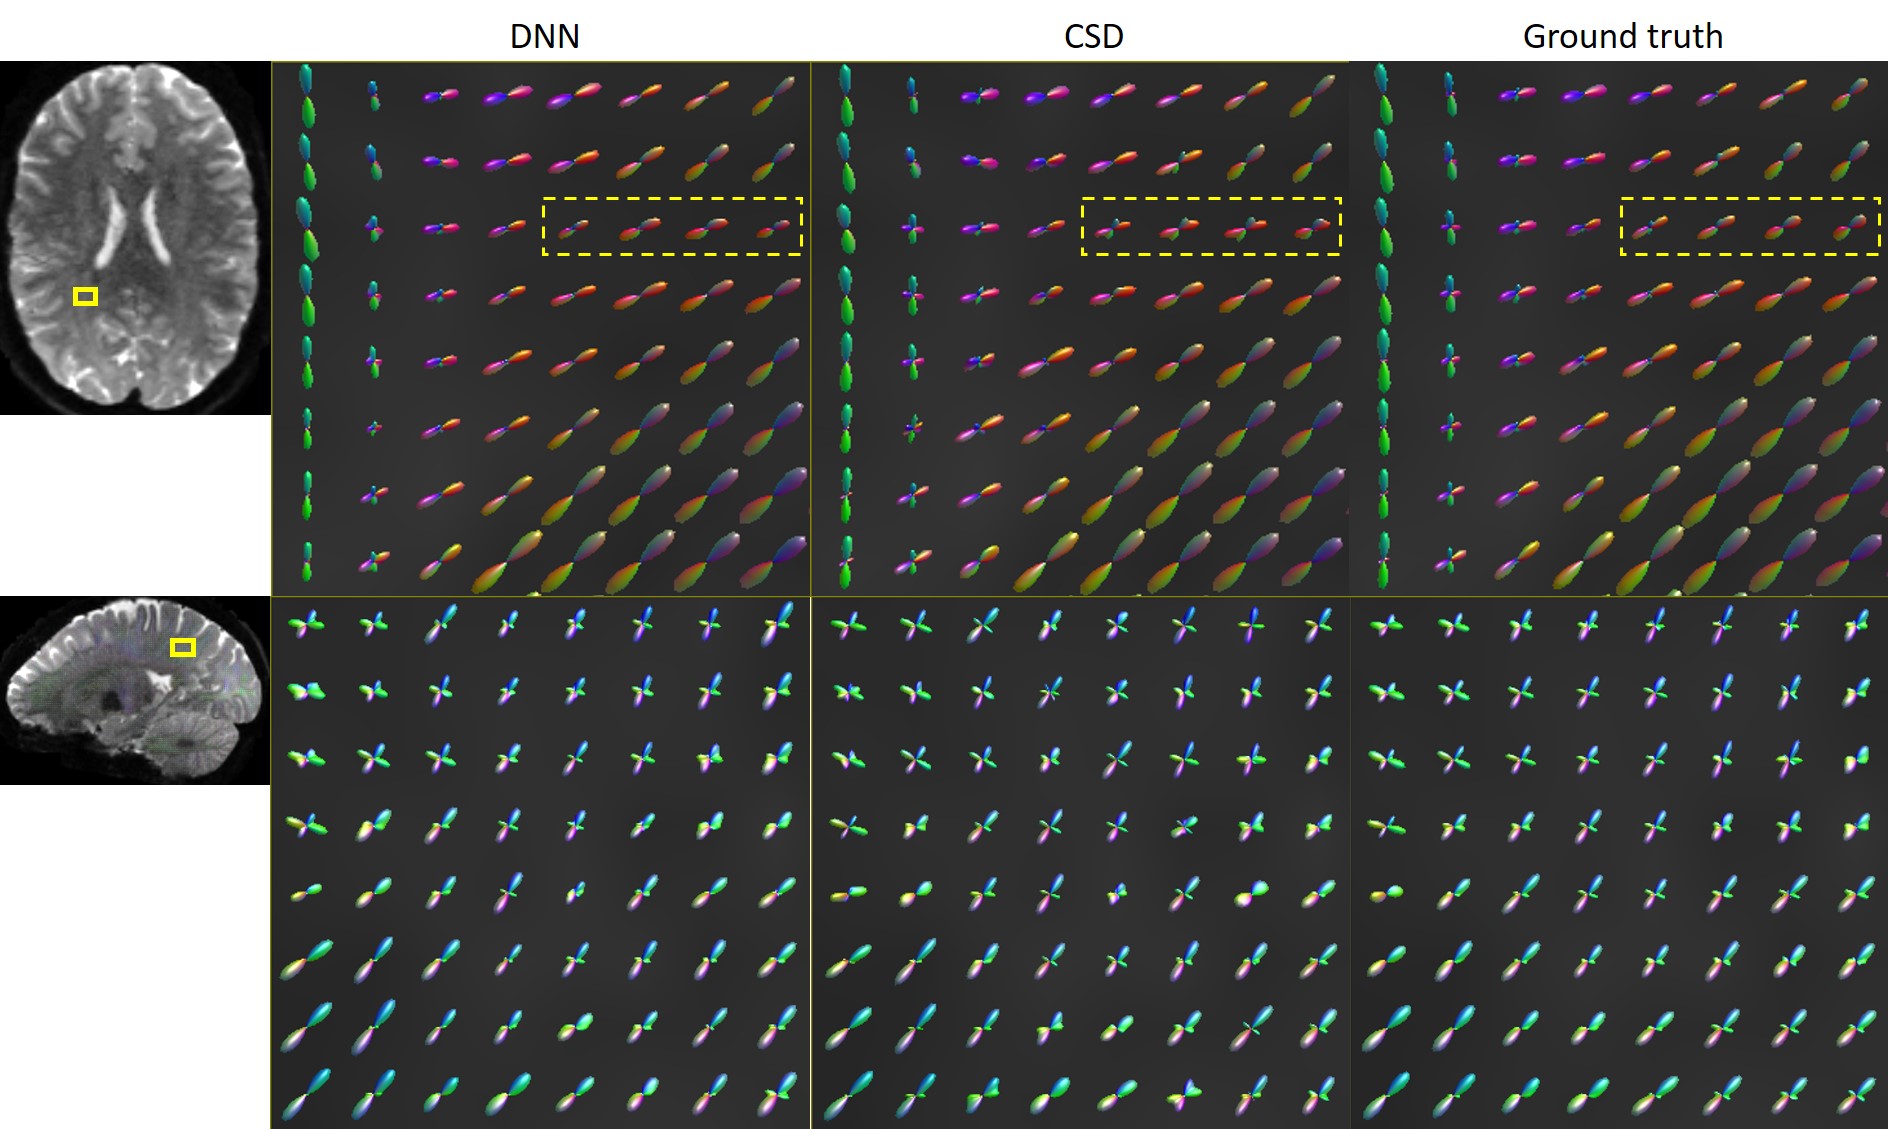
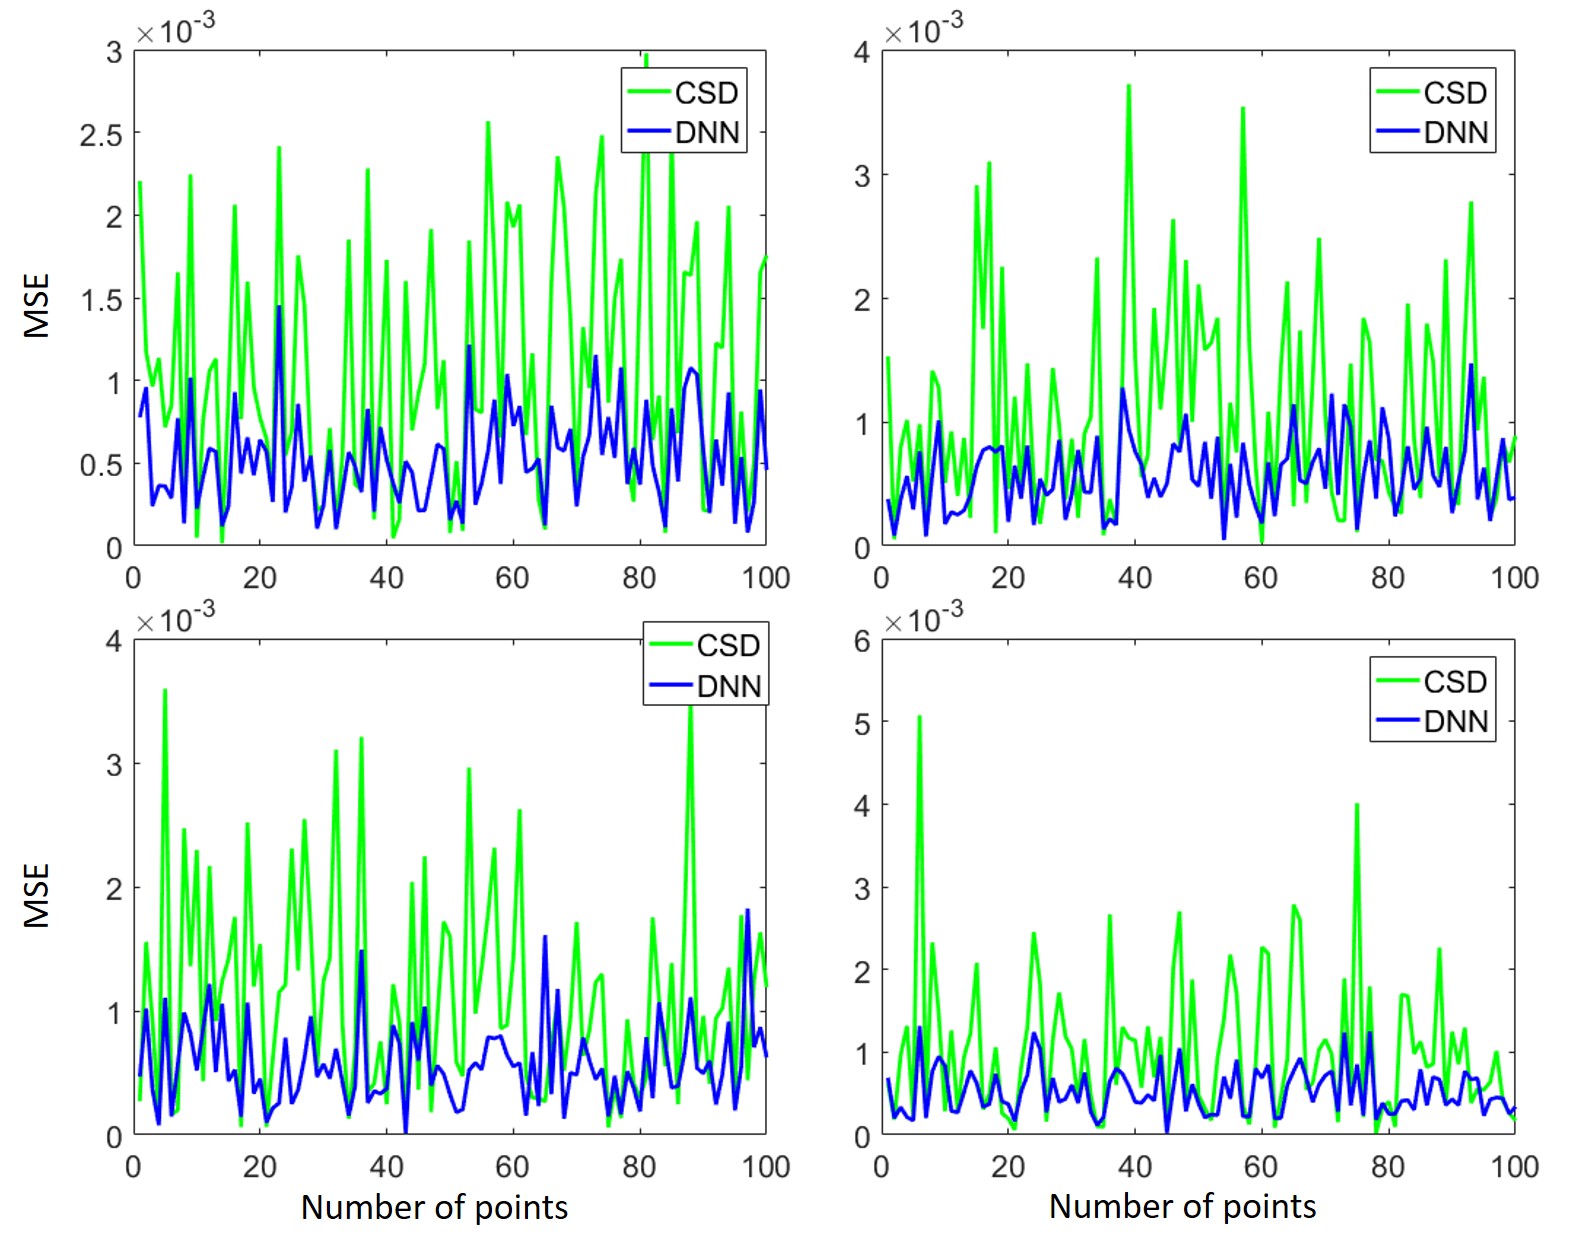
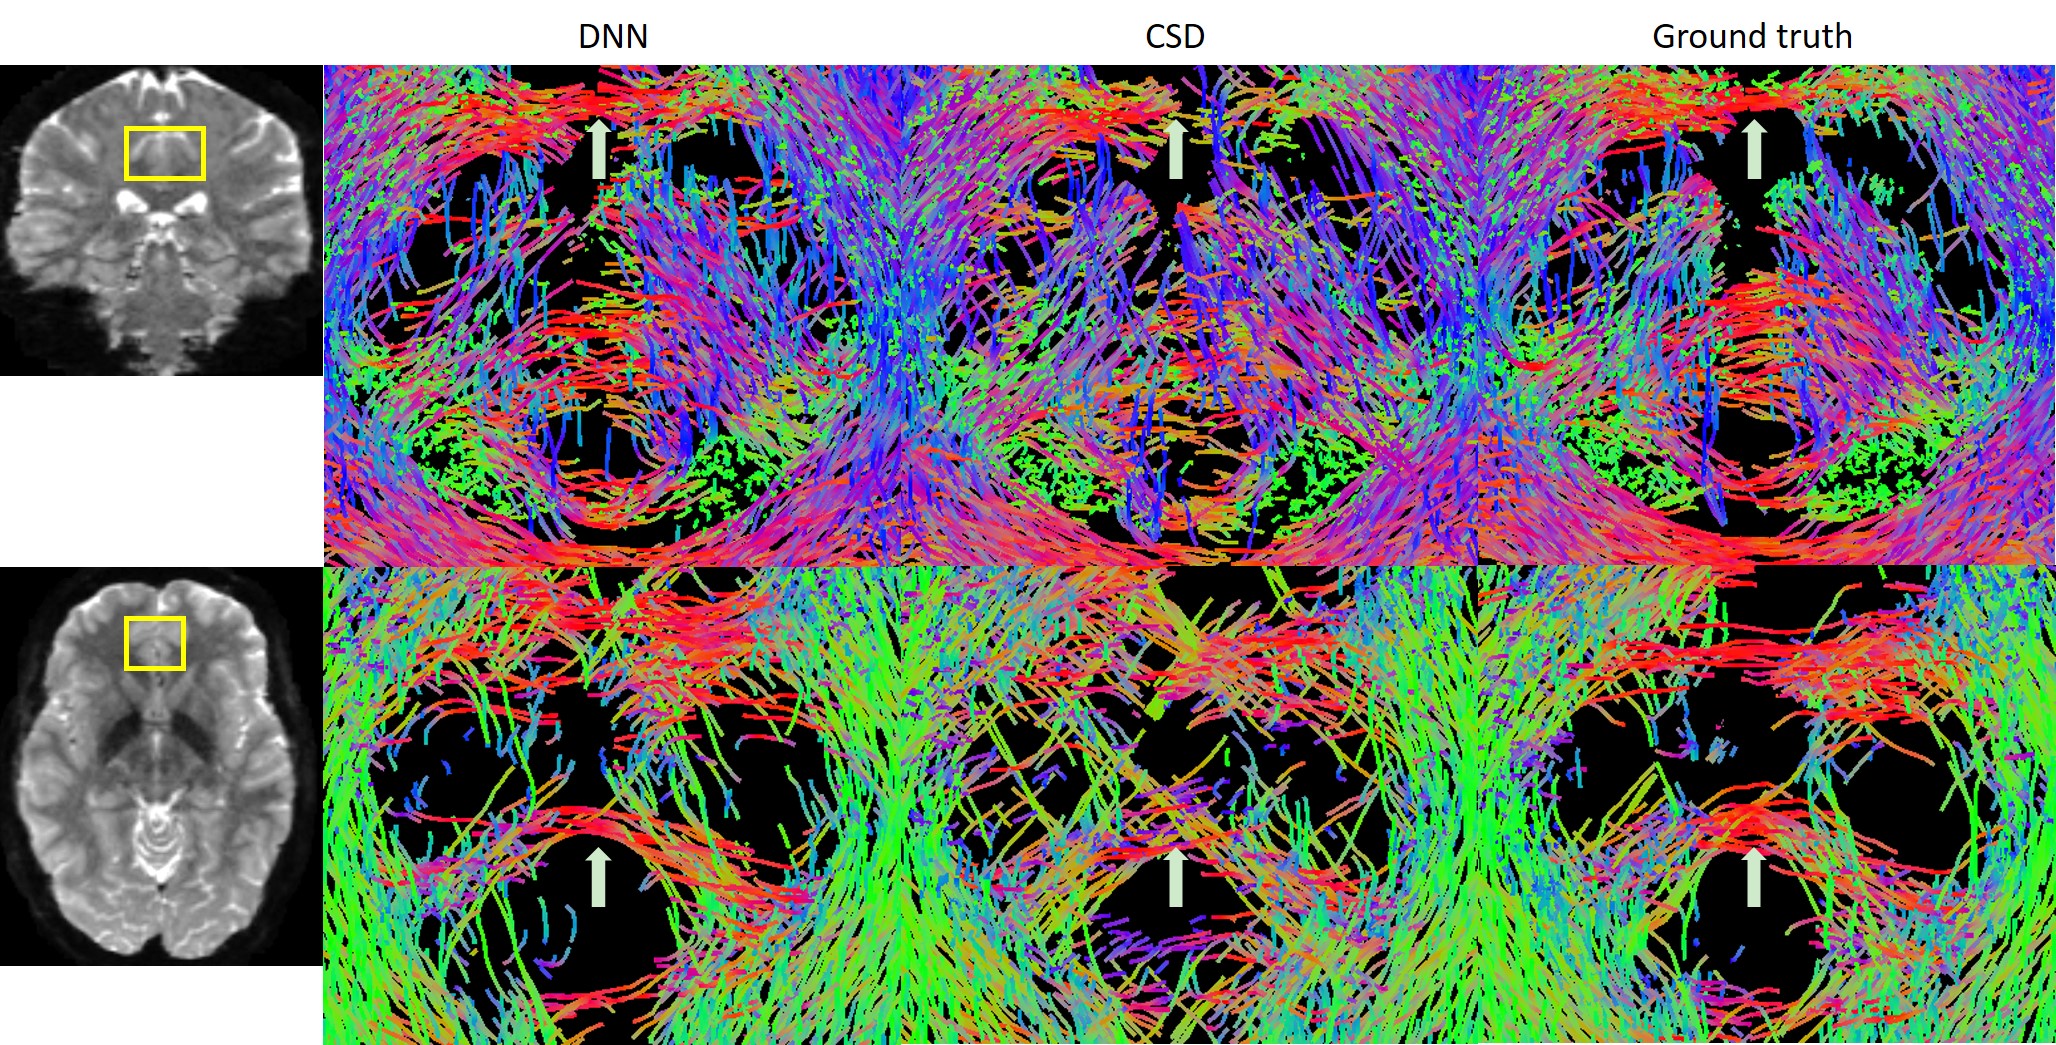
Fig. 2 shows the FODs calculated using DNN, CSD and the ground truth in two different regions. The outputs of DNN show good consistency with the ground truth. Fig. 3 shows the MSEs of four sets of 100 randomly chosen voxels in white matter or gray matter from the test data. The MSEs of DNN are lower than those of CSD for almost all voxels. Fig. 4 shows the fiber tracking results in two different regions, in which the results of DNN show much better connectivity than CSD when compared with the ground truth. These results show that the DNN based method can estimate SH coefficients/FODs with higher quality than the traditional CSD when using 16.7% measurements.Conclusion
In conclusion, a DNN based FOD estimation technique is proposed to achieve high quality SH coefficients using highly q-space undersampled measurements to improve sampling efficiency.Acknowledgements
No acknowledgement found.References
1. Wedeen VJ, Hagmann P, Tseng WY, Reese TG, Weisskoff RM. Mapping complex tissue architecture with diffusion spectrum magnetic resonance imaging. Magnetic resonance in medicine 2005;54(6):1377-1386.
2. Tournier JD, Calamante F, Gadian DG, Connelly A. Direct estimation of the fiber orientation density function from diffusion-weighted MRI data using spherical deconvolution. NeuroImage 2004;23(3):1176-1185.
3. Tournier JD, Calamante F, Connelly A. Robust determination of the fibre orientation distribution in diffusion MRI: non-negativity constrained super-resolved spherical deconvolution. NeuroImage 2007;35(4):1459-1472.
4. Golkov V, Dosovitskiy A, Sperl JI, Menzel MI, Czisch M, Samann P, Brox T, Cremers D. q-Space Deep Learning: Twelve-Fold Shorter and Model-Free Diffusion MRI Scans. IEEE Trans Med Imaging 2016;35(5):1344-1351.
5. Fan Q, Witzel T, Nummenmaa A, Van Dijk KR, Van Horn JD, Drews MK, Somerville LH, Sheridan MA, Santillana RM, Snyder J, Hedden T, Shaw EE, Hollinshead MO, Renvall V, Zanzonico R, Keil B, Cauley S, Polimeni JR, Tisdall D, Buckner RL, Wedeen VJ, Wald LL, Toga AW, Rosen BR. MGH-USC Human Connectome Project datasets with ultra-high b-value diffusion MRI. NeuroImage 2016;124(Pt B):1108-1114.
Figures