2455
Knowledge-based definition of morphological alterations in brain MRI through the angle-based thresholding approach1The Russell H. Morgan Department of Radiology and Radiological Science, Johns Hopkins University School of Medicine, Baltimore, MD, United States, 2Center for Imaging Science, The Johns Hopkins University School of Medicine, Baltimore, MD, United States, 3for the Pediatric Imaging, Neurocognition and Genetic study, multiple cities and states, CA, United States
Synopsis
An automated method to detect brain morphological alterations was developed, which was designed for clinical pediatric brain MRIs with heterogeneous clinical conditions. Numerous image-feature-recognition algorithms have successfully defined abnormalities related to specific diseases, but there has been little research into a method that could identify a wide-range of radiological findings that could vary depending on the type and severity of different pathologies. A proposed approach—structural image parcellation followed by an angle-based outlier detection (ABOD) algorithm—could identify mild morphological alterations with high sensitivity and excellent specificity, when applied to clinical pediatric brain MRIs.
Introduction
The detection of mild volumetric alterations seen on brain anatomical MRI is often challenging, particularly in pediatric MRI. Numerous image-feature-recognition algorithms have successfully defined diseased brains, but most of these studies have targeted specific diseases or conditions to be discriminated from a normal brain. Little is known about a generic threshold that would be applicable to the definition of various types of morphological abnormalities (type and severity of diseases) that are seen on clinical MRIs. To overcome issues of clinical heterogeneity and the curse of dimensionality in medical image analysis, we proposed an automated thresholding method based on a two-tier approach: structural image parcellation to convert anatomical MRI into an anatomical feature vector (AFV), followed by the application of an angle-based outlier detection (ABOD) algorithm, which is robust to high-dimensional data, to define a threshold between normal and abnormal brains. We hypothesized that the ABOD-based method would outperform a structure-by-structure method in detecting MRIs with volumetric changes in the brain.Methods
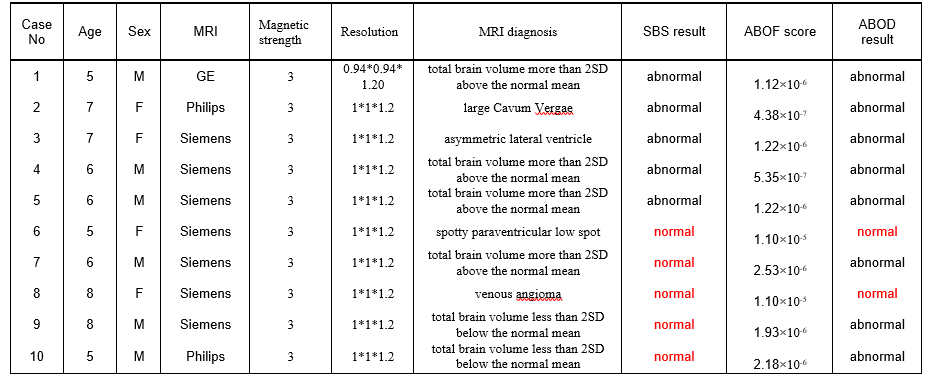
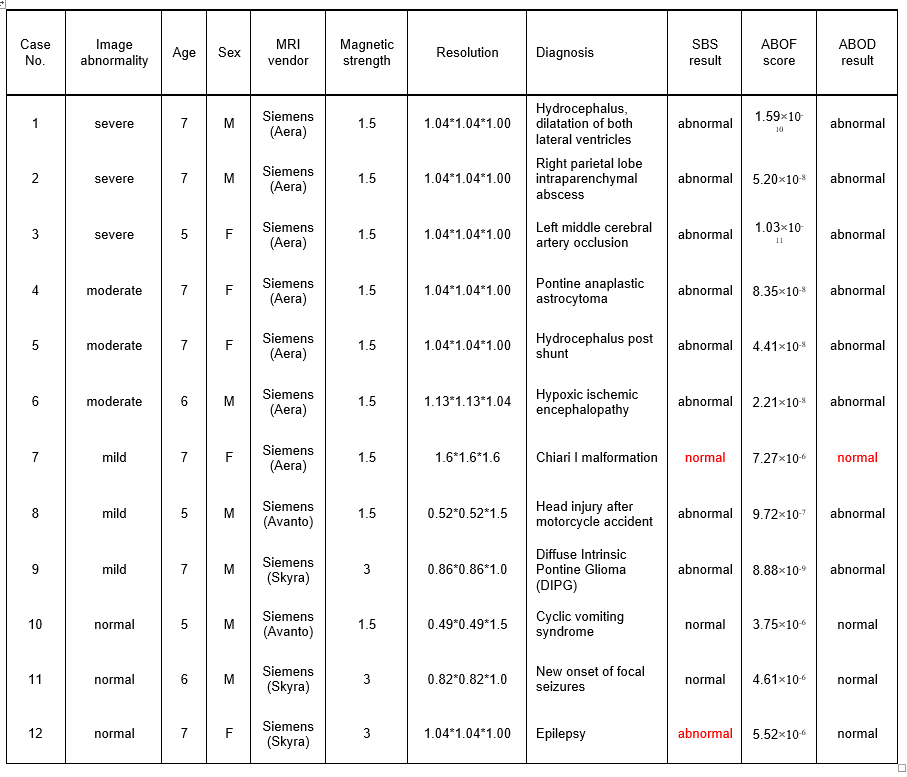
Participants and MRI scans: To test the effect of the proposed two-tier approach, we focused on anatomical T1- weighted MRIs obtained from a limited age-range (4- to 8-year-old children). Training-dataset: the publicly available Pediatric Imaging, Neurocognition, and Genetics (PING) dataset, which contains high-resolution T1-weighted anatomical MRIs of normal children, was used (n = 183). A neurosurgeon trained in brain image analysis visually inspected all images and identified 10 MRIs with anatomical findings among them (Table 1). Three-dimensional T1-weighted MRIs with a voxel size of 0.94×0.94×1.2 or 1×1×1.2 mm were obtained on 3T scanners located in nine institutes (http://pingstudy.ucsd.edu/)1. Test-dataset: MRIs scanned with clinical indications at the Johns Hopkins Hospital and stored in a research server after de-identification were included. We arbitrarily selected nine MRIs with anatomical findings and three MRIs without findings (normal MRIs) (Table 2). Image parcellation and quantification: A fully-automated, multi-atlas, label fusion method2 implemented in the MRICloud (www.MRICloud.org)3 was applied to parcellate each MRI into 40 anatomical structures2 and to measure the volume of each structure. Since left-right asymmetry is one of the most important features that radiologists routinely evaluate, an asymmetry index (log-ratio of the left and right volumes) was calculated from19 structures. The volume of the 40 structures and the asymmetry index of the 19 structures were corrected for linear effects of sex and age4, then converted to a z-score based on their mean and standard deviation (SD), which formed an anatomical feature vector (AFV) that consists of 59 z-score elements for each MRI. Structure-by-structure (SBS) image abnormality detection: Normal MRI was defined as images with “all the AFV elements within 2 SDs.” Other MRIs were defined as “abnormal.” This definition, if applied to the training-dataset without correcting for multiple comparisons, identified all MRIs as “abnormal.” To account for the multiple comparisons of 59 elements, the SD was adjusted based on Bonferroni’s method (corrected-SD = 3.3). Sensitivity and specificity for the identification of normal MRIs (n = 173) from all MRIs (n = 183) based on the training-dataset was calculated. The same corrected-SD was applied to the test-dataset to calculate sensitivity and specificity. ABOD algorithm: For each AFV of the training-dataset, variance over the angles between the selected AVF to all pairs of AFVs, weighted by the corresponding Euclidian distances, was defined as an angle-based outlier factor (ABOF)5. Receiver Operating Characteristic (ROC) curve analysis was performed to define an optimal ABOF threshold to enable separation of normal and abnormal MRIs with high sensitivity and specificity. The ABOF threshold was applied to the training- and test-datasets to investigate their sensitivity and specificity to detect normal MRIs.Results
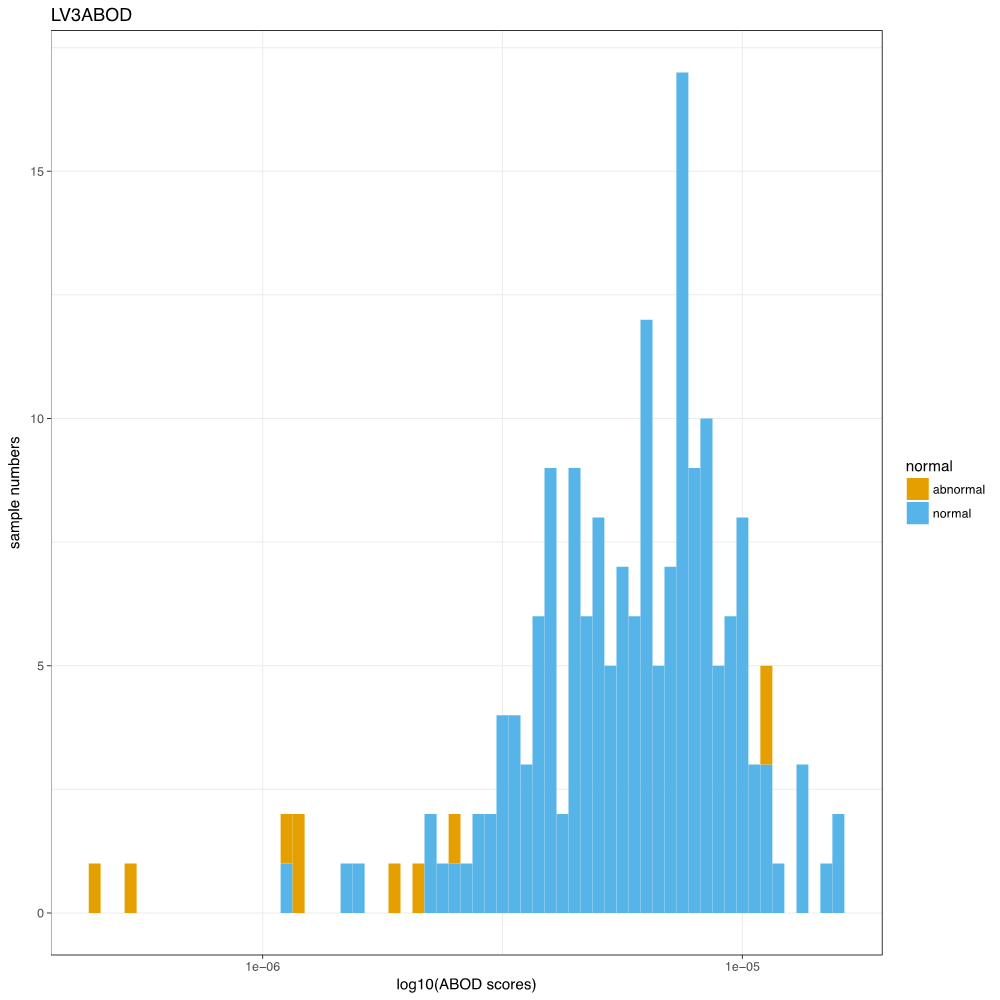
1) SBS-based detection: Training-dataset: the sensitivity was 0.50 and the specificity was 0.95. Test-dataset: the sensitivity was 0.88 and the specificity was 0.66. 2) ABOD-based detection: Training-dataset: the histogram of the ABOF (Fig. 1) and the ROC curve (Fig. 2) are demonstrated. The ABOF threshold was determined as 2.64×10⁻⁶. The sensitivity was 0.80 and the specificity was 0.96. Test-dataset: the sensitivity was 0.88 and the specificity was 1.00.Discussion and Conclusion
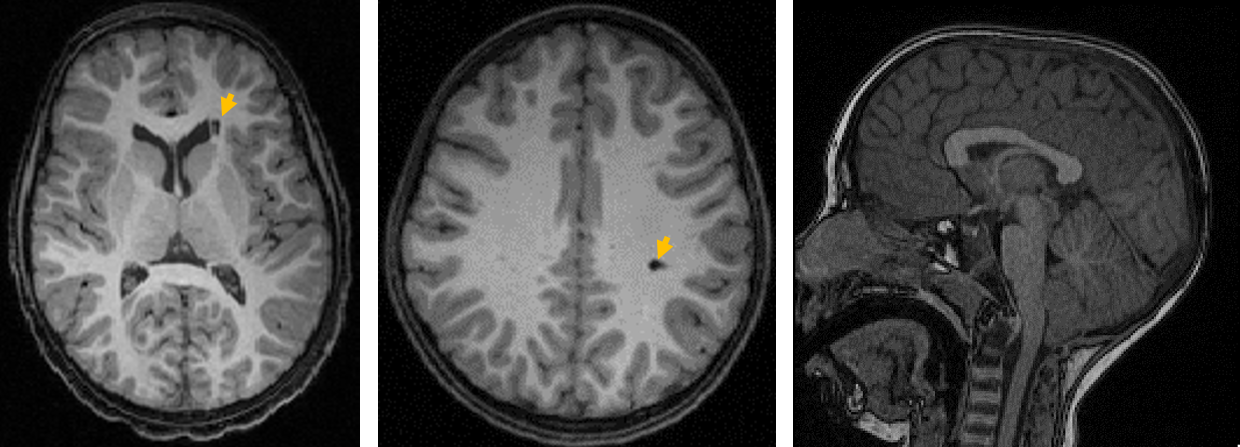
The ABOD-based approach outperformed the SBS-based approach in identifying normal MRIs from MRIs with radiological findings. However, radiological findings without volume change could not be detected by our ABOD method applied to the T1-weighted MRI volumetric data. For example, images with a small lesion without structural volume change and with a minor protrusion of the tonsil (Chiari I malformation) were labeled as “normal” (Fig. 3). An external validation study with a larger number of test MRIs in a diverse setting is needed.Acknowledgements
This work was made possible by the Fakhri Rad BriteStar award from the Department of Radiology Johns Hopkins University School of Medicine. *Data used in preparation of this article were obtained from the Pediatric Imaging, Neurocognition and Genetics Study (PING) database (http://ping.chd.ucsd.edu). As such, the investigators within PING contributed to the design and implementation of PING and/or provided data but did not participate in analysis or writing of this report. A complete listing of PING investigators can be found at https://ping-dataportal.ucsd.edu/sharing/Authors10222012.pdf.References
1. Jernigan TL, Brown TT, Hagler DJ, Jr., et al. The Pediatric Imaging, Neurocognition, and Genetics (PING) Data Repository. Neuroimage. 2016; 124: 1149-54.
2. Tang X, Oishi K, Faria AV, et al. Bayesian Parameter Estimation and Segmentation in the Multi-Atlas Random Orbit Model. PloS one. 2013; 8: e65591.
3. Mori S, Wu D, Ceritoglu C, et al. MRICloud: Delivering High-Throughput MRI Neuroinformatics as Cloud-Based Software as a Service. Computing in Science & Engineering. 2016; 18: 15.
4. Dukart J, Schroeter ML and Mueller K. Age correction in dementia--matching to a healthy brain. PLoS One. 2011; 6: e22193.
5. Kriegel H-P, Schubert M, Zimek A. Angle-based outlier detection in high-dimensional data. Proceedings of the 14th ACM SIGKDD international conference on Knowledge discovery and data mining. Las Vegas, Nevada, USA: ACM; 2008; 444-452.
Figures