2454
Automated perfusion lesion delineation in stroke: comparison with experts and alternative automated strategies1Center for Stroke Research Berlin, Charité – Universitätsmedizin Berlin, Berlin, Germany, 2International Graduate Program Medical Neurosciences, Charité – Universitätsmedizin Berlin, Berlin, Germany, 3Berlin School of Mind & Brain, Humboldt Universität zu Berlin, Berlin, Germany, 4Department of Neurology, Max Planck Institute for Human Cognitive and Brain Sciences, Leipzig, Germany
Synopsis
This study aimed to validate an in-house script that detects perfusion lesions in dynamic susceptibility contrast magnetic resonance images of acute stroke patients and compare its performance with commercially available software. Perfusion lesions were estimated from time-to-maximum and mean transit time maps of 94 stroke patients using our algorithm, Perfscape/Neuroscape, PMA, and Stroketool. These automatically delineated lesions were volumetrically and spatially compared with those delineated by a trained expert. Our algorithm performs comparably to other programs on the market and overestimates lesion volumes to a lesser extent; however, it is currently limited by its reliance on manual input.
Introduction
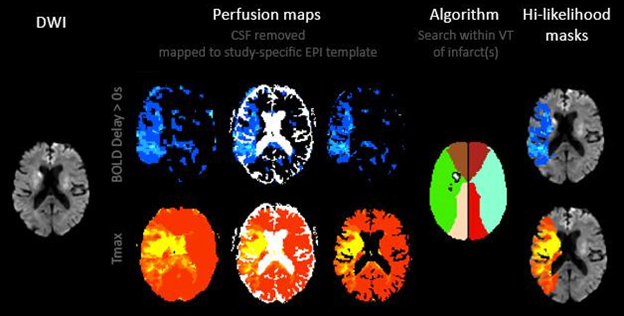
Given the importance of rapidly determining the hemodynamic progression of stroke and the amount of resources that are consumed to this end, there is a need for automated tools to analyze perfusion imaging data. One method of perfusion imaging, known as BOLD delay, is a promising tool for assessing blood flow in stroke without the use of a contrast agent1 but is particularly underserved by current automated tools. We have developed a program to estimate the size and location of potential perfusion lesions in both BOLD delay and dynamic susceptibility contrast magnetic resonance imaging (DSC-MRI). Our algorithm receives a manually delineated diffusion-weighted image (DWI) and a non-delineated, thresholded perfusion image as inputs; searches the vascular territories in which there is a DWI infarct for corresponding perfusion lesions; and outputs high- and medium/low-likelihood perfusion masks representing areas of potential hypoperfusion, based on the size and proximity of perfusion lesions to DWI infarcts (Figure 1). Here, we validated its use with DSC-MRI images and compared its performance on DSC-MRI images with other, commercially available programs.
Methods
Perfusion maps of time-to-maximum (Tmax) and mean transit time (MTT) were generated in Perfscape/Neuroscape, PMA, and Stroketool for 94 patients (Mage = 70.9 years; 56 male) with acute ischemic stroke participating in the 3 Tesla Stroke Medical Radiologic Technology for Examining Mismatch in 1000+ (1000Plus; NCT00715533) prospective clinical study.2 Tmax maps were thresholded at 4s and 6s while MTT maps were thresholded at 5s and 6s, based on the literature.3,4 The locations and volumes of hypoperfused tissue were determined in PMA-generated maps using both our program and an expert rater and compared. Next, the volumes of perfusion lesions were calculated using both an automated and manual protocol for the three aforementioned programs,3 and the differences between these two volumes were compared to those for our algorithm. The spatial accuracy of our algorithm relative to the manual rater was evaluated and compared to that of the automated PMA protocol using the Dice similarity index.5
Results
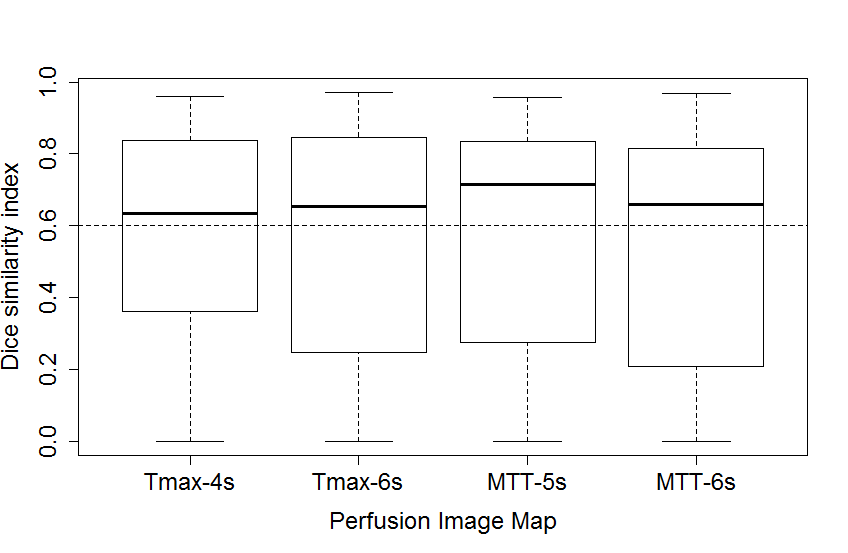
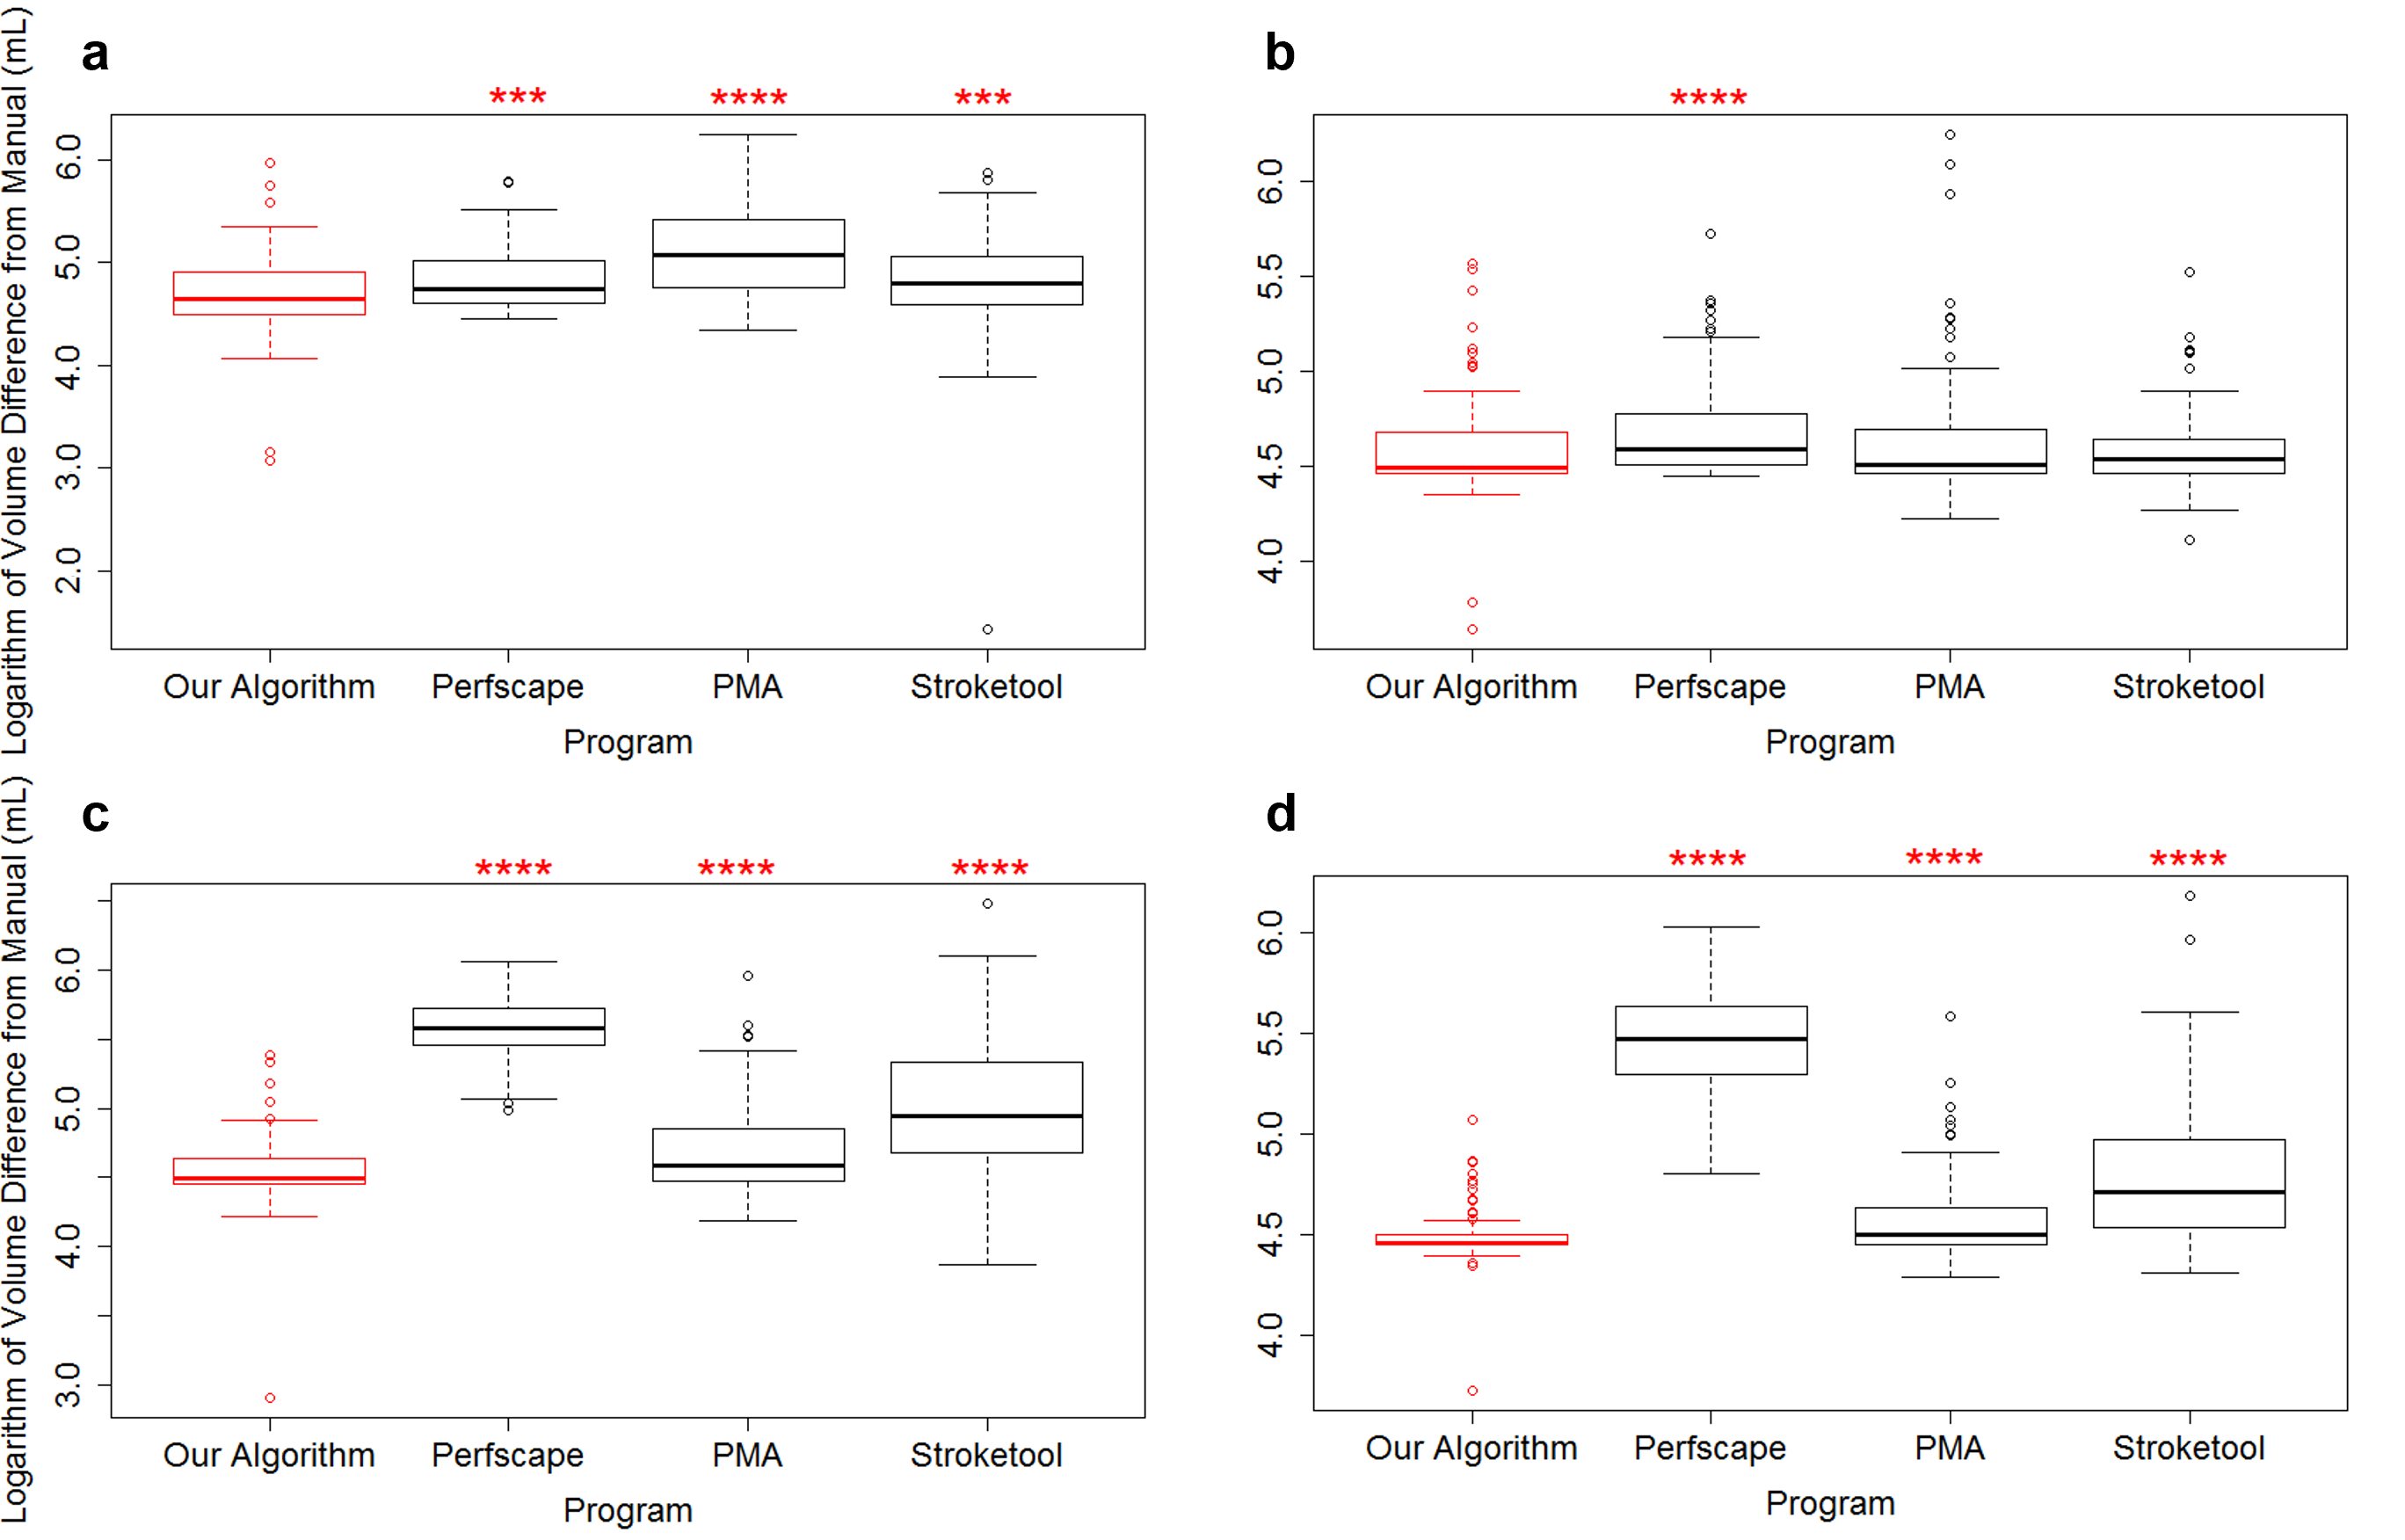
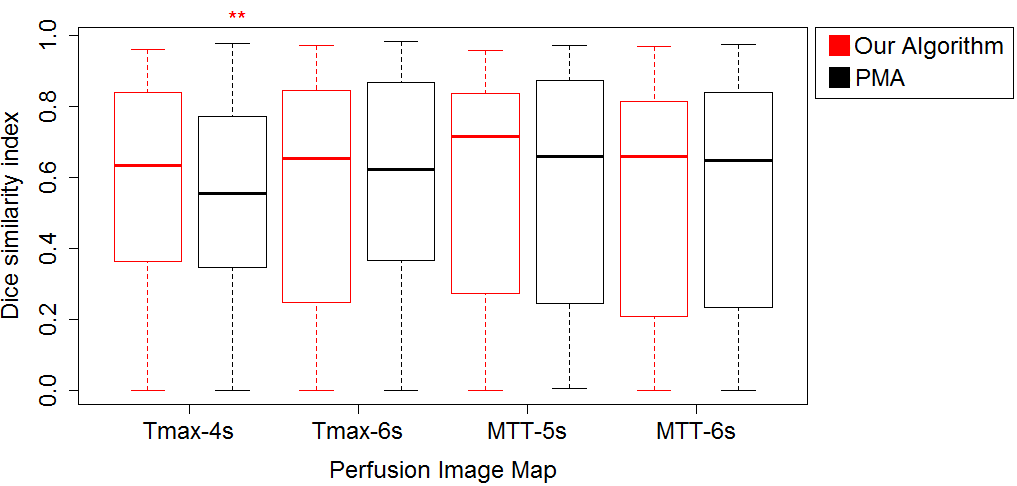
Bland-Altman plots comparing our algorithm with an expert rater had a mean lesion volume difference of 12.2mL + 51.0mL for MTT-5s, 5.3mL + 25.8mL for MTT-6s, 33.0mL + 131.7mL for Tmax-4s, and 18.5mL + 70.4mL for Tmax-6s. The median Dice index was highest for MTT-5s (0.72), followed by MTT-6s (0.66), Tmax-6s (0.65), and Tmax-4s (0.64; Figure 2). For all perfusion maps, our algorithm’s mean volume overestimation was significantly less than Perfscape’s, while our algorithm’s mean volume overestimation was significantly less than Stroketool and PMA’s for all perfusion maps except Tmax-6s, where there was no significant difference (Figure 3). For Tmax-4s, our algorithm had a significantly higher mean Dice similarity index than did PMA, with no other significant differences emerging (Figure 4).Discussion
Cross-referencing our
algorithm’s lesion volume differences with its Dice similarity indices reveals
that it tends to find lesions where there are none, thus overestimating the
size of perfusion lesions. By design, this algorithm will find a perfusion
lesion in all patients who have any appreciable signal in thresholded perfusion
images that occupies the same vascular territory as a DWI infarct. Such
overestimation is not unprecedented: commercially available software generally tends
to overestimate lesion volumes as well.6 Thus, it is of interest to evaluate
how well our algorithm performs relative to others on the market.
Volumetrically, our algorithm overestimates lesion volumes less than Perfscape
for all perfusion maps examined, and it overestimates less than do PMA and
Stroketool for Tmax-4s, MTT-5s, and MTT-6s. Our algorithm’s greater performance
is likely a consequence of the fact that it was developed specifically to
estimate perfusion lesions, whereas the tools used in Perfscape, PMA and
Stroketool were added later on in the programs’ development. One shortcoming of
our automated approach to estimating perfusion lesions, however, is its reliance
on manually delineated DWIs. Future research will focus on either automating
the analysis of DWIs or eliminating this dependence. We are currently in the
process of validating this algorithm with BOLD delay data from a similarly
large patient cohort. Thus, while there remains room for improvement and
further comparisons to be done, this algorithm is promising.Conclusion
Here, we present a viable algorithm to automate the analysis of perfusion images. While it is limited by its reliance on manually delineated DWI, it generally performs better at delineating perfusion lesions on DSC-MRI than competing programs. Given that the European Medicines Agency has recommended the suspension of gadolinium-based contrasts,7 used in DSC-MRI8 but not BOLD delay, this algorithm has the potential to be useful in future clinical practice.Acknowledgements
No acknowledgement found.References
1 Khalil A, Ostwaldt A, Nierhaus T, et al. Relationship Between Changes in the Temporal Dynamics of the Blood-Oxygen-Level-Dependent Signal and Hypoperfusion in Acute Ischemic Stroke. Stroke. 2017;48(4):925-931.
2 Hotter B, Pittl S, Ebinger M, et al. Prospective study on the mismatch concept in acute stroke patients within the first 24 h after symptom onset - 1000Plus study. BMC Neurology. 2009;9(1):60.
3 Galinovic I, Ostwaldt T, Soemmer C, et al. Automated vs manual delineations of regions of interest-a comparison in commercially available perfusion MRI software. BMC Medical Imaging. 2012;12(1):16.
4 Olivot J, Mlynash M, Thijs V, et al. Optimal Tmax threshold for predicting penumbral tissue in acute stroke. Stroke. 2009;40(2):469-475.
5 Dice, L. Measures of the amount of ecologic association between species. Ecology. 1945;26(3):297-302.
6 Galinovic I, Brunecker P, Ostwaldt A, et al. Fully automated postprocessing carries a risk of substantial overestimation of perfusion deficits in acute stroke magnetic resonance imaging. Cerebrovascular diseases. 2011;31(4):408-413.
7 European Medicines Agency. PRAC concludes assessment of gadolinium agents used in body scans and recommends regulatory actions, including suspension for some marketing authorisations [Press Release]. March 10, 2017. http://www.ema.europa.eu/docs/en_GB/document_library/Press_release/2017/03/WC500223209.pdf. Accessed September 29, 2018.
8 Copen W, Schaefer P, and Wu O. MR perfusion imaging in acute ischemic stroke. Neuroimaging Clinics. 2011;21(2):259-283.
Figures