2453
SEGUE Unwraps MRI Phase Images Acquired in Mouse Brains at 9.4 Tesla Faster than PRELUDE1Department of Medical Physics and Biomedical Engineering, University College London, London, United Kingdom, 2The Royal Marsden NHS Foundation Trust, London, United Kingdom
Synopsis
MRI phase images are increasingly used for Susceptibility Mapping or distortion correction. Spatial phase unwrapping is crucial but challenging: the computation time of PRELUDE, the current gold-standard method for robust, 3D unwrapping, increases rapidly with higher field strengths and longer echo times. A new method we have developed, SEGUE, produces similar results to PRELUDE in multi-echo brain and head-and-neck images, 1.6 to 83 times faster, but SEGUE has not been tested in pre-clinical high-field-strength phase images. Here, we show that SEGUE is similarly accurate and up to 4 times faster than PRELUDE in mouse brain images at 9.4 Tesla.
Purpose
The phase component of the complex MR signal is increasingly used in a wide range of research studies. Its applications include susceptibility mapping (QSM)1-3, and distortion correction in functional4-9 and diffusion10-12 MRI. However, the MRI phase is only defined between 0 and 2π, resulting in phase wraps. The computation time (Tc) of the gold standard method for robust, spatial phase unwrapping in 3D, Phase Region Expanding Labeller for Unwrapping Discrete Estimates13-15 (PRELUDE), increases rapidly at higher field strengths and later echoes. Previously we have shown that our accelerated phase unwrapping method, Speedy rEgion-Growing algorithm for Unwrapping Estimated phase16 (SEGUE), can unwrap human brain, head-and-neck, and pelvic images much faster than PRELUDE with similar accuracy. However, MRI in animal models often uses higher field strengths and suffers from many more phase wraps so there is a need for efficient unwrapping methods to accelerate phase-based pre-clinical MRI research. Therefore, we compared PRELUDE and SEGUE using images acquired in 8 mouse brains at 9.4 T.Methods
Multi-echo complex images had been previously acquired17-19 for a study aiming to characterise susceptibility artifacts in the mouse brain. Eight C57BL/6 ten-week-old male mice were scanned in vivo using an Agilent 9.4 T VNMRS 20 cm horizontal-bore system, a 72-mm-diameter birdcage radiofrequency (RF) coil for RF transmission, a mouse brain surface coil array (RAPID, Germany) for signal detection, a multi-echo gradient-echo sequence (TE1 = 1.38 ms, ΔTE = 2.64 ms, 12 echoes), a 150 μm isotropic resolution, a field-of-view of 16.5×15×15 cm3, a flip angle of 15°, and 5 signal averages. Prior to imaging, the mice were secured in a cradle under anaesthesia with 1-2% isoflurane in 100% oxygen.
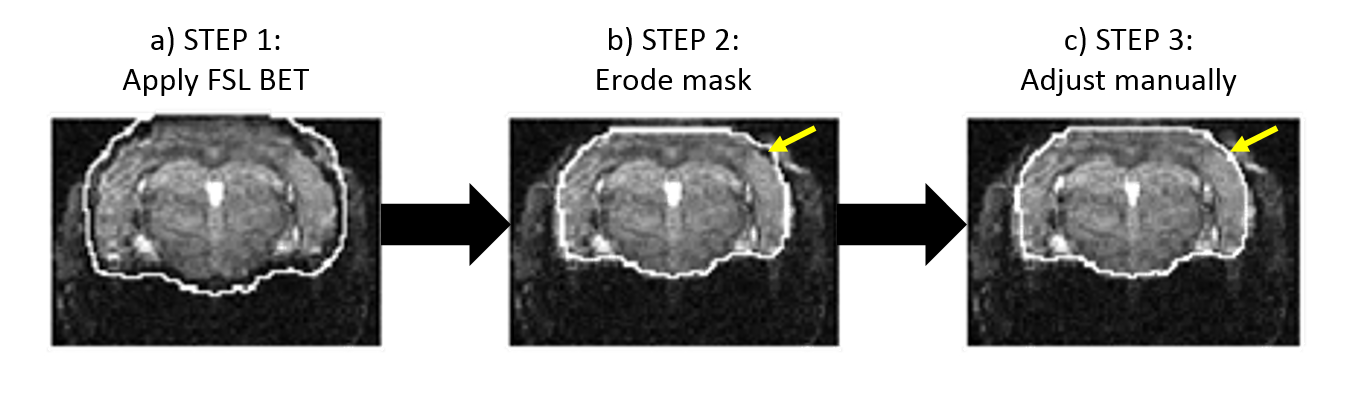
Instead of combining the phase images from the two channels, all 16 images (data from 8 mice using 2 channels) were unwrapped using both PRELUDE and SEGUE and the results were compared using: 1. Tc on a 64-bit Ubuntu Virtual Machine with a 3.5 GHz Processor and 16 GB RAM, 2. Histograms of the unwrapped phase (SEGUE - PRELUDE) difference images within the brain mask, 3. The percentage of voxels with differing phase values in the PRELUDE and SEGUE results. Brain masks were obtained using the pipeline in Figure 1 for all 8 mouse brains. First, FSL BET20 was applied to the last-echo magnitude images (Figure 1a). This provided a good estimation of the shape of the brain, but generally overestimated its volume. Therefore, the BET-provided masks were eroded in 3D (Figure 1b) 4 to 7 times (determined individually for each mouse brain). Finally, the masks were manually adjusted in ITK-SNAP21-22 (Figure 1c).
Results and Discussion
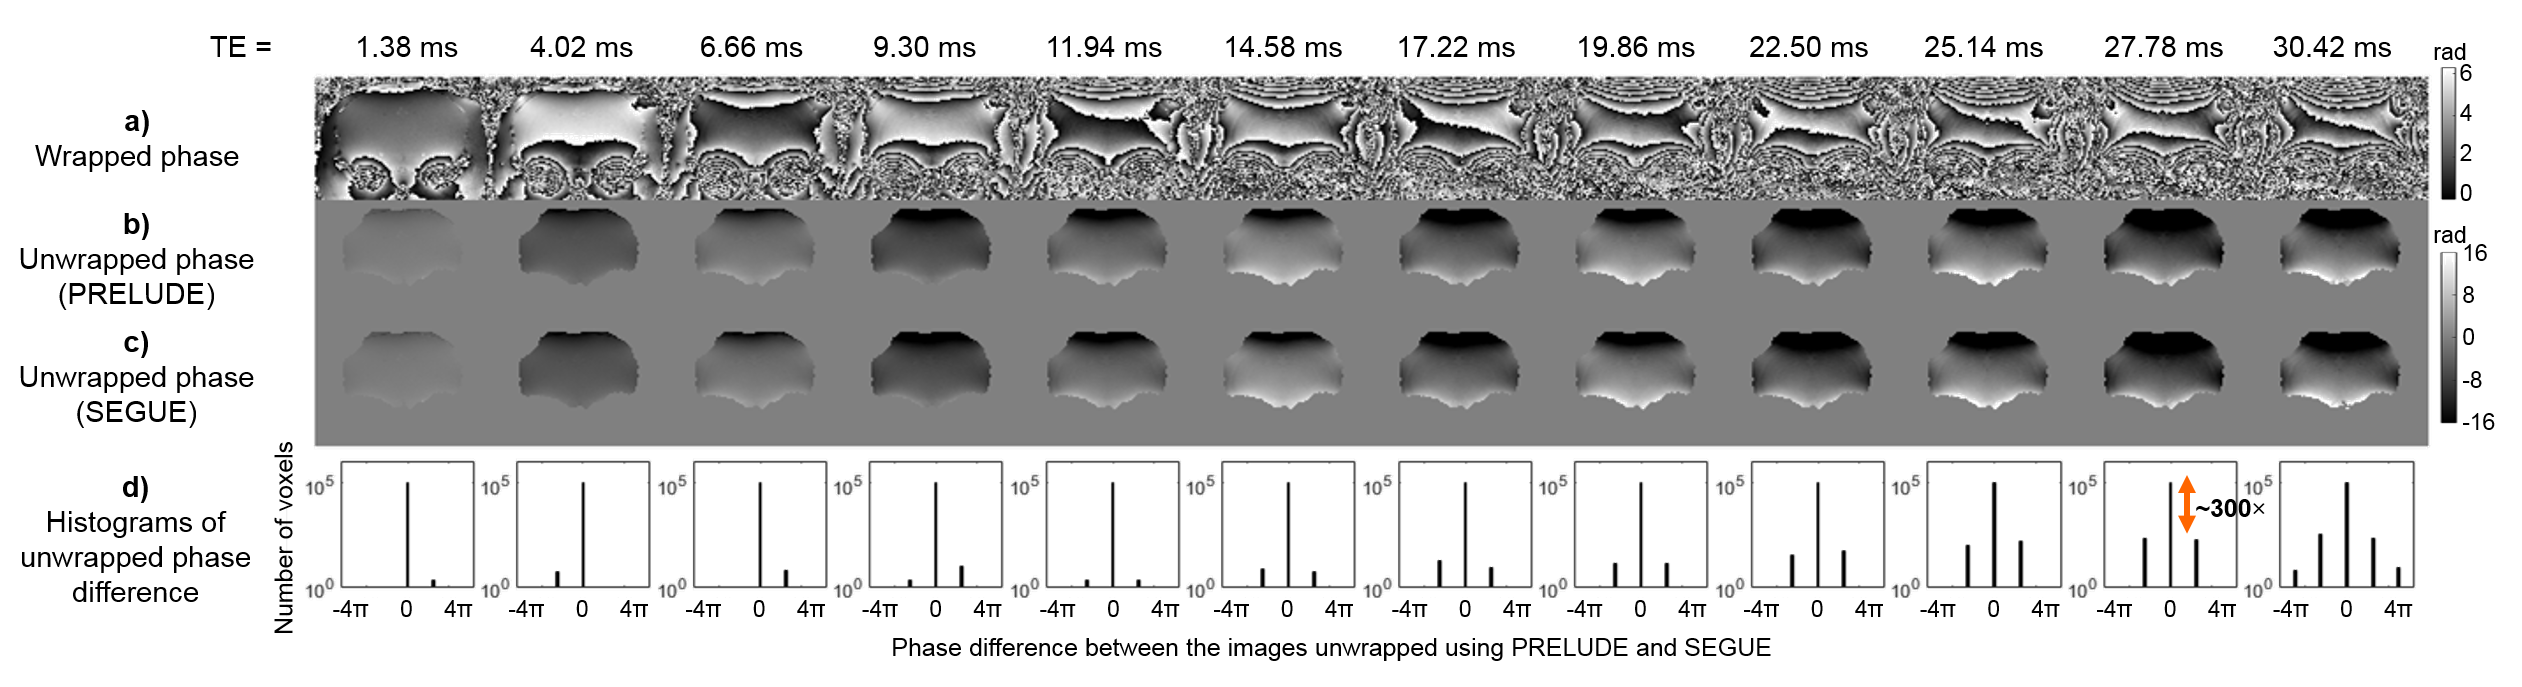
Figure 2 shows wrapped phase images (Figure 2a), and phase images unwrapped using PRELUDE (Figure 2b) or SEGUE (Figure 2c) in a coronal slice of a representative mouse brain across all 12 echoes. The PRELUDE and SEGUE results looked identical in each case. Figure 2d shows the histograms of the 3D difference images (SEGUE - PRELUDE) for all echoes. Even at echo times (TEs) longer than 25 ms, there were 300 times more voxels with identical unwrapped phase values than voxels with a 2π phase difference between the PRELUDE and SEGUE results (orange double arrow). This ratio was even larger (about 10,000) for TE<20 ms.
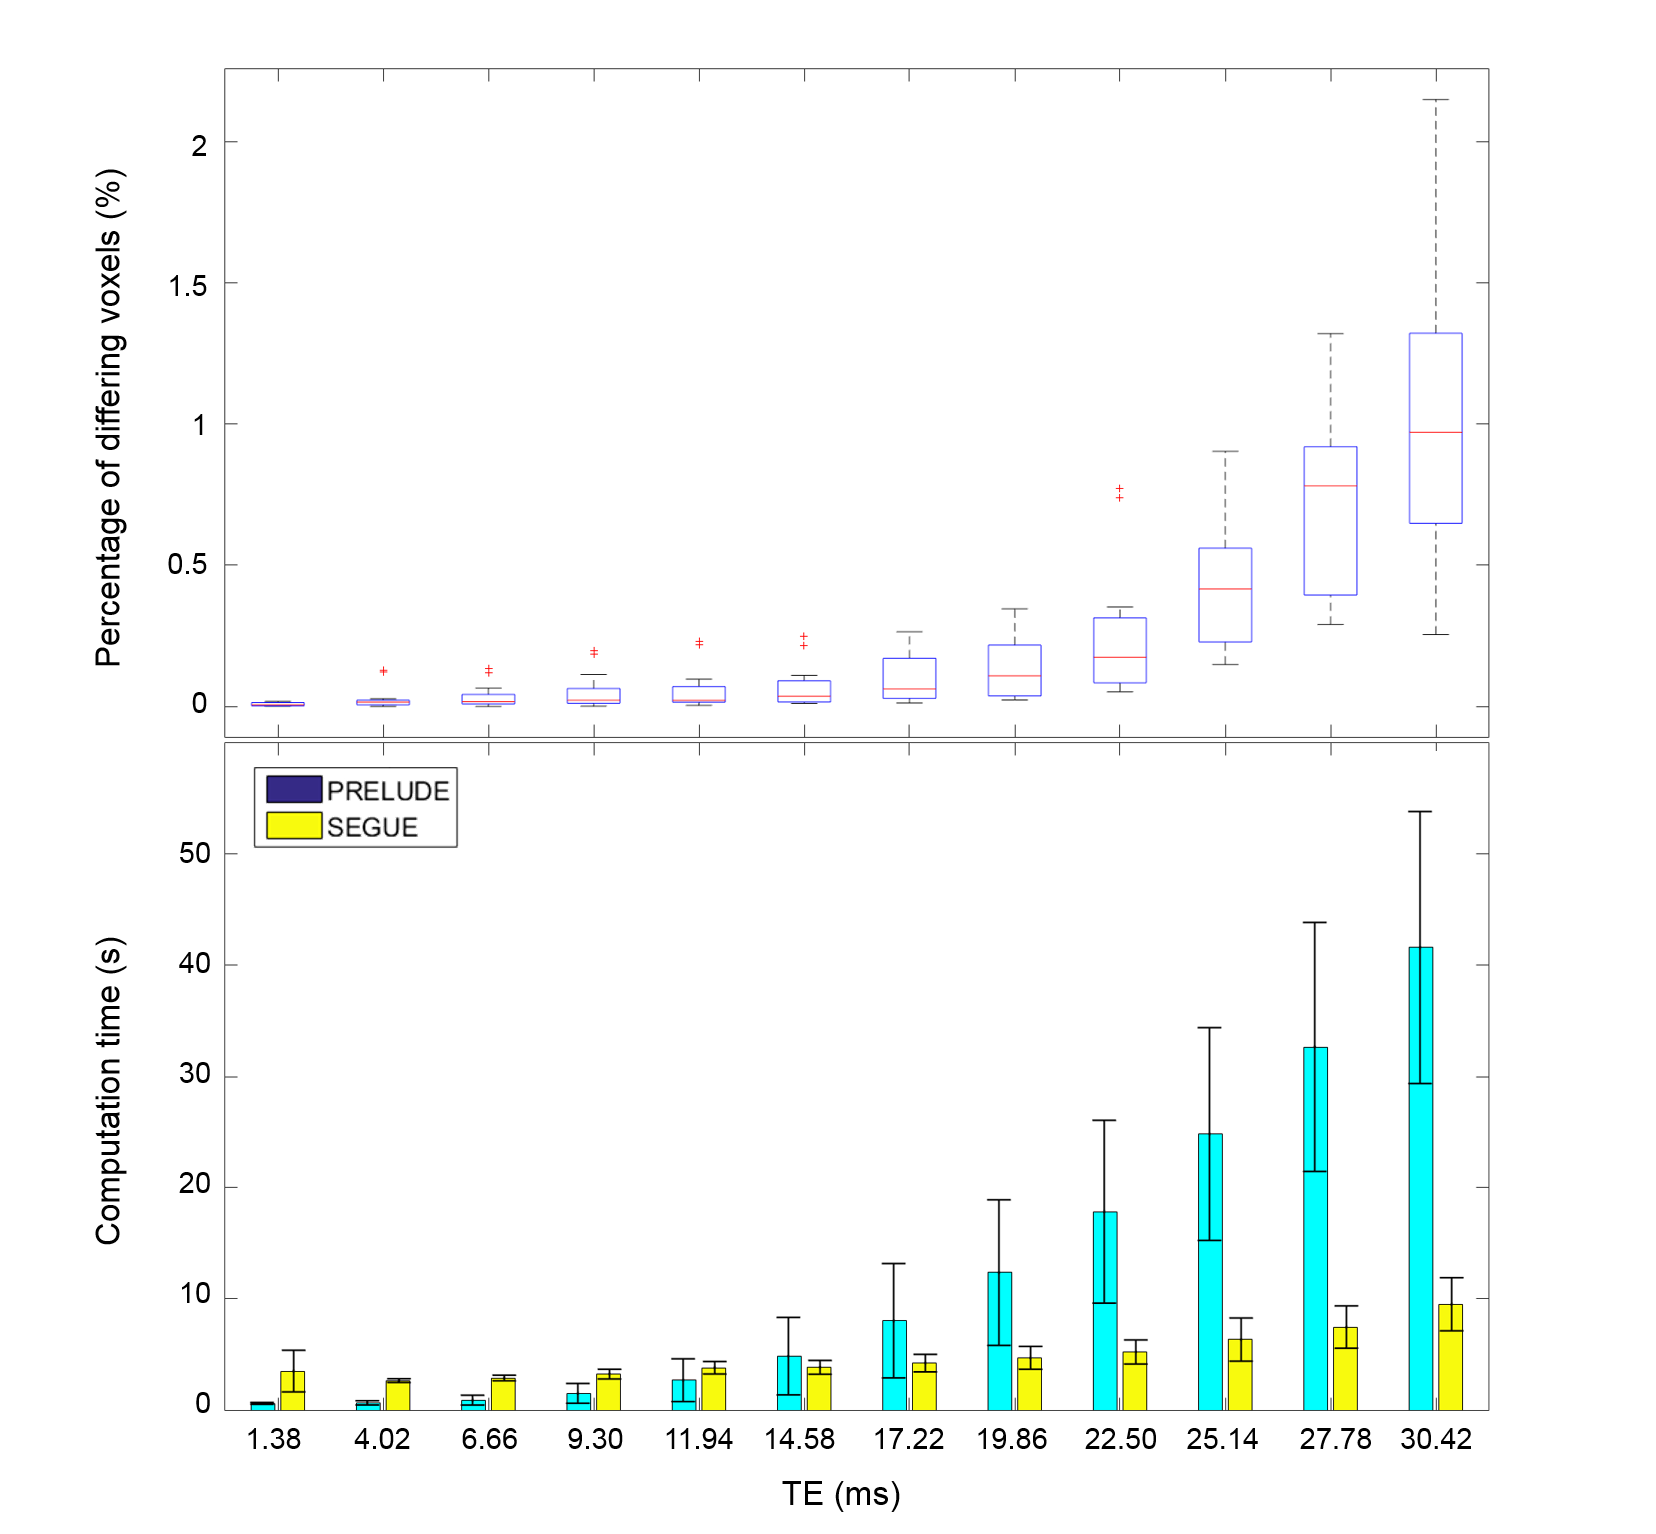
Figure 3 shows the percentage of voxels with differing phase values between the PRELUDE and SEGUE results, and the computation time of both PRELUDE and SEGUE as a function of TE. For TE<20 ms, the percentage of differing voxels was very small (<0.1% on average and <0.3% even in the most extreme cases). For TE>20 ms, the percentage of differing voxels significantly increased with the echo time, but even at TE=30.42 ms (last echo), it was <1% on average and <2% in the most extreme examples. While PRELUDE was faster than SEGUE initially (for TE<10 ms), its computation time (Tc) rapidly increased with the echo time reaching 40 s on average for the last-echo phase images. In contrast, the Tc of SEGUE barely increased with the echo time, stayed below 10 s for all echoes, and was 2 to 4 times faster than PRELUDE for TE>15 ms.
Conclusions
SEGUE could unwrap brain images of mice acquired at 9.4 T with a similar accuracy to PRELUDE. PRELUDE’s computation time rapidly increased towards later echoes where SEGUE was 2 to 4 times faster. Therefore SEGUE is a feasible alternative to PRELUDE in mice and is especially useful for images acquired with long echo times. This should help accelerate phase-based pre-clinical MRI research at high field strengths such as QSM in animal models.Acknowledgements
We thank James O’Callaghan and Simon Walker Samuel for MRI data acquisition.
Anita Karsa's work was supported by the EPSRC-funded UCL Centre for Doctoral Training in Medical Imaging (EP/L016478/1) and the Department of Health's National Institute for Health Research funded Biomedical Research Centre at University College London Hospitals.
References
1. Shmueli, Karin, et al. "Magnetic susceptibility mapping of brain tissue in vivo using MRI phase data." Magnetic resonance in medicine 62.6 (2009): 1510-1522.
2. Reichenbach, J. R., et al. "Quantitative susceptibility mapping: concepts and applications." Clinical neuroradiology 25.2 (2015): 225-230.
3. Eskreis‐Winkler, Sarah, et al. "The clinical utility of QSM: disease diagnosis, medical management, and surgical planning." NMR in Biomedicine 30.4 (2017).
4. Klein, Tilmann A., Markus Ullsperger, and Gerhard Jocham. "Learning relative values in the striatum induces violations of normative decision making." Nature Communications 8 (2017).
5. Brooks, Jonathan CW, Wendy-Elizabeth Davies, and Anthony E. Pickering. "Resolving the Brainstem Contributions to Attentional Analgesia." Journal of Neuroscience 37.9 (2017): 2279-2291.
6. Cardoso, Pedro Lima, et al. "The clinical relevance of distortion correction in presurgical fMRI at 7T." NeuroImage (2016).
7. Branco, Paulo, Daniela Seixas, and São Luís Castro. "Temporal reliability of ultra-high field resting-state MRI for single-subject sensorimotor and language mapping." NeuroImage (2016).
8. Ashburner, John. "Preparing fMRI Data for Statistical Analysis." fMRI Techniques and Protocols (2016): 155-181.
9. Ahveninen, Jyrki, et al. "Intracortical depth analyses of frequency-sensitive regions of human auditory cortex using 7TfMRI." NeuroImage 143 (2016): 116-127.
10. Shen, Kaikai, et al. "A spatio-temporal atlas of neonatal diffusion MRI based on kernel ridge regression." Biomedical Imaging (ISBI 2017), 2017 IEEE 14th International Symposium on. IEEE, 2017.
11. Herting, Megan M., et al. "Longitudinal changes in pubertal maturation and white matter microstructure." Psychoneuroendocrinology 81 (2017): 70-79.
12. Rajagopalan, Venkateswaran, and Erik P. Pioro. "Differential involvement of corticospinal tract (CST) fibers in UMN-predominant ALS patients with or without CST hyperintensity: A diffusion tensor tractography study." NeuroImage: Clinical 14 (2017): 574-579.
13. Jenkinson, Mark. "Fast, automated, N‐dimensional phase‐unwrapping algorithm." Magnetic resonance in medicine 49.1 (2003): 193-197.
14. FSL Prelude: http://fsl.fmrib.ox.ac.uk/fsl/fslwiki/FUGUE
15. Robinson, Simon Daniel, et al. "An illustrated comparison of processing methods for MR phase imaging and QSM: combining array coil signals and phase unwrapping." NMR in Biomedicine 30.4 (2017).
16. Karsa, A. and Shmueli, K. “SEGUE: a Speedy rEgion-Growing algorithm for Unwrapping Estimated phase.” In Proceedings of the 26th Annual Meeting of the ISMRM, Paris (2018): p. 666
17. Goodburn, R., N. Powell, J. O'Callaghan, S. Walker-Samuel, and K. Shmueli. "Characterising and Modelling Susceptibility Artifacts in the Mouse Brain at 9.4 T." In Proceedings of the 24th Annual Meeting of the ISMRM, Singapore. (2016): p. 4291
18. O’Callaghan, J., et al. "In vivo quantitative susceptibility mapping of the mouse brain at 9.4 T: A new contrast mechanism to investigate genetic models of neurodegeneration." Proc Intl Soc Mag Reson Med. 22 (2014).
19. O'Callaghan, J., H. Holmes, N. Powell, Jack A. Wells, Ozama Ismail, Ian F. Harrison, Bernard Siow et al. "Tissue magnetic susceptibility mapping as a marker of tau pathology in Alzheimer's disease." Neuroimage 159 (2017): 334-345.
20. Smith, Stephen M. "Fast robust automated brain extraction." Human brain mapping 17.3 (2002): 143-155.
21. Yushkevich, Paul A., et al. "User-guided 3D active contour segmentation of anatomical structures: significantly improved efficiency and reliability." Neuroimage 31.3 (2006): 1116-1128.
22. ITK-SNAP: www.itksnap.org
Figures