2450
Integrated image-space and Fourier-space analyses for unwrapping phase images of low signal-to-noise ratio1Department of Biomedical Engineering, University of Arizona, Tucson, AZ, United States, 2Department of Radiology, University of Pennsylvania, Philadelphia, PA, United States
Synopsis
We report a new post-processing procedure that integrates image-space and Fourier-space data analyses to improve the accuracy and reliability of phase unwrapping for MRI data of low signal-to-noise ratio (SNR).
Our data demonstrate that the new phase-unwrapping method outperforms the conventional procedures in critical brain regions (e.g., near the air-tissue interfaces), and should prove valuable for studies that require accurate measurements of MRI phase values, such as quantitative susceptibility mapping (QSM), B0 field mapping, and temperature mapping.
Introduction
Phase unwrapping is important for many MRI studies including field inhomogeneity mapping, EPI distortion correction, quantifying blood flow velocity, temperature mapping, and quantitative susceptibility mapping.
However, it is not always easy to accurately unwrap MRI phases using existing pure image-space unwrapping procedures, particularly when the SNR is low and the phase gradient is large. To address these challenges, we report a new procedure that integrates image-space and Fourier-space analyses to improve the accuracy and robustness of phase unwrapping for low-SNR MRI data.
The new phase unwrapping method
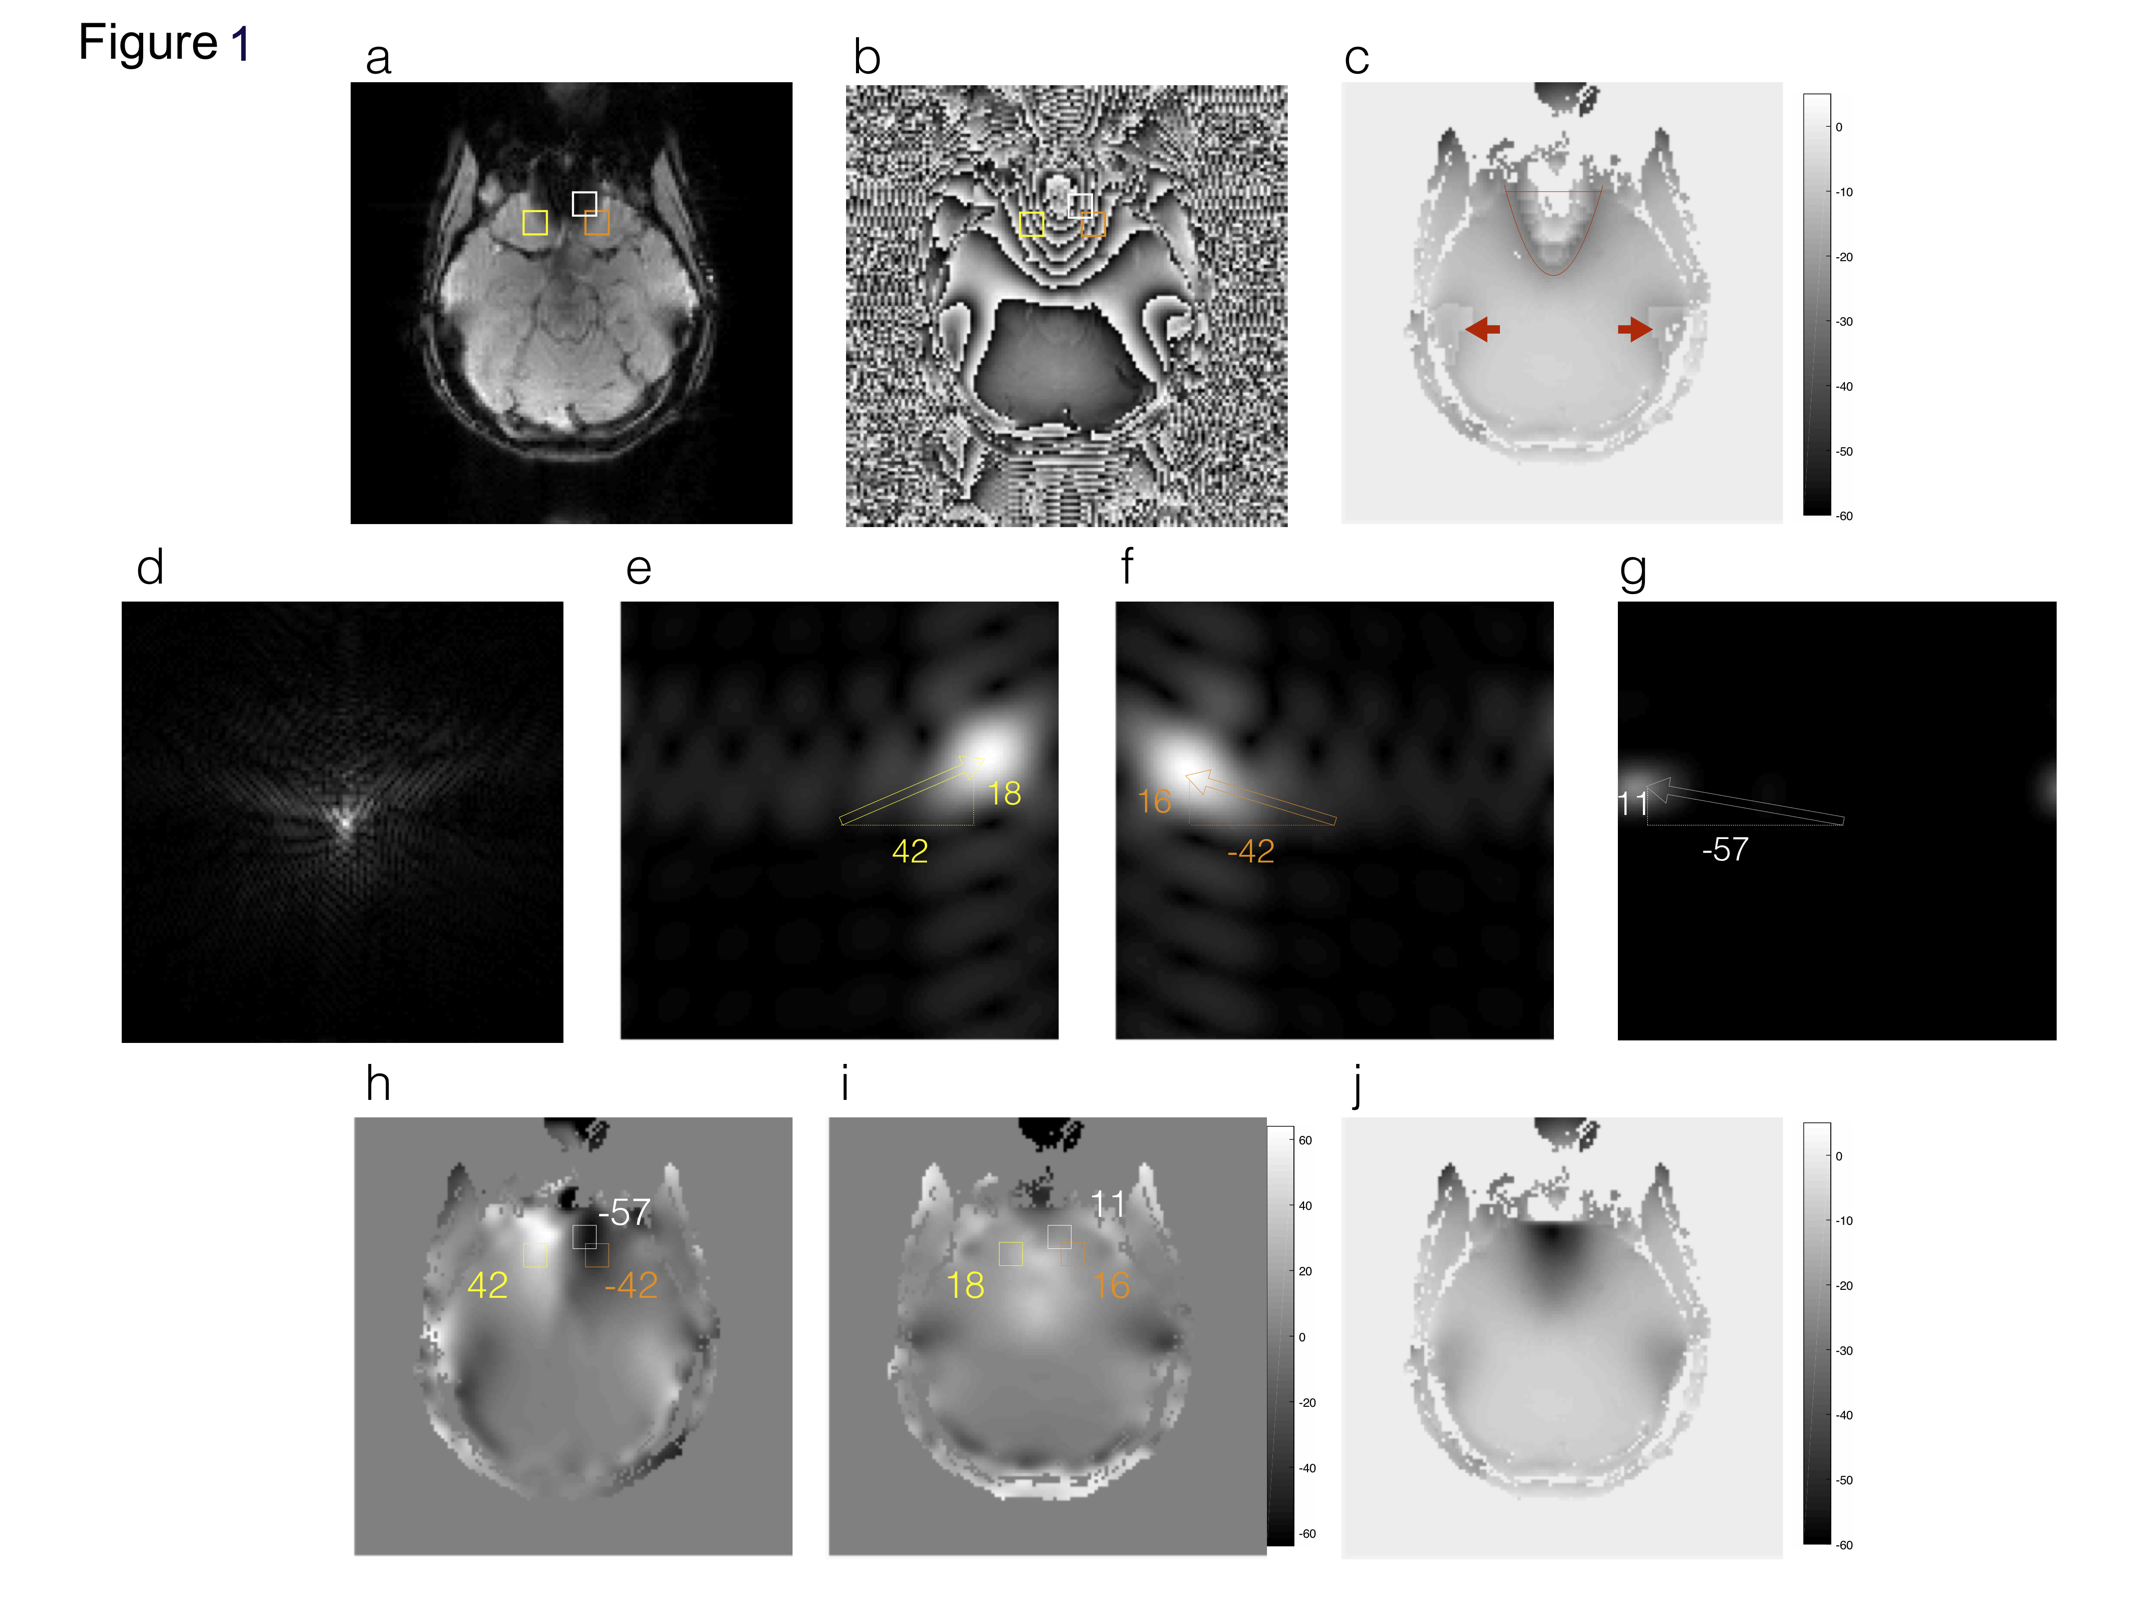
Our new method is illustrated in Figure 1, with T2*-weighted MRI magnitude and phase shown in Figures 1a and 1b, respectively. Because of the local field gradients, the signals in three ROIs are low (Figure 1a) and the phase wraparounds are pronounced (Figure 1b), making it challenging to unwrap phase with conventional procedures (Figure 1c).
In order to find the correspondence between image-space voxels and Fourier-space (Figure 1d) energy distribution, we multiplied the input complex image with a mask to reveal the Fourier-space energy peaks corresponding to only signals within the chosen image-space mask. For example, Figures 1e, 1f and 1g show the Fourier-space data corresponding to signals within the yellow, orange and white ROIs (see Figure 1a). From these ROI-masked Fourier-space datasets, we measure Fourier-space energy displacements along the x direction (e.g., by +42, -42, and -57 kx steps for yellow, orange and white ROIs, respectively) and y direction (e.g., by +18, +16 and +11 ky steps for yellow, orange and white ROIs, respectively). By repeating this process for all possible mask locations within the full FOV, the maps showing the Fourier-space energy displacement along x and y directions were generated (Figures 1h and 1i). The Fourier-space energy displacement maps were then converted to phase gradient maps (Δθx and Δθy) with Equations 1 and 2 (Nx and Ny: numbers of voxels along x and y directions):
Δθx(x,y)=Δkx(x,y)*2π/Nx [1]
Δθy(x,y)=Δky(x,y)*2π/Ny [2]
The phase gradient maps derived from the Fourier-space analysis were then used to improve the accuracy of phase unwrapping in critical brain regions. Specifically, for voxels within the areas where the conventional phase unwrapping was unsuccessful, the correct phase values were calculated with 2D numerical integration that used phase gradients (Equations 1 and 2) and the phase values along the boundary of ROI (e.g., along the red contour of Figure 1c), as shown in Figure 1j.
Experimental verification of the developed method
Our method was evaluated with human brain MRI data obtained from 26 volunteers using gradient-echo EPI (3 Tesla) with 100 averages. The SNR of the averaged images was greater than 50 for the magnitude signals. Unwrapped phase maps were obtained from the high-SNR MRI data using the PRELUDE procedure, and used as the ground truth.
Noise was then mathematically added to the complex-valued data to produce low-SNR data for each of the subjects (with SNR = 2 in the magnitude component). The PRELUDE program was used to unwrap the low-SNR phase images. For noisy MRI data, the PRELUDE method performs reliably in most brain regions but might fail to produce accurate phase values in regions affected by pronounced susceptibility effect. The following steps were performed to unwrap phases of low-SNR MRI data. First, phase gradient maps were calculated from the complex-valued MRI with mathematically added noise using Fourier-domain analyses. Second, the phase gradient maps obtained from step 1 were compared with the phase gradient maps calculated from PRELUDE-unwrapped phase images (of low SNR), to identify voxels whose phases were not successfully unwrapped by PRELUDE. Third, ROIs containing the corrupted phases were created automatically. Fourth, phase values within critical ROIs were calculated from i) the phase gradient maps from the first step, and ii) PRELUDE-unwrapped phase values (of low-SNR) along the boundary of ROIs, using 2D numerical integration.
Results
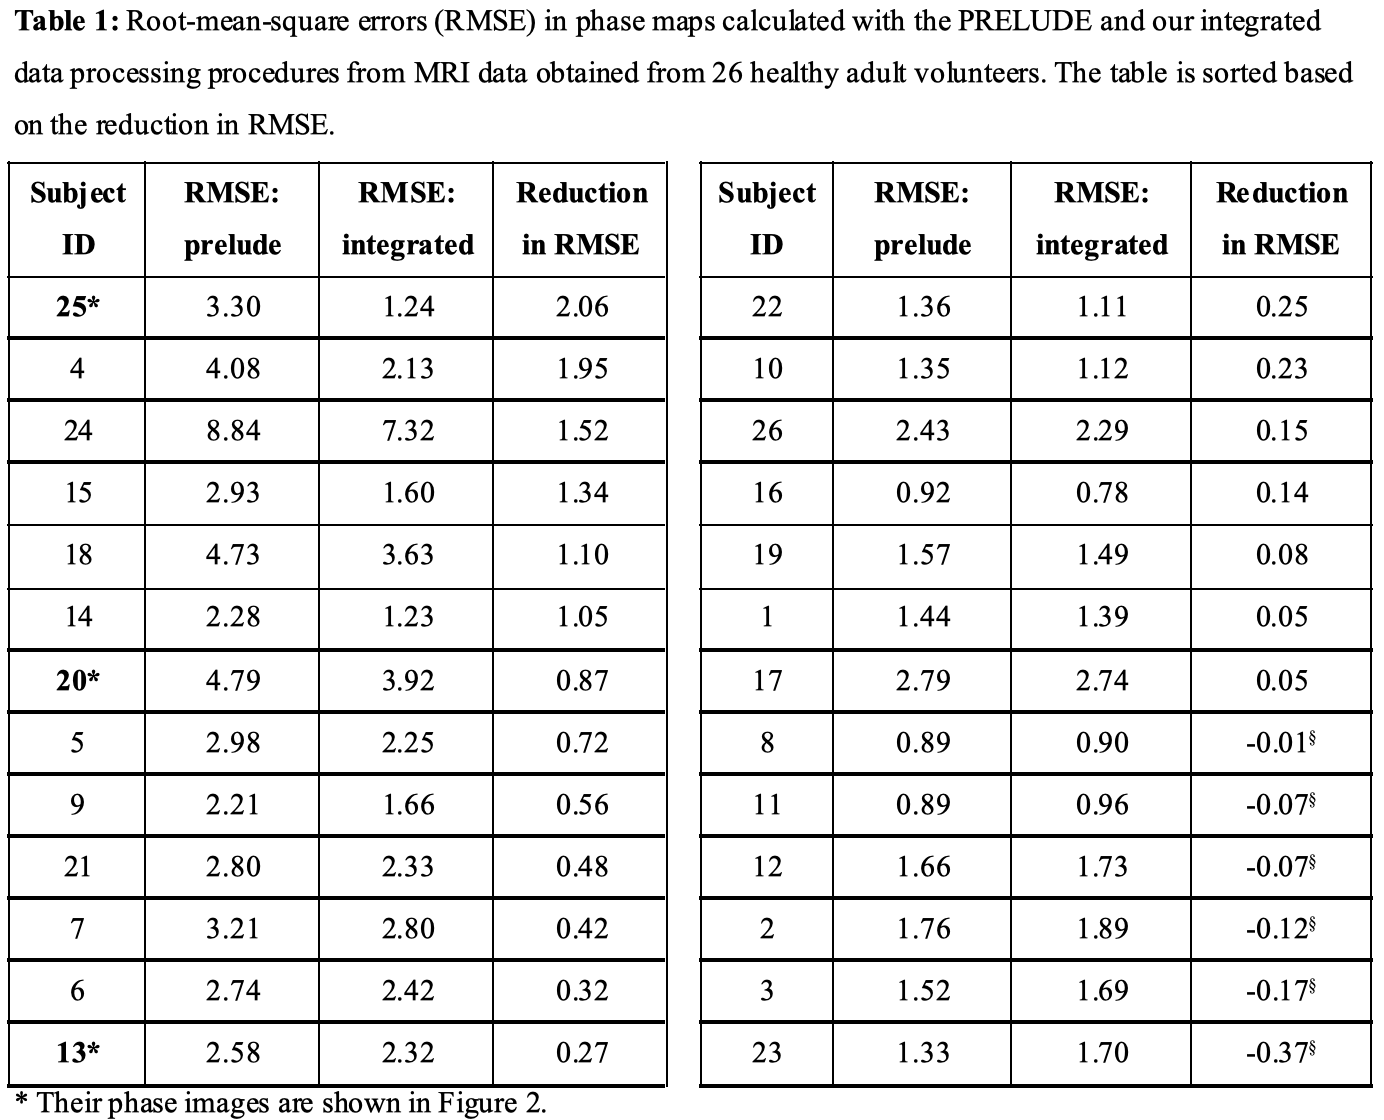
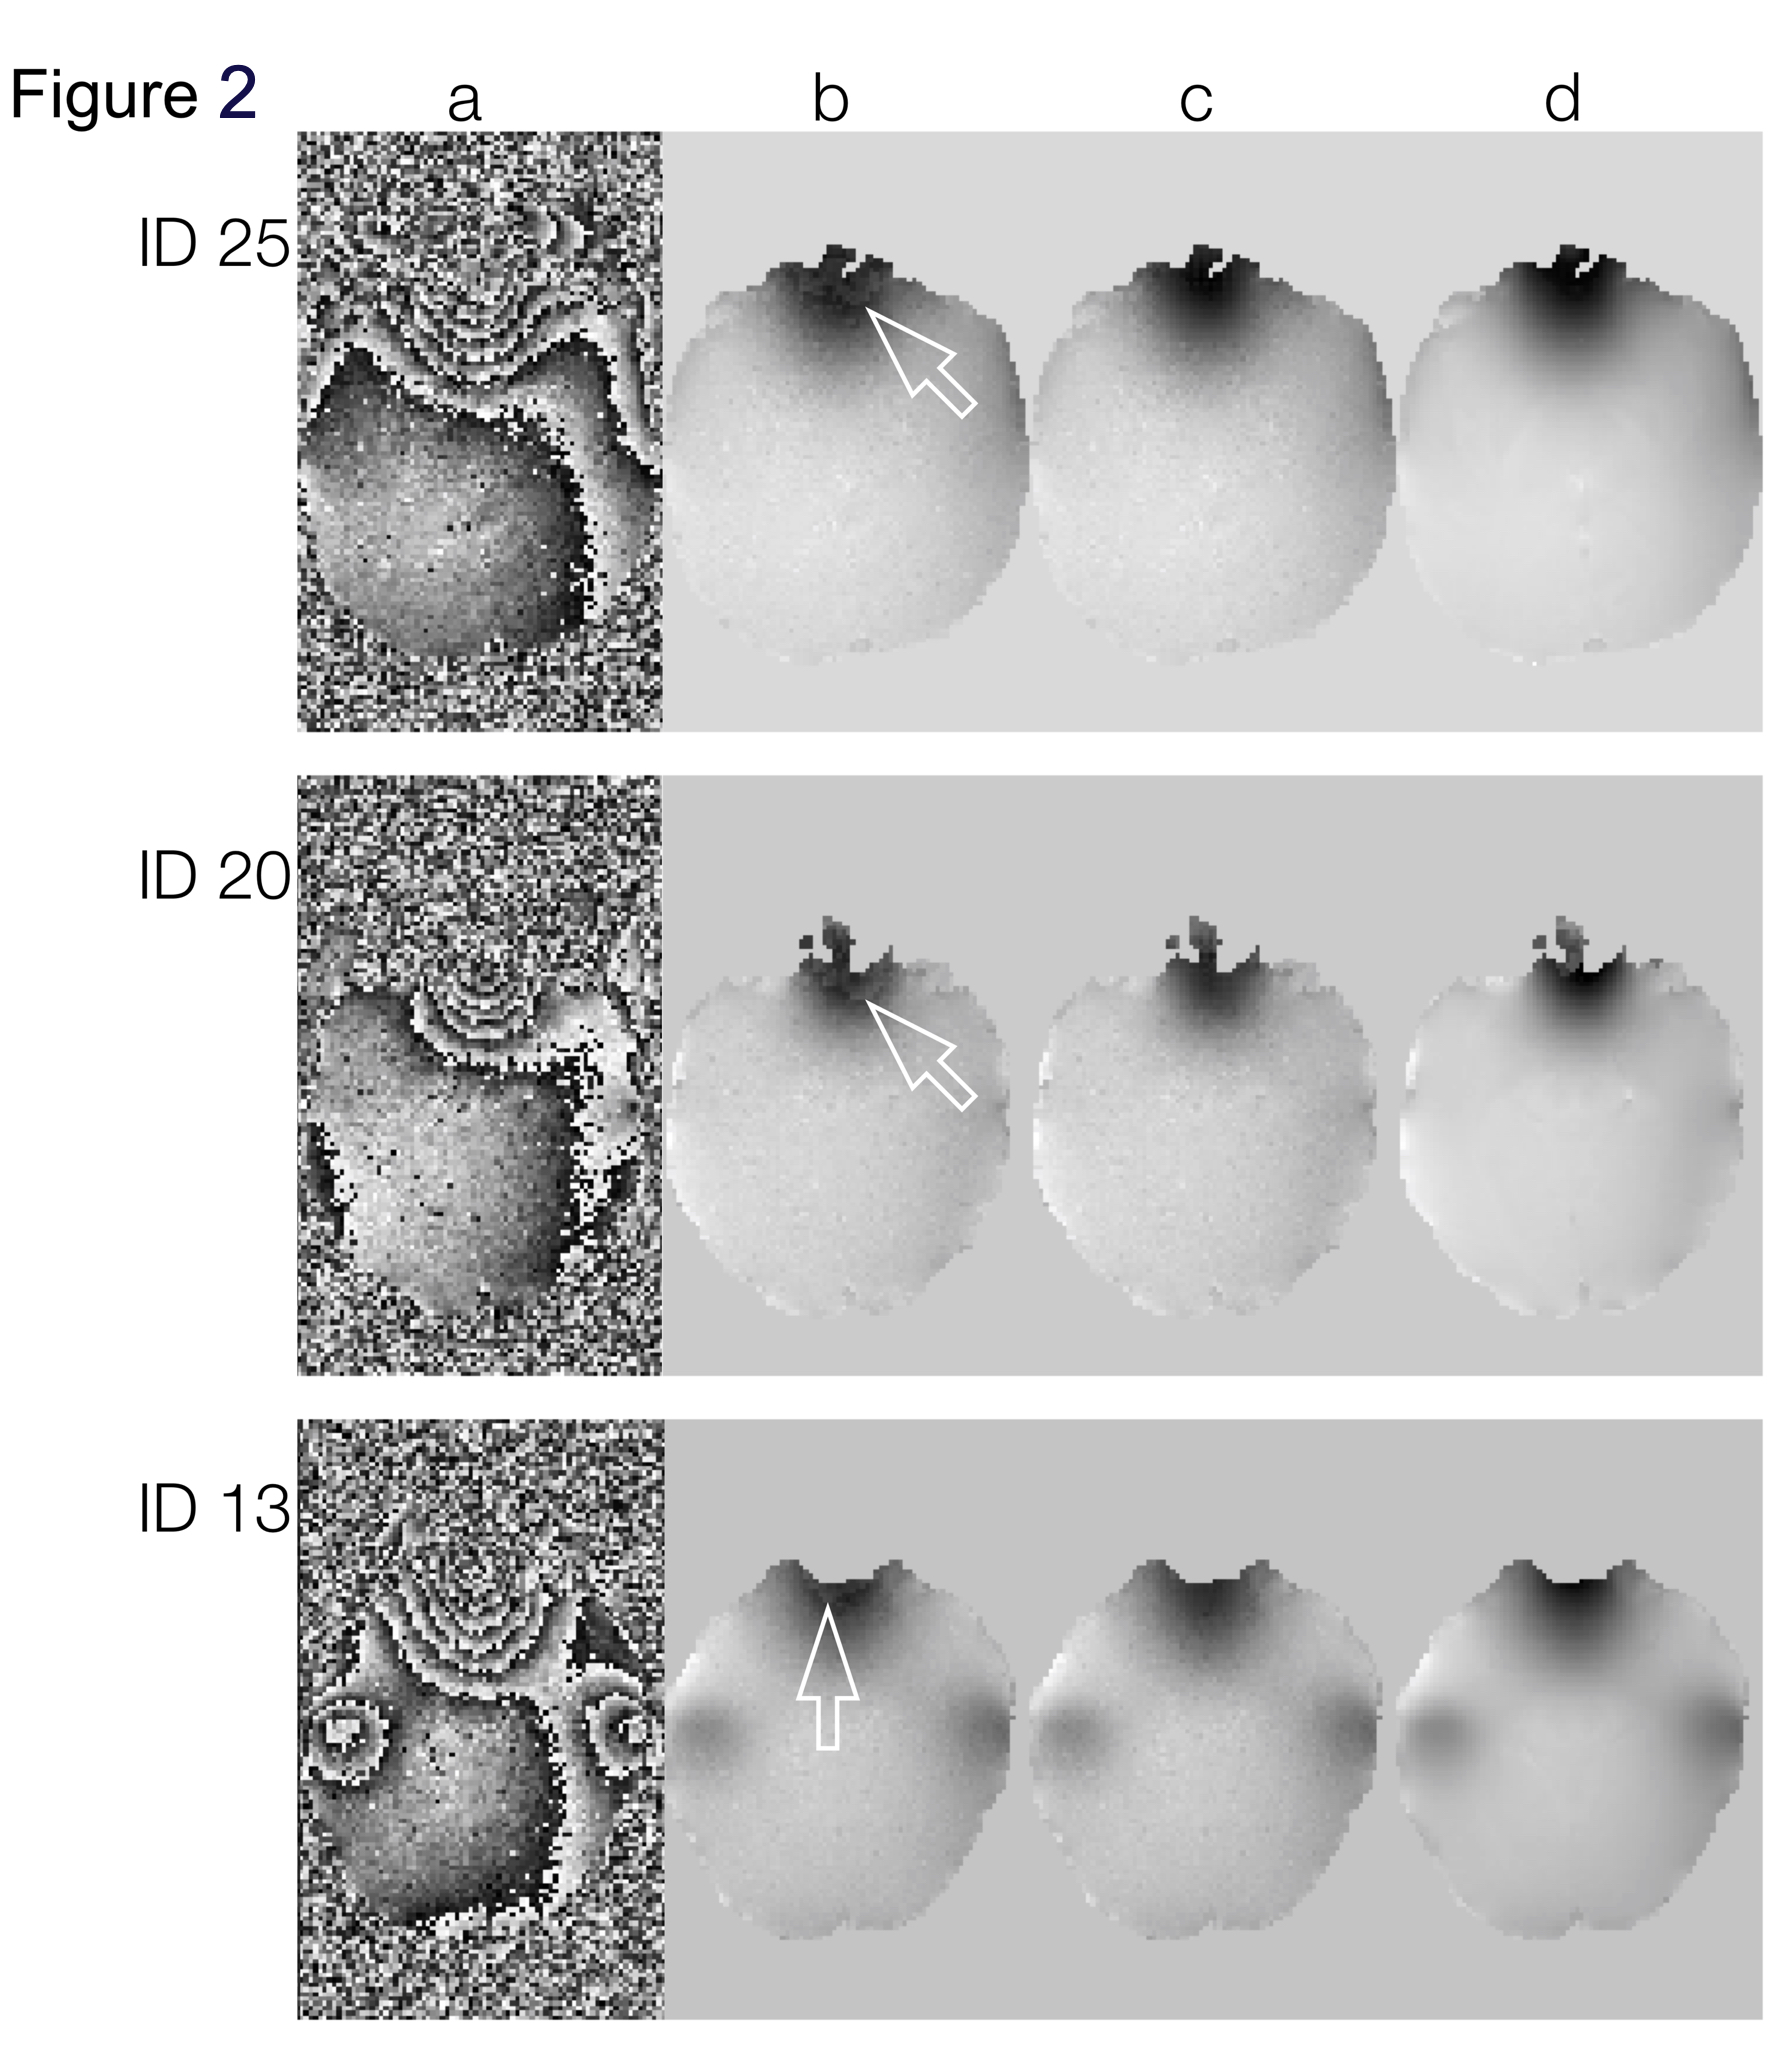
Table 1 lists the root-mean-square errors of phase values, calculated from voxels within the critical frontal brain ROI, in data obtained with the PRELUDE procedure and the new integrated method (sorted according to the reduction of root-mean-square errors achieved with the new method). Figure 2a shows phase data from 3 of the 26 subjects, Figure 2b shows the PRELUDE-unwrapped phase maps, and Figure 2c shows phase images obtained with our integrated phase unwrapping method. It can be seen that the residual wraparound artifacts in the PRELUDE-produced images could be further reduced by our new procedures. Figure 2d shows the ground truth phase images (without mathematically added noise).
In summary, the new procedure that can robustly unwrap MR phase images, even in critical brain regions with low SNR and affected by pronounced susceptibility field gradients.
Acknowledgements
This research was supported by NIH grant R01-NS102220.References
No reference found.Figures