2446
Nonlocal multispectral MRI upsampling for enhanced quality of high-resolution imaging reconstruction1National Institute on Aging (NIA), National Institutes of Health (NIH), Baltimore, MD, United States
Synopsis
High-resolution (HR) image reconstruction, or upsampling, is used widely in MRI post-processing analyses including image segmentation and registration. The nonlocal means (NLM) upsampling approach is simple to implement and has demonstrated excellent performance for HR image reconstruction from low-resolution images. Here, we extend this to incorporate multispectral (MS) data sets in which multiple images are acquired over a variable acquisition parameter. Further, we show that the use of our recently introduced nonlocal estimation of multispectral magnitudes filter for upsampling further enhances the quality of the reconstructed HR images as compared with use of the NLM filter or its MS version.
Purpose
High-resolution (HR) image reconstruction, or upsampling, is used widely in MRI post-processing analyses including image segmentation and registration. However, many of the available upsampling methods are complex to implement, require multiple low-resolution (LR) images, or several tuning parameters.1-3 As a result, these methods are difficult to integrate into routine investigations. In contrast, the nonlocal means upsampling (NLM-US) approach is simple to implement and has shown excellent performance without requiring multiple LR images.3 In this work, we extend the NLM-US method to incorporate the information available in multispectral (MS) datasets, in which multiple images are acquired over a range of a variable acquisition parameter, such as diffusion b-values or echo-times.Methods
Nonlocal multispectral upsampling
The NLM-US approach introduced by Manjón and colleagues3 permits reconstruction of a HR image from its corresponding LR image. Briefly, this method is based on an iterative process that includes two main steps. The first step is the application of the nonlocal means (NLM) filter4 to reduce noise in the original LR image. This leads to the second step of incorporating the subsampling consistency constraint,5 requiring that the downsampled version of the reconstructed HR image must recapitulate the original LR image. These steps are repeated until the difference between successive upsampled images is close to zero.
Several investigations have shown that use of MS datasets improves the performance of the NLM filtering.6 Motivated by this result, here we extend the NLM-US method to the MS case. Specifically, the NLM filter applied in the first step of the NLM-US approach is replaced by its MS version; we will call this method MS-NLM-US. Moreover, we have recently shown that the use of the nonlocal estimation of multispectral magnitude (NESMA) filter results in markedly less blurring and loss of image detail than seen with other filters, including NLM and MS-NLM.6-7 We will refer to this method as NESMA-US.
Analysis
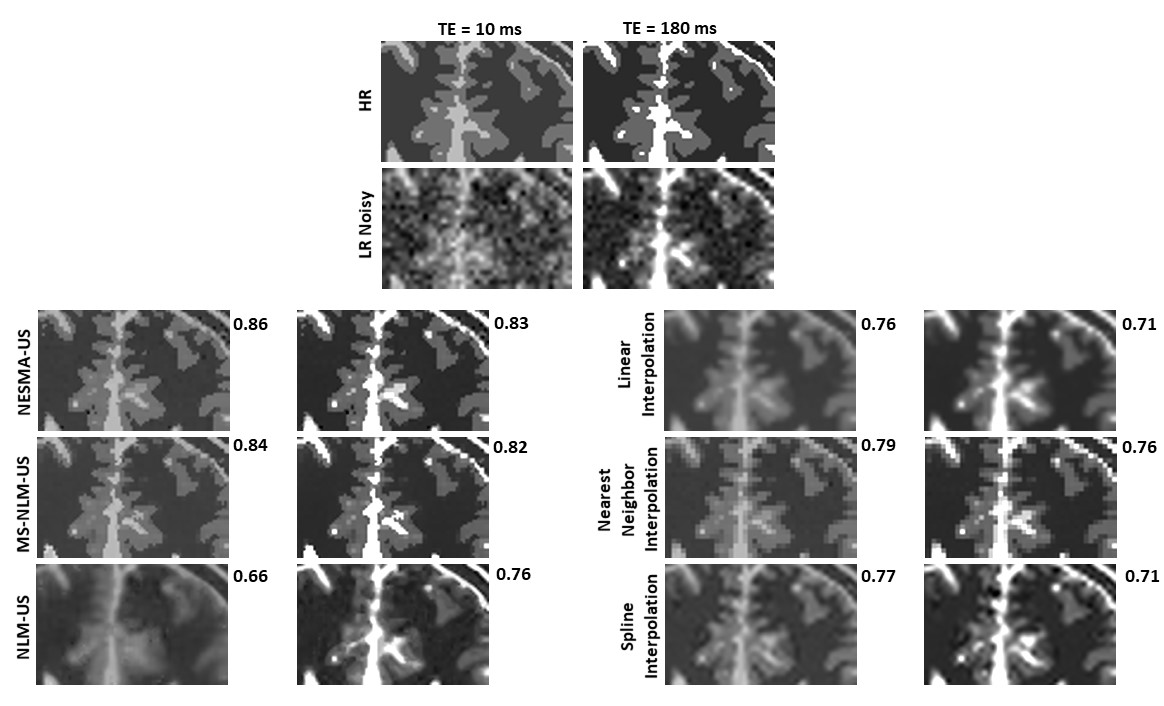
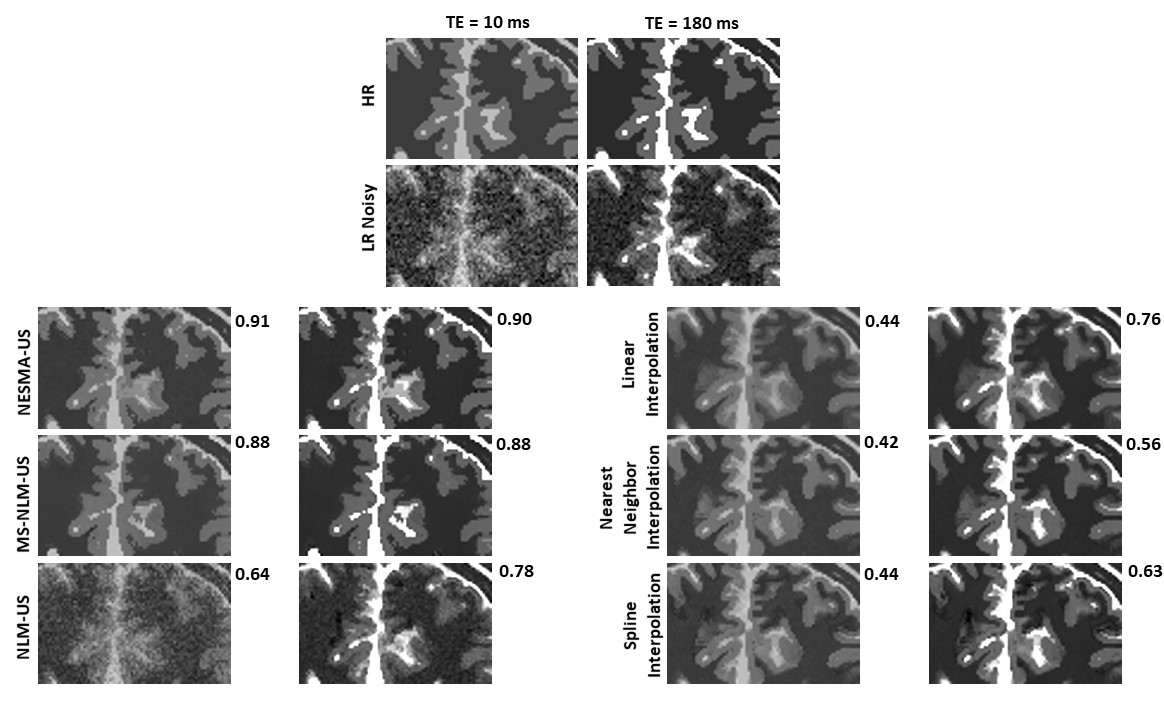
We compared the performance of NLM-US, MS-NLM-US, and NESMA-US on a set of synthetic MS images. Results of these advanced upsampling methods were also compared to those obtained using conventional upsampling methods, namely, the nearest neighbor, linear, and spline interpolations.3 Synthetic 3D T2-weighted brain datasets were obtained from BrainWeb8-10 from which a T2 map was generated. Representative T2 values for white matter, gray matter, and cerebrospinal fluid were chosen as 60 ms, 85 ms, and 180 ms, respectively. 3D T2-weighted images were then generated with twenty values of TE ranging uniformly from 10 ms to 200 ms in order to create noise-free reference MS HR images. From these images, two versions of MS LR images were created. For the first, the reference MS HR images were downsampled by a factor of two in each of three spatial dimensions. For the second version, the reference MS HR images were downsampled by a factor of three in the third spatial dimension, that is, in the slice direction. Gaussian noise was subsequently added to create noisy MS LR images. These images were then upsampled using each of the methods described above to create upsampled MS HR images. In addition to visual inspection, the structural similarity (SSIM) index value was calculated at each TE between the reference and upsampled MS HR images.
Results and Discussion
Figures 1 and 2 show the results of upsampling the noisy MS LR datasets using each of the methods described above after downsampling the reference MS HR images by a factor of 2 in each of the three spatial dimension (Fig. 1) or by a factor of 3 in the third spatial dimension (Fig. 2). In each case, results are shown for two different TEs. Visual inspection and SSIM values indicate that, in all cases, the use of the MS information enhances the quality of the upsampling. In fact, of all methods evaluated, the MS methods, that is, MS-NLM-US and NESMA-US, provided the best performance with less image blurring and the highest SSIM values. Of these two, NESMA-US exhibited superior performance.Conclusions
We find that the use of MS information leads to improved image upsampling, with the NESMA-US approach being superior to all of the other conventional and advanced upsampling methods evaluated. Additional numerical and in-vivo analyses are required for further validation. This work is currently in progress.Acknowledgements
The work was supported by the Intramural Research Program of the National Institute on Aging of the National Institutes of Health.References
1. Carmi R, Liu S, Alon N, et al. Resolution enhancement in MRI. Magn Reson Imaging. 2006;23:133-154.
2. Ebrahimi M, Vrscay E. Solving the inverse problem of image zooming using “self-examples”. Lecture Notes in Computer Science. 2007;4633:117-130.
3. Manjón JV, Coupé P, Buades A, et al. Non-local MRI upsampling. Med Image Anal. 2010; 14:784-792.
4. Buades A, Coll B, Morel JM. A review of image denoising algorithms, with a new one. SIAM Journal on Multiscale Modeling and Simulation. 2005;4(2):490-530.
5. Banerjee J, Jawahar CV. Super-resolution of text images using edge-directed tangent field. The Eighth IAPR International Workshop on Document Analysis Systems. 2008;76-83.
6. Bouhrara M, Bonny JM, Ashinsky BG, et al. Noise estimation and reduction in magnetic resonance imaging using a new multispectral nonlocal maximum-likelihood filter. IEEE Trans Med Imaging. 2017;36:181-193.
7. Bouhrara M, Maring MC, Spencer RG, et al. A simple and fast adaptive nonlocal multispectral filtering algorithm for efficient noise reduction in magnetic resonance imaging. Magn Reson Imaging. 2019;55:133-139.
8. Kwan RKS., Evans AC, Pike GB. MRI simulation-based evaluation of image-processing and classification methods. IEEE Transactions on Medical Imaging.1999; 8(11):1085-97.
9. Kwan RKS., Evans AC, Pike GB. An extensible MRI simulator for post-processing evaluation. Visualization in Biomedical Computing (VBC'96). Lecture Notes in Computer Science, vol. 1131. Springer-Verlag, 1996. 135-140.
10. Collins DL, Zijdenbos AP, Kollokian V, et al. Design and construction of a realistic digital brain phantom. IEEE Transactions on Medical Imaging. 1998; 17(3): 463-468.
Figures