2432
Intra-Session, Intra-Day and Inter-Day Reproducibility of MRI Image Quality Metrics in a Controlled Scan Setup1Advanced Clinical Imaging Technology, Siemens Healthcare AG, Lausanne, Switzerland, 2Department of Radiology, Centre Hospitalier Universitaire Vaudois (CHUV), Lausanne, Switzerland, 3Signal Processing Laboratory (LTS 5), École Polytechnique Fédérale de Lausanne (EPFL), Lausanne, Switzerland, 4Medical Image Analysis Center (MIAC), Basel, Switzerland, 5Department of Biomedical Engineering (DBE), University of Basel, Basel, Switzerland, 6Department of Radiology, University Hospital Basel, Basel, Switzerland, 7Department of Neurology, DKD Helios Klinik, Wiesbaden, Germany
Synopsis
Image quality plays a vital role in automated pipelines for medical image processing. Automated tools have thus been developed to detect low-quality images and ensure reliability of downstream results. These tools, however, often rely on image processing algorithms that can be sensitive to certain image features. In this study, we investigate the reproducibility of image quality measures provided by the open source image quality control tool MRIQC with respect to different scan setups. Results show that the reproducibility of some IQ measures is linked to the variation in the scan setup while for others it is less dependent on it.
Purpose
Automated image processing pipelines enable reproducible results and allow handling large amounts of data which is of special importance in today’s big data settings. Yet, such workflows are often susceptible to low image quality. Several tools have hence been proposed to automatically assess image quality1,2 to ensure reliability of downstream results. Those tools often employ image registration and segmentation algorithms which by themselves can introduce variability. Meaningful interpretation of results of such software requires understanding confounding factors and their impact. The goal of this study was to systematically investigate the reproducibility of image quality metrics in a controlled scan setting and to identify potential sources of variability. This was done by employing the widely used open source tool MRIQC1.Methods
3D-T1w-MPRAGE scans (spatial resolution=1mm3 isotropic, (TR/TI/BW/α/TA = 2.3s/0.9s/240 Hz/px/9°/5:12min) were acquired in 22 healthy volunteers (13 female, mean age = 25.5y ± 4.3y) on a 3T scanner (MAGNETOM Prisma, Siemens Healthcare, Erlangen, Germany) equipped with a commercial 64-channel head-neck coil. Four scans were acquired in each subject:
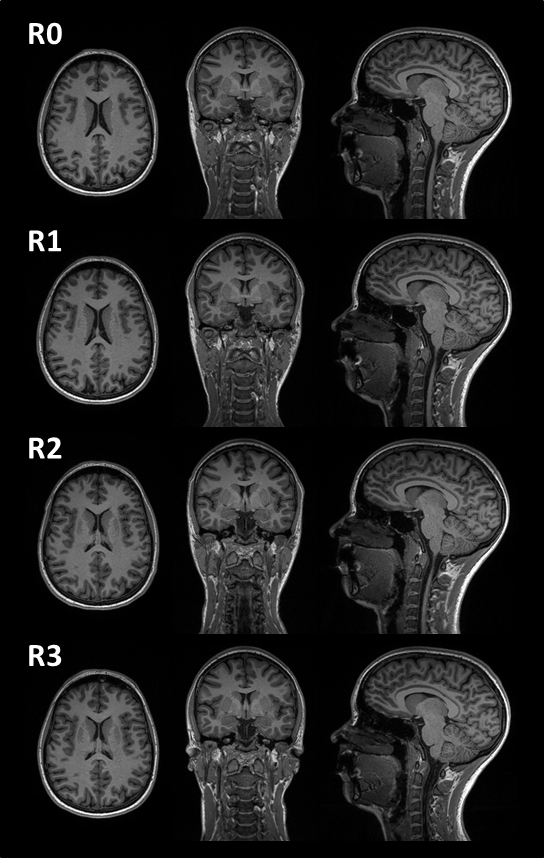
- R0: baseline scan
- R1: rescan during the same session with identical positioning about 30 minutes after R1
- R2: scan after repositioning and new shim
- R3: scan performed two to four weeks after baseline
All images were converted to nifti format and processed using MRIQC version 0.14.2 in docker1,3. Relative metric differences with regard to the baseline scan were calculated for the following scenarios:
- S1: R1–R0: “same position”
- S2: R2–R0: “repositioned”
- S3: R3–R0: “different day”
For reasons of meaningfulness and practicability, only a subset of all 68 metrics provided by MRIQC was analyzed:
- Noise-based measures: snrd_gm, snrd_wm, snrd_csf, snrd_total, snr_gm, snr_wm, snr_csf, snr_total, cnr, cjv, summary_bg_mean
- Information-theory-based measures: EFC, FBER
- Other measures: tpm_overlap_gm, tpm_overlap_wm, tpm_overlap_csf
For details on the metrics please refer to3.
Results
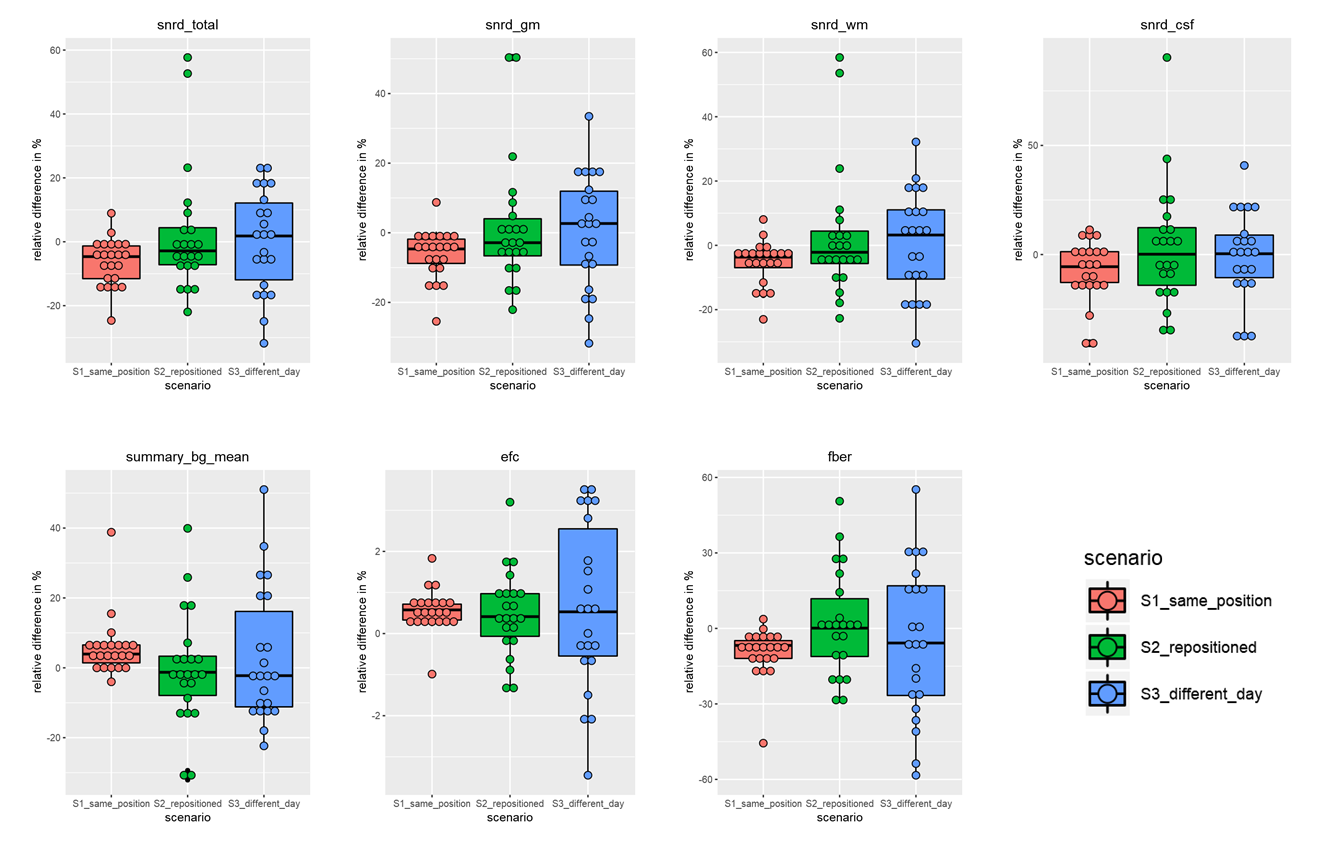
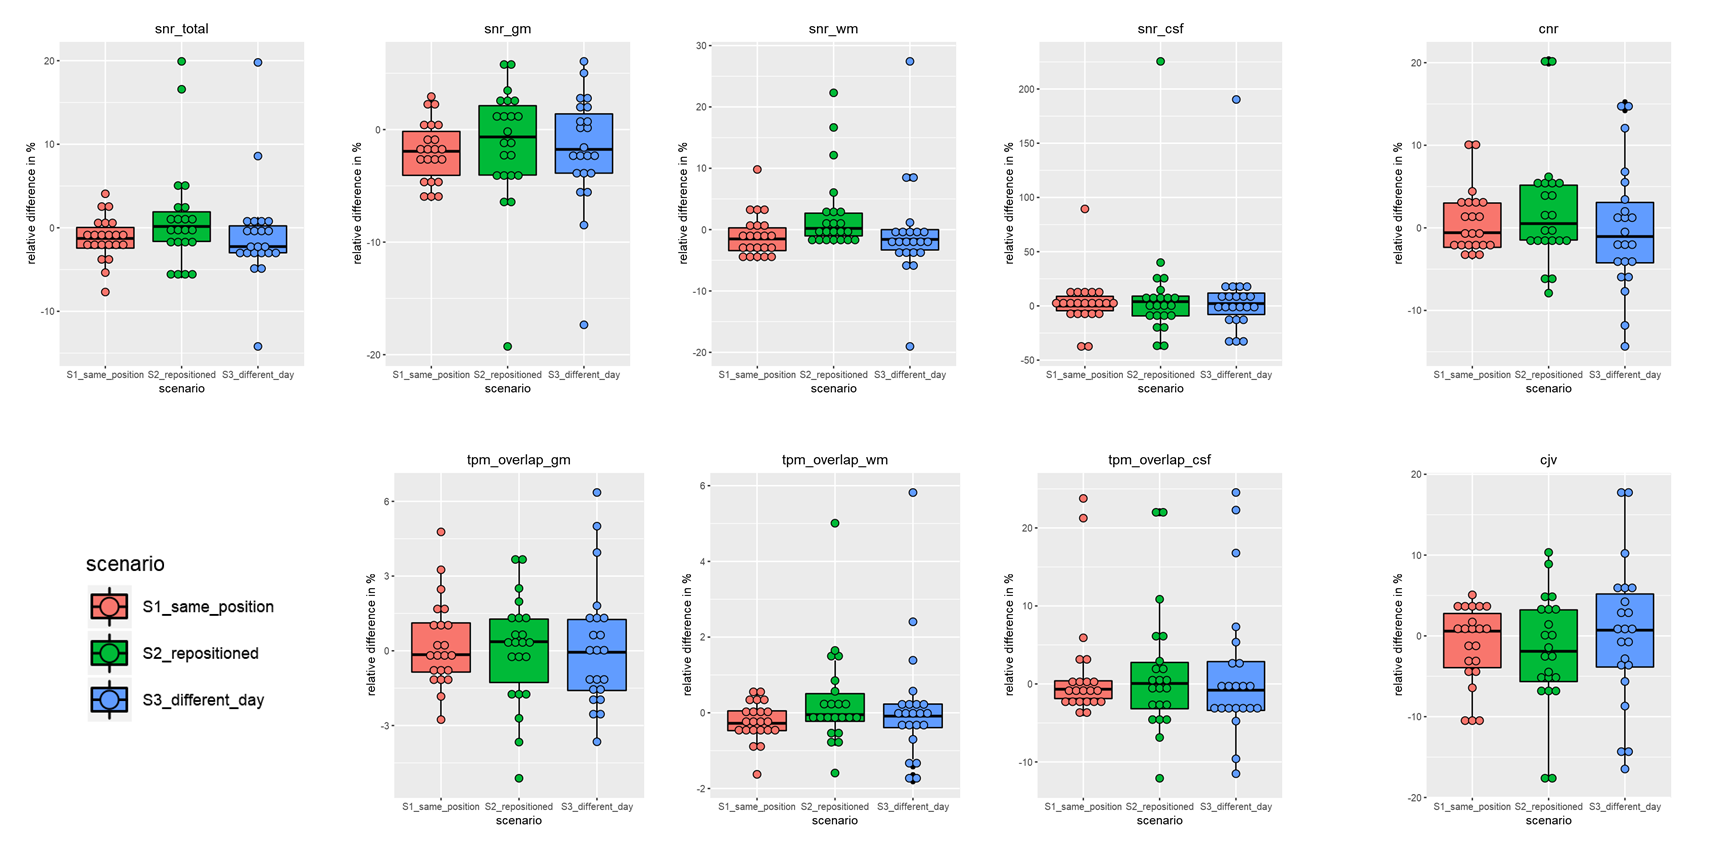
Figure 1 shows representative example images for all performed scans. Visually, image quality and slice alignment appear very similar. A summary of metrics relating to background noise or the signal distribution in the image is displayed in Figure 2. Variance increases from scenario S1 to S3 for all metrics, with variabilities increasing from the single-digit up to the lower-mid double-digit percent range. The increase is consistent with growing variation in the background signal intensity (summary_bg_mean), suggesting that it can be attributed mostly to variations in the background. Interestingly, the relative metric differences for scenario S1 consistently indicate a slightly better image quality for R0 than R1 even though the setup is virtually identical. Figure 3 summarizes results for metrics related to image contrast and homogeneity. Despite the increasing variability in the scan setup, the variability of those metrics is very similar for all scenarios with differences in the low single-digit percent range.Discussion and Conclusion
The increase in variability of
noise-related metrics from scenario S1 to S3 is expected due to the increasing
differences between the scan situations. The consistently worse metric values
observed for R1 compared to R0 are more surprising. They may be explained by
increased subject motion, e.g. due to discomfort or subjects falling asleep
related to the considerably longer time already spent in the scanner when R1
was acquired. An actual change in technically-related background noise in
scenario S1 consistent in the whole population in contrast is very unlikely, as
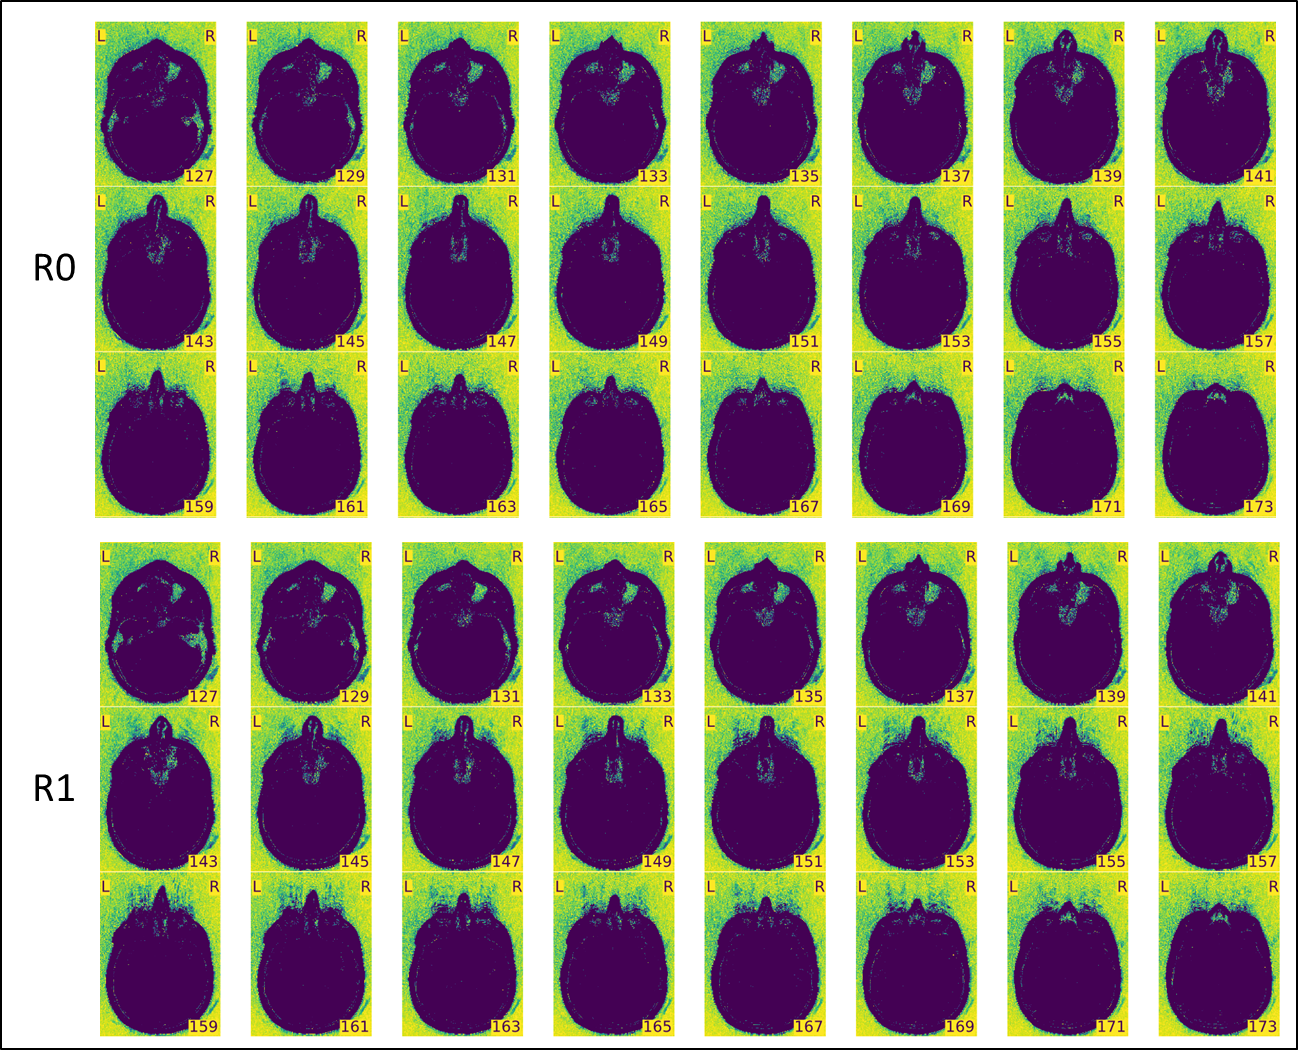
is a systematic error in the metrics. Figure 4 displays noise maps from the MRIQC report
of a subject comparing scans R0 and R1 showing higher noise/background signal
due to eye motion. As a conclusion, it could be recommended to acquire imaging
sequences for which image quality is pivotal at the beginning of the protocol.
The rather similar level of
variability in all scenarios for the measures presented in Figure 3 could be
explained by the fact that those metrics rely on registration or segmentation,
which can be sensitive to tiny changes in the acquisition. These metrics hence
have some intrinsic variability. The results suggest that even very small
changes in the acquisition like in scenario S1 can cause variability in those
metrics comparable to a rescan in a different day. Yet, overall the variability
is much lower than for the noise-based metrics.
It was shown here that image quality metrics can
vary even if the scan setup is very strictly controlled. However, in the
best-case scenario most metrics vary only in the single-digit percent range
which likely would not change a decision about good or bad image quality.
Generally, decisions on whether or not image quality is sufficient for further
processing should not be based on single metrics alone but rather on a
combination of metrics.Acknowledgements
No acknowledgement found.References
- Esteban O, Birman D, Schaer M, Koyejo OO, Poldrack RA, Gorgolewski KJ. MRIQC: Predicting Quality in Manual MRI Assessment Protocols Using No-Reference Image Quality Measures. bioRxiv 2017
- PCP Quality Assessment Protocol. http://preprocessed-connectomes-project.org/quality-assessment-protocol/
- MRIQC. https://mriqc.readthedocs.io/en/stable/index.html
Figures