2425
Compressed Sensing Velocity Encoded Phase Contrast Imaging: Monitoring Skeletal Muscle kinematics1Physics, UC San Diego, San Diego, CA, United States, 2Physics, San Diego State University, San Diego, CA, United States, 3Radiology, UC San Diego, San Diego, CA, United States
Synopsis
Velocity Encoded Phase Contrast (VE-PC) imaging is an established technique for monitoring muscle kinematics. Dynamic studies require consistent repeated execution of motion paradigms to map skeletal motion. The high number of repeated contractions limits studies to low % maximum voluntary contraction and limits participation of cohorts with compromised muscle function. We explore combining multi-coil data with compressed sensing and reconstruction to reduce acquisition times. VE-PC images acquired with different compressed sensing factors are assessed for accuracy of velocities and strain rate tensor during isometric contractions. Our results show that CS undersampling by 4 yields accurate velocity and strain tensor values.
INTRODUCTION
Velocity Encoded Phase Contrast Imaging is an established technique for monitoring muscle kinematics1. Dynamic studies require consistent and repeated execution of motion paradigms (e.g., ~70 isometric contractions for different phase encoding lines) to map skeletal motion. The fairly high number of contractions limits studies to low percentages of maximum voluntary contraction (~30-45% MVC) and also participation of subjects with compromised muscle function such as senior subjects. Extending muscle kinematics to higher %MVC has the potential to distinguish differences between normal and abnormal skeletal muscle function. We explored combining multi-coils with compressed sensing to reduce acquisition times (and required number of contractions) in gated 2D 3-directional VE-PC and have quantified the CS-VEPC for accuracy of velocity and strain rates derived from the velocity maps.METHODS
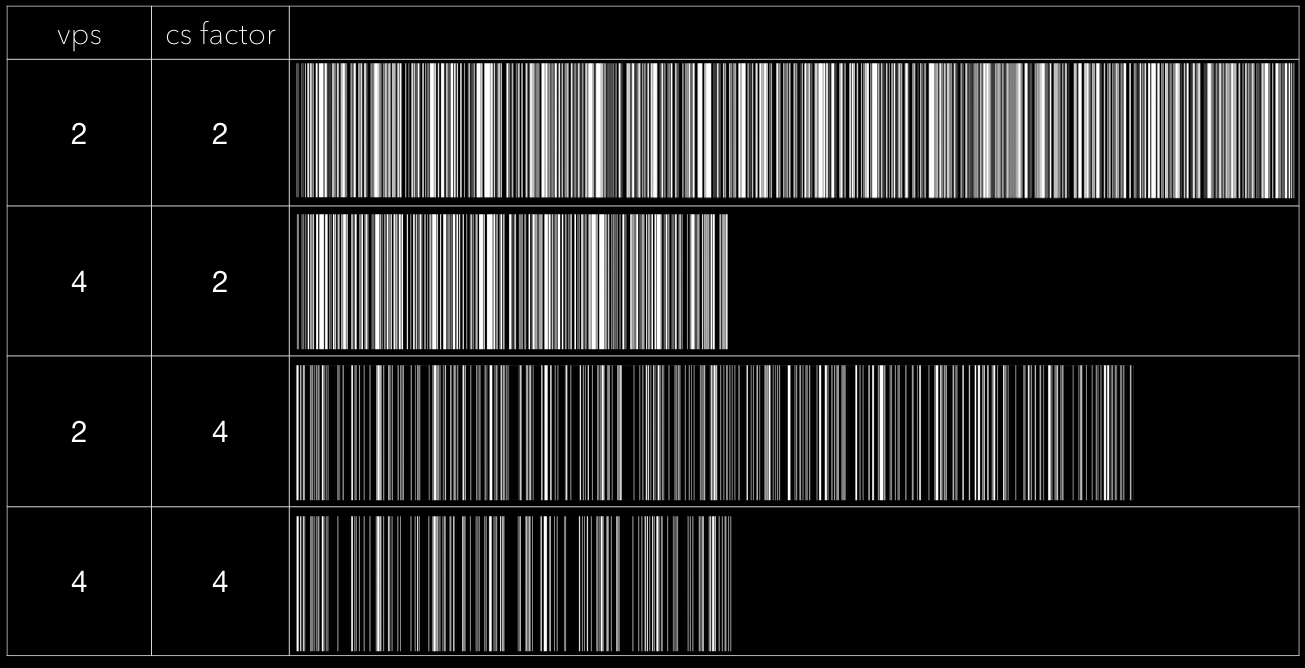
The flow quantification with the different CS schemes was initially validated using a flow phantom, and showed very good agreement between values obtained from imaging and those directly from the flowmeter. Five subjects (with IRB approval) were scanned on a 1.5T GE scanner with the original VE-PC sequence without compression and several combinations of CS undersampling and views per segment factors. The original imaging protocol was gated VE-PC images obtained during isometric contraction at 45% MVC (TE: 7.7ms, TR: 16.4ms, NEX: 2, thickness 5mm, sagittal-oblique orientation, FOV: 30 × 22.5cm, matrix: 256 × 192, 4 VPS, 22 phases (with view sharing, '8 acquired frames'), 3D velocity encoding, venc: 10cm/s)1. The lower leg was placed in a cast with an embedded strain sensor inside an 8-channel custom RF coil; real-time visual feedback was provided to the subject. The uncompressed VE-PC sequence acquired 106 phase-encode lines and includes 4 views/segment to obtain acquisition times of 2.5 minutes. A ky-t undersampling followed a variable density random undersampling with maximum density at the center of k-space (Fig. 1). A two-step CS joint reconstruction (of reference and velocity encoded images) was performed in the following steps2: A coil sensitivity map was generated from a temporal average and adaptive array combination. The first step used the coil sensitivity map and the zero filled reconstructions to reconstruct using temporal FFT as the sparsifying transform. The output of step 1 transformation was reconstructed with a second sparsifying transform (temporal Total Variation) and the final images (reference and three-velocity included images) were processed to get the magnitude and phase difference images. The image reconstruction was performed in Matlab. Quantitative analysis of velocity and strain rate between images acquired with different CS and VPS was performed in 2D regions placed in the MG muscle. Position of each voxel inside ROI was tracked across the contraction-relaxation cycle.RESULTS
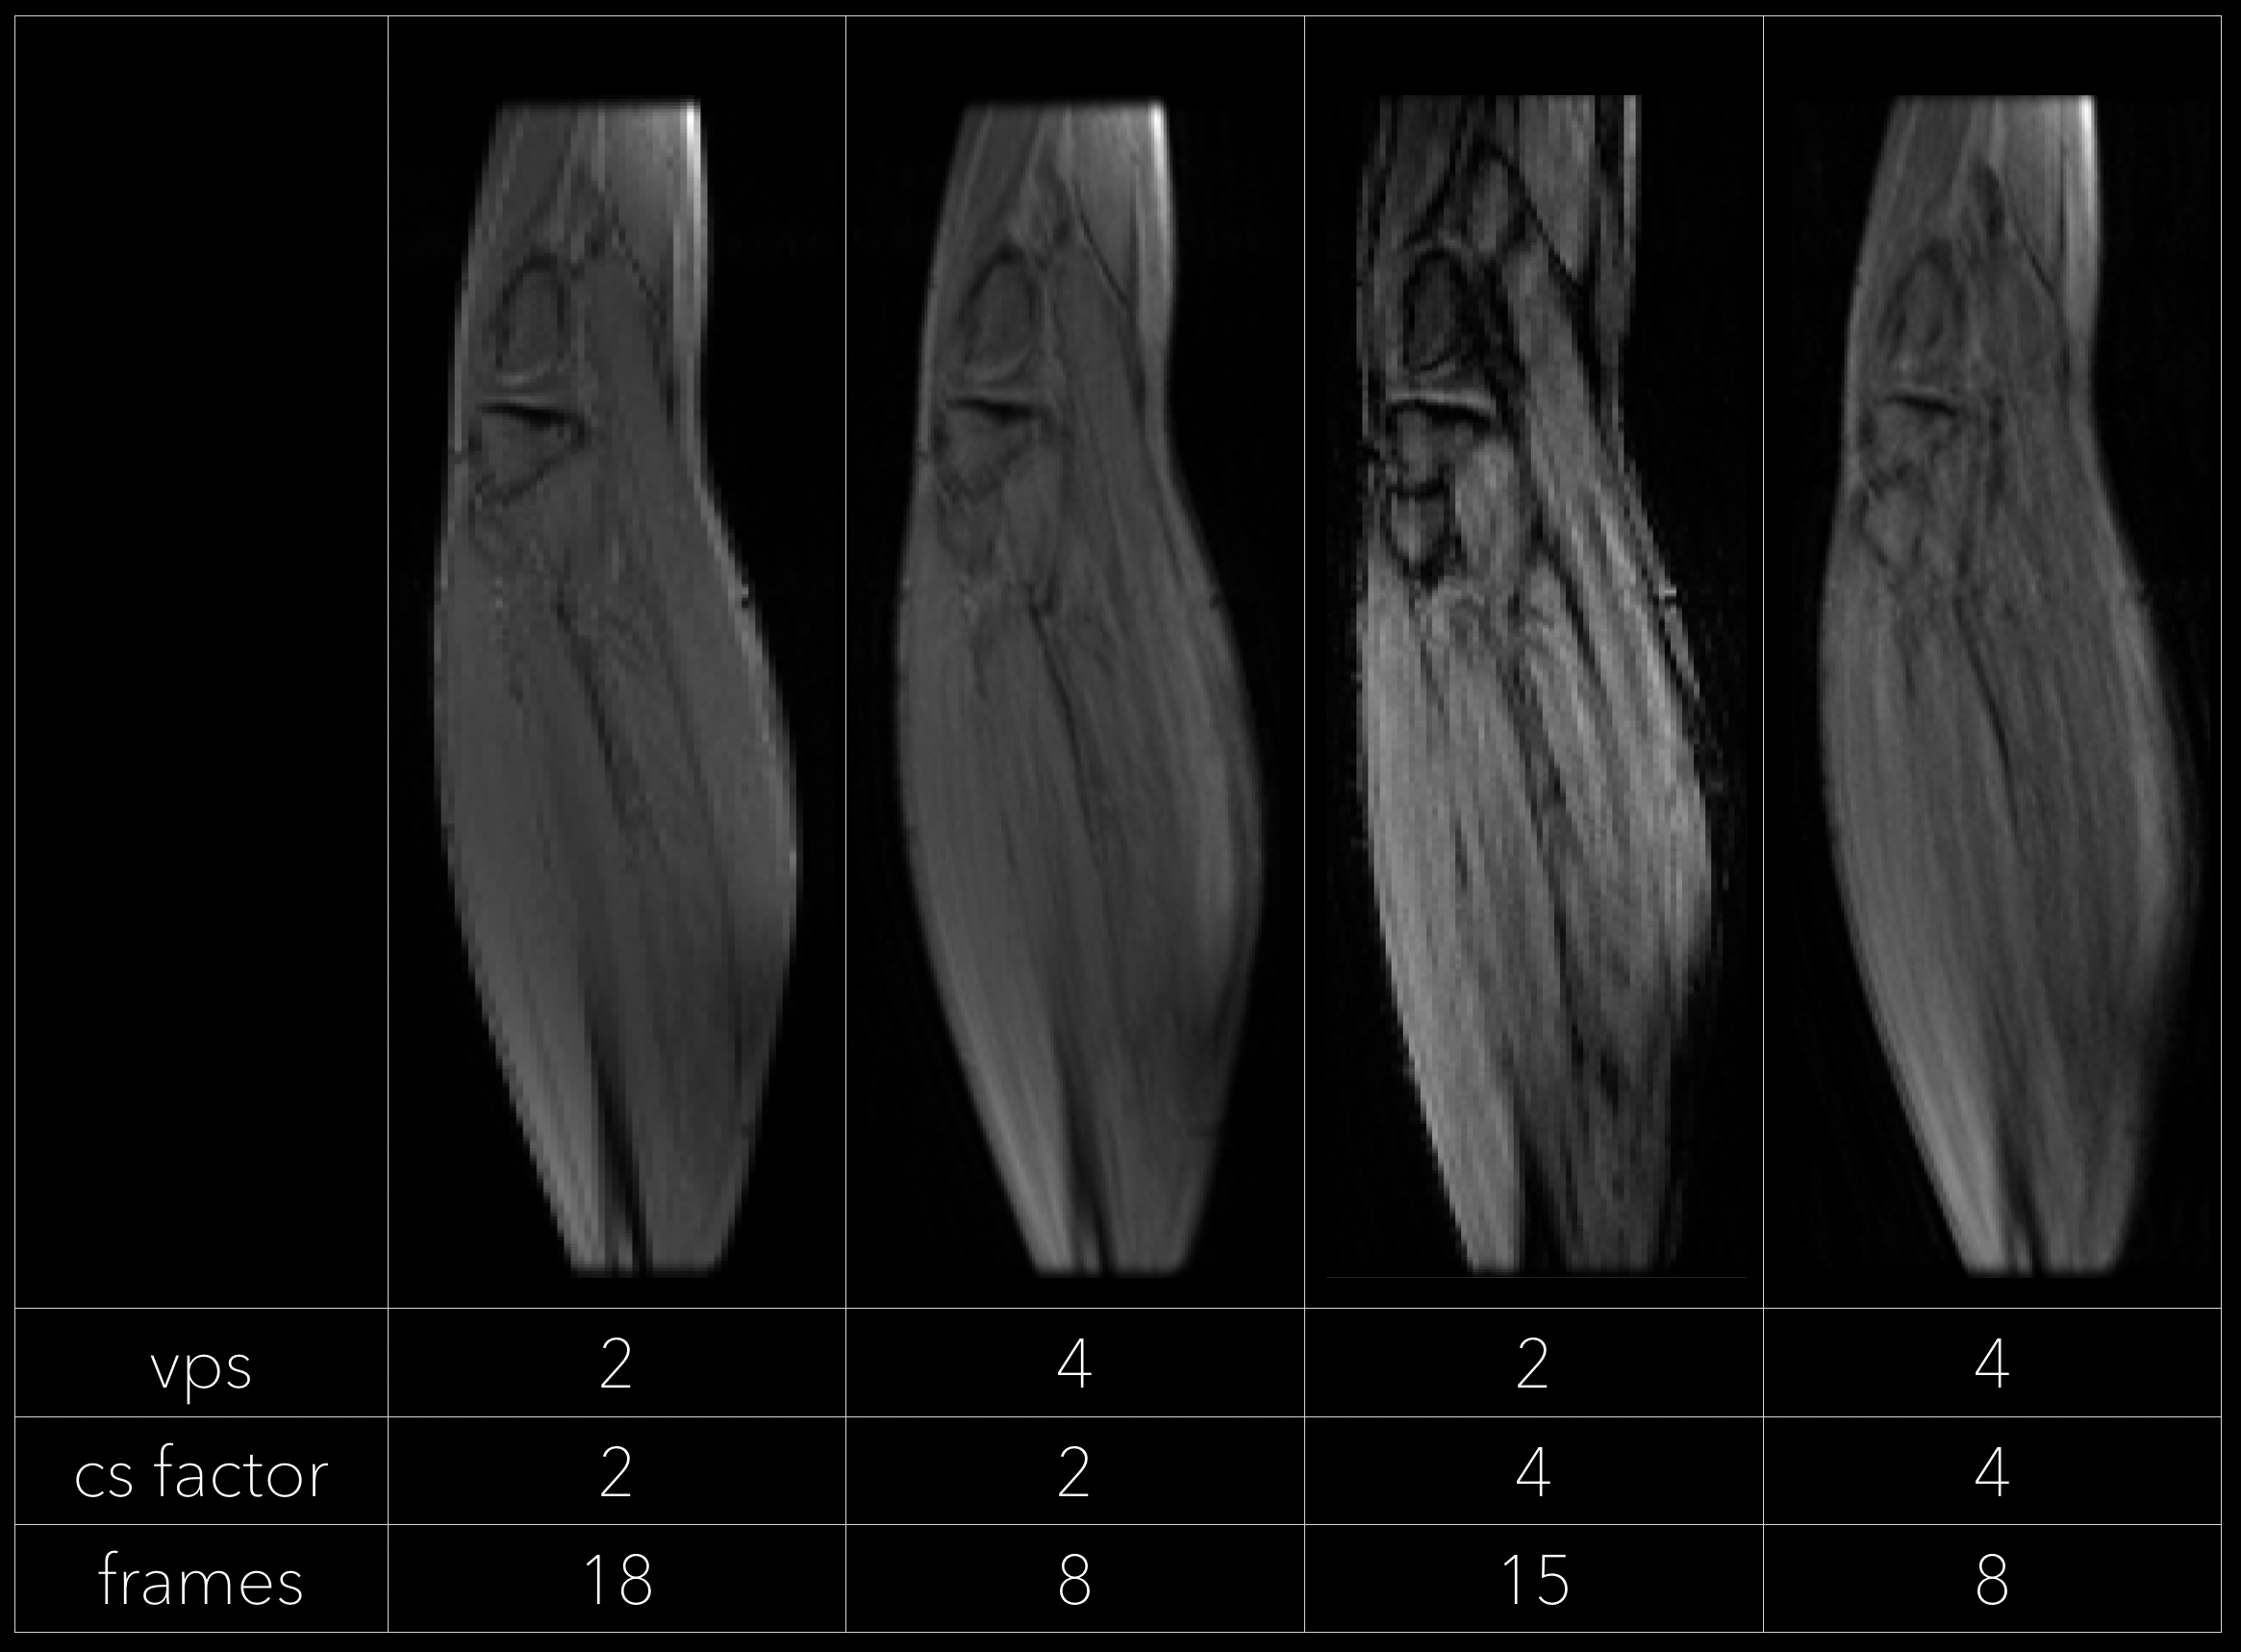
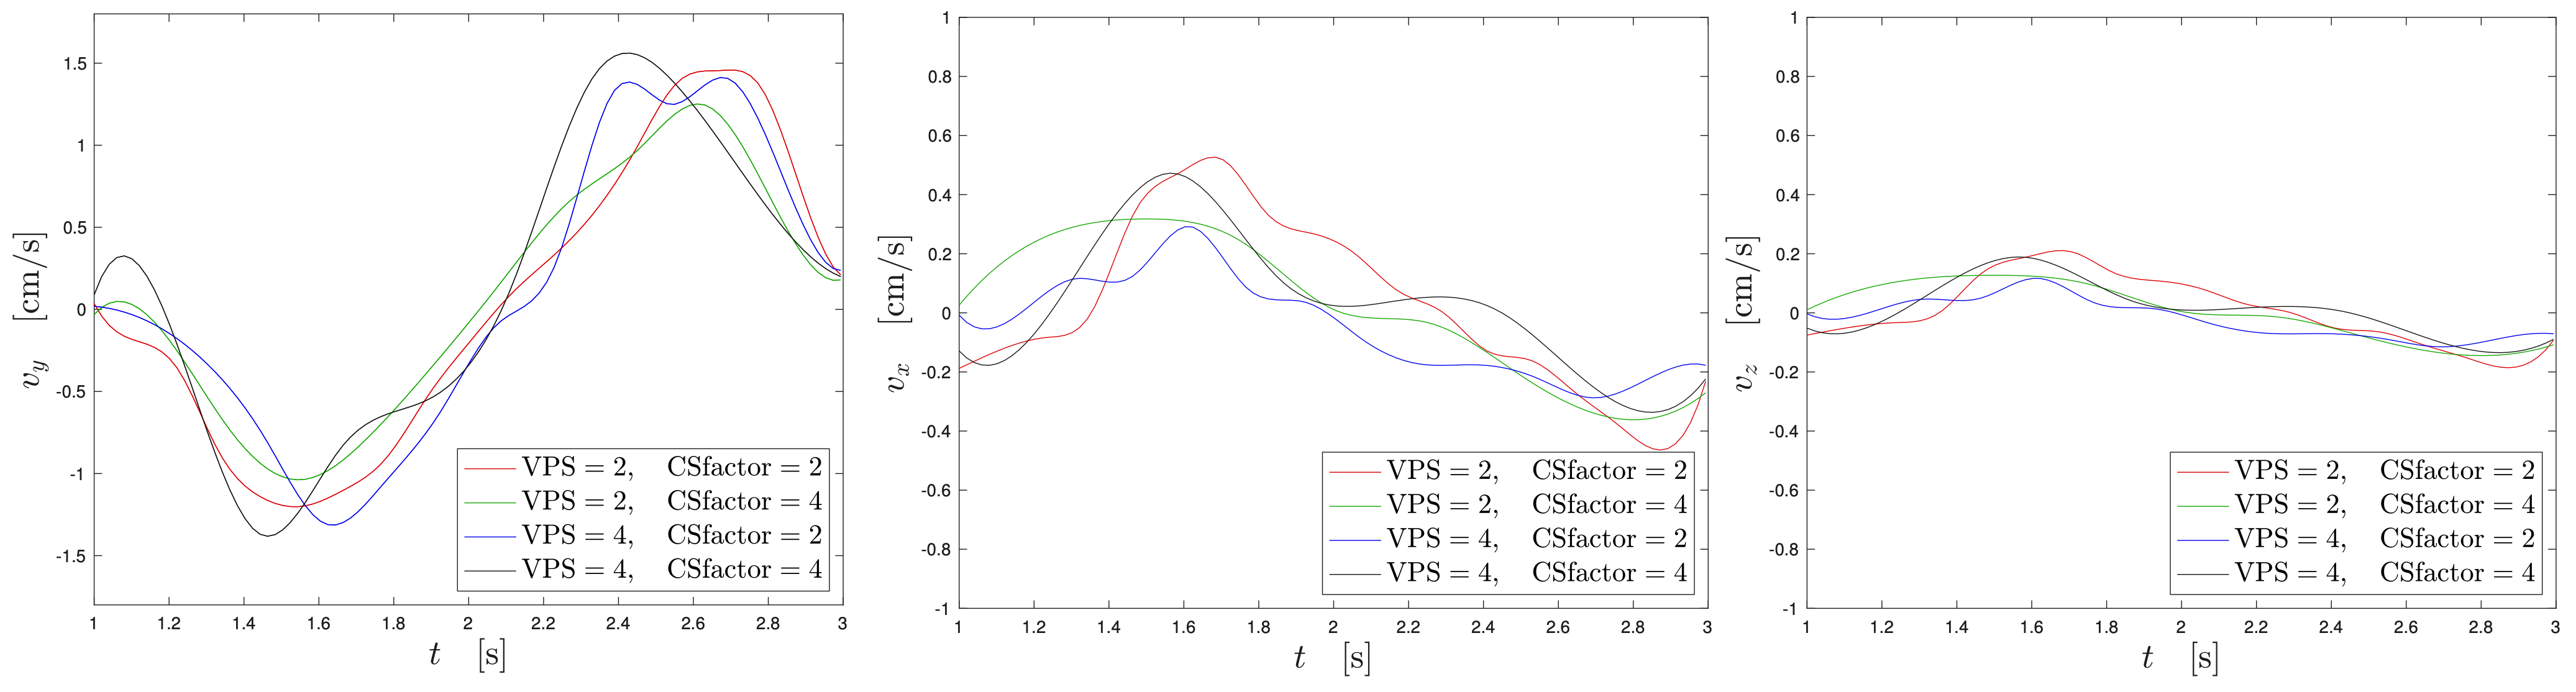
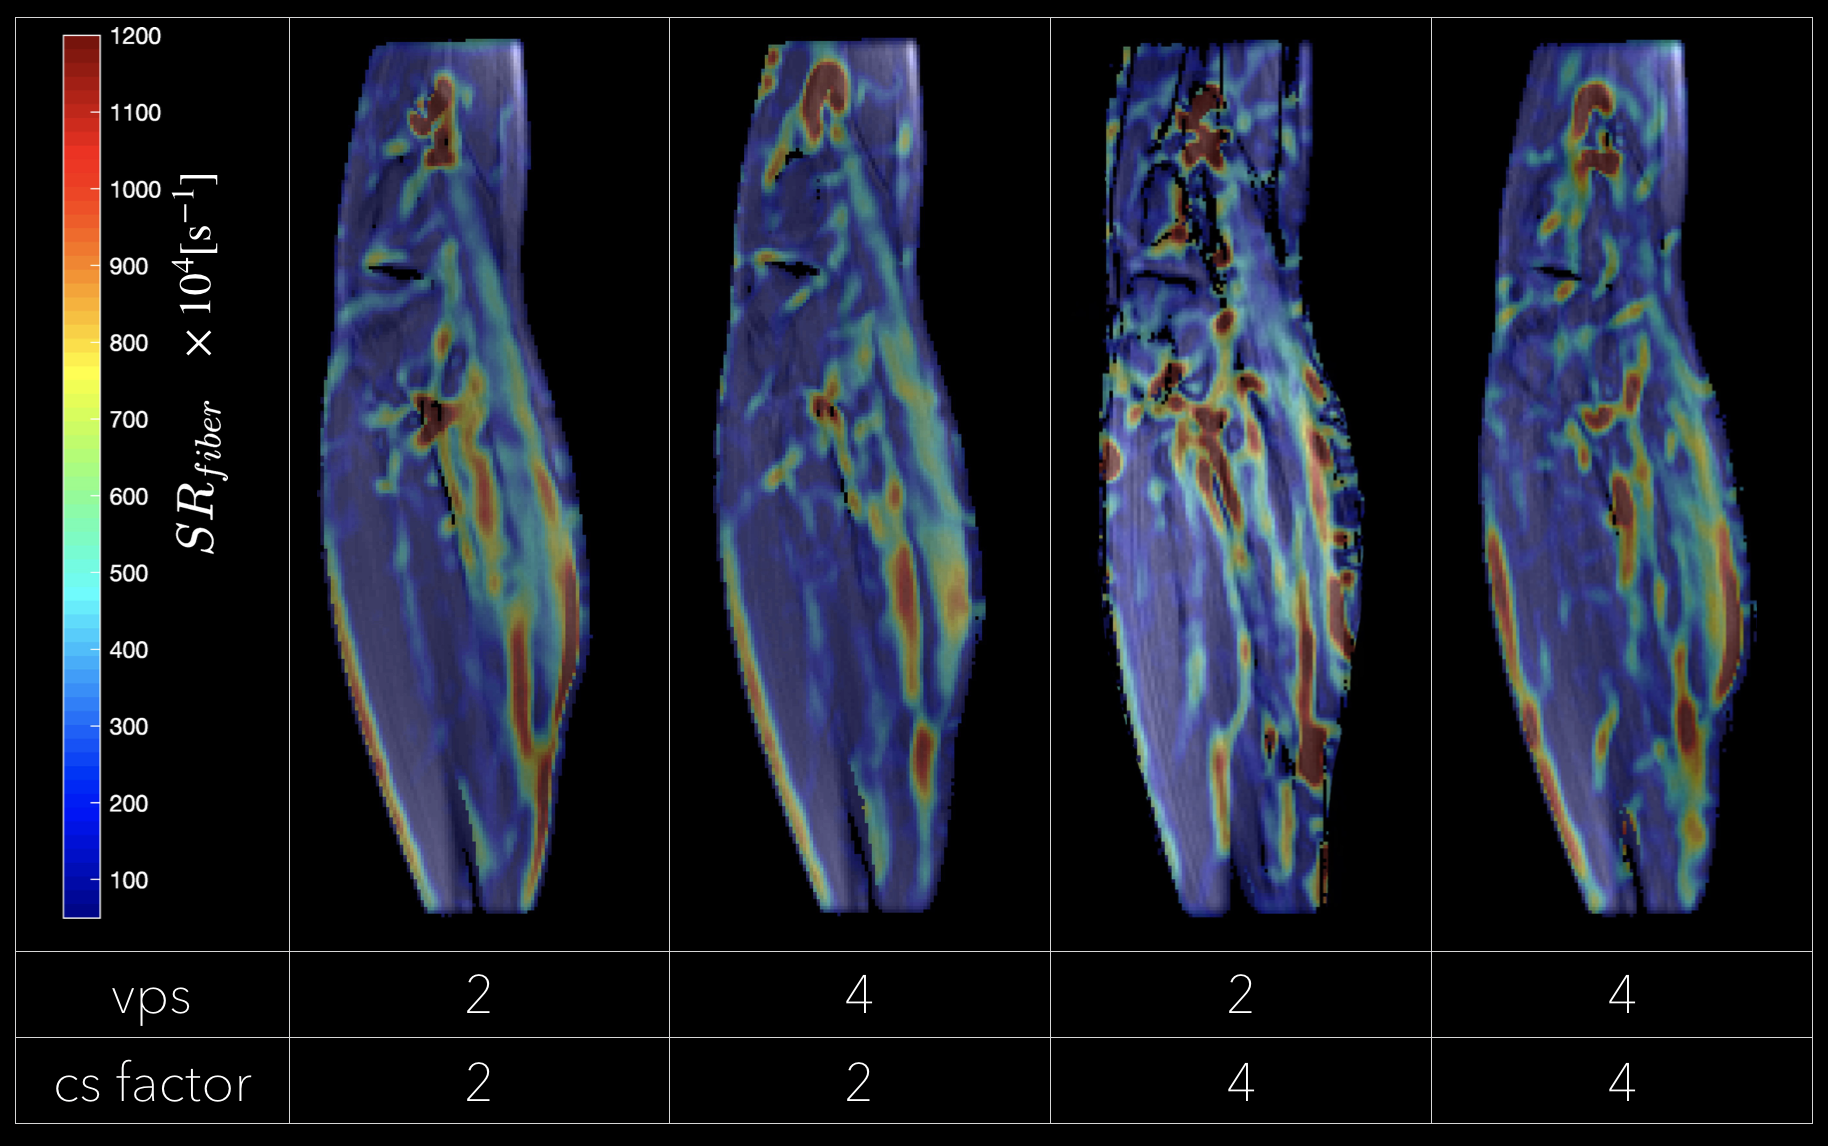
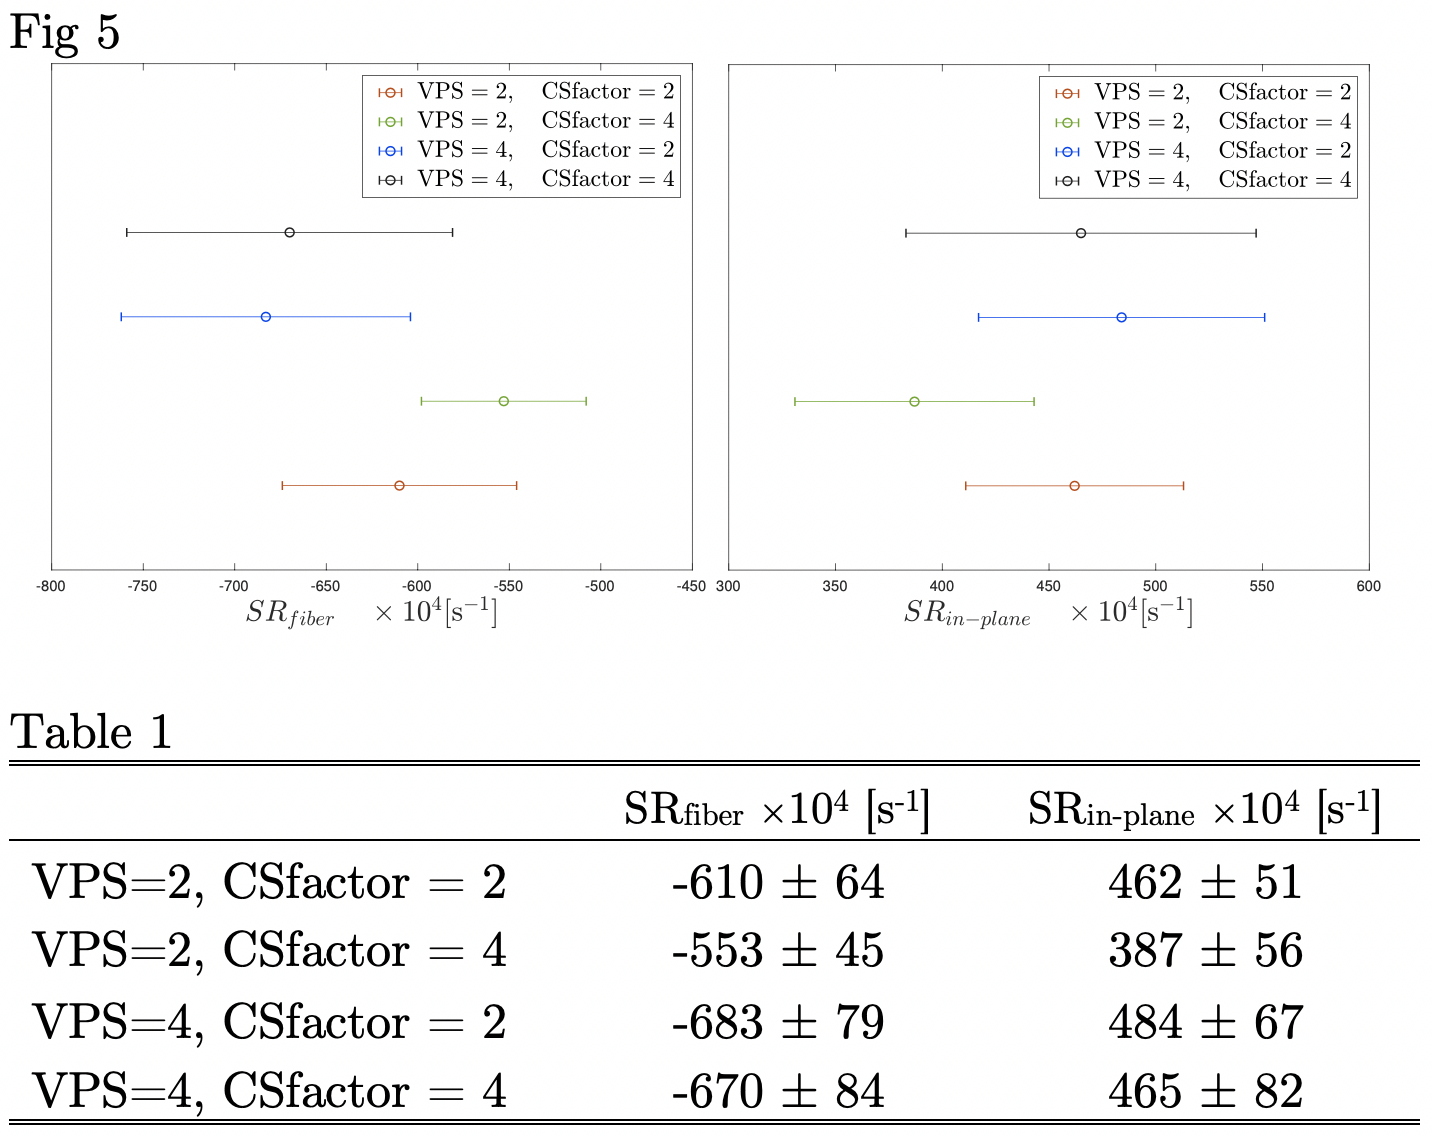
Fig. 2 shows the magnitude images reconstructed at one temporal frame (at peak force of the isometric strain). The scan time relative to the original uncompressed VE-PC is listed for combinations of CS factor and views per segment (VPS) factor. The number of the raw acquired temporal frames depends on the views per segment and decreases for higher VPS. Figure 3 is a plot of velocities from the phase difference images for the undersampled VE-PC data. The results show good overall agreement of velocities of the reference scan with CS=2, VPS=2 to even the fastest scan with CS=4 and VPS=4. Figure 4 is a strain rate maps for different undersampling and shows the strain rate along the muscle fiber at the peak of the contraction. Figure 5 shows the values of the SR indices from the different CS sequences and their error bars.DISCUSSION
The present study shows that time reductions by a factor of 4 yields accurate velocity and strain tensor and can thus be used to study muscle kinematics with as little as 15 repetitions of contractions. It should be noted that the number of temporal frames is limited by the number of views per segment (as it increases the total pulse length) but interpolation can be used to increase temporal resolution (as in the original VE-PC data). In addition, for the same CS factor, increasing the VPS degrades image quality: this arises from decreasing the amount of random data along the temporal axis. It should also be noted that strain rates require higher SNR in the velocity data but the quantitative SR values confirm that the reduced acquisitions preserve the accuracy of the SR indices.CONCLUSIONS
Scan time for 2D 3-directional VE-PC can be effectively reduced to ~ 38 secs by combining compressed sensing and multi-coils. This increases the range of applications of VE-PC to studying muscle kinematics at higher MVC and to senior, frail subjects.Acknowledgements
This work was supported by the National Institute of Arthritis and Musculoskeletal and Skin Diseases Grant R01AG056999-01References
[1] Malis V, Sinha U, Csapo R, Narici M, Sinha S. Magn Reson Med.2017;doi: 10.1002/mrm.26759.
[2] Kim D, Dyvorne HA, Otazo R, et al. Magn Reson Med.2012; 67: 1054-1064.
Figures