2408
Improved Parallel Imaging with a 3D Spiral Staircase Trajectory1Philips Healthcare, Gaineseville, FL, United States, 2Radiology, Mayo Clinic, Rochester, MN, United States
Synopsis
A flexible 3D “Spiral Staircase” (SSC) trajectory is introduced that reduces g-factor losses from through-plane parallel imaging acceleration, regardless of coil geometry. Results demonstrate up to a 5x g-factor improvement over Cartesian SENSE for through-plane acceleration in axial brain acquisition with R = 3.
Introduction
Partially parallel imaging methods such as SENSE and Grappa enable substantial acceleration by utilizing spatial encoding inherent in local sensitivities of multi-channel phased array coils. Unfortunately such methods suffer regional signal-to-noise ratio (SNR) variations depending on coil geometry (g-factor) in addition to SNR loss proportional to the acceleration factor R. Thus, parallel imaging techniques are only broadly applicable for high-SNR scans. This work introduces a novel 3D trajectory that builds on the high SNR efficiency of long-𝜏 spiral readouts and CAIPIRINHA and other techniques1,2 that reduce aliasing overlap and improve g-factor.Methods
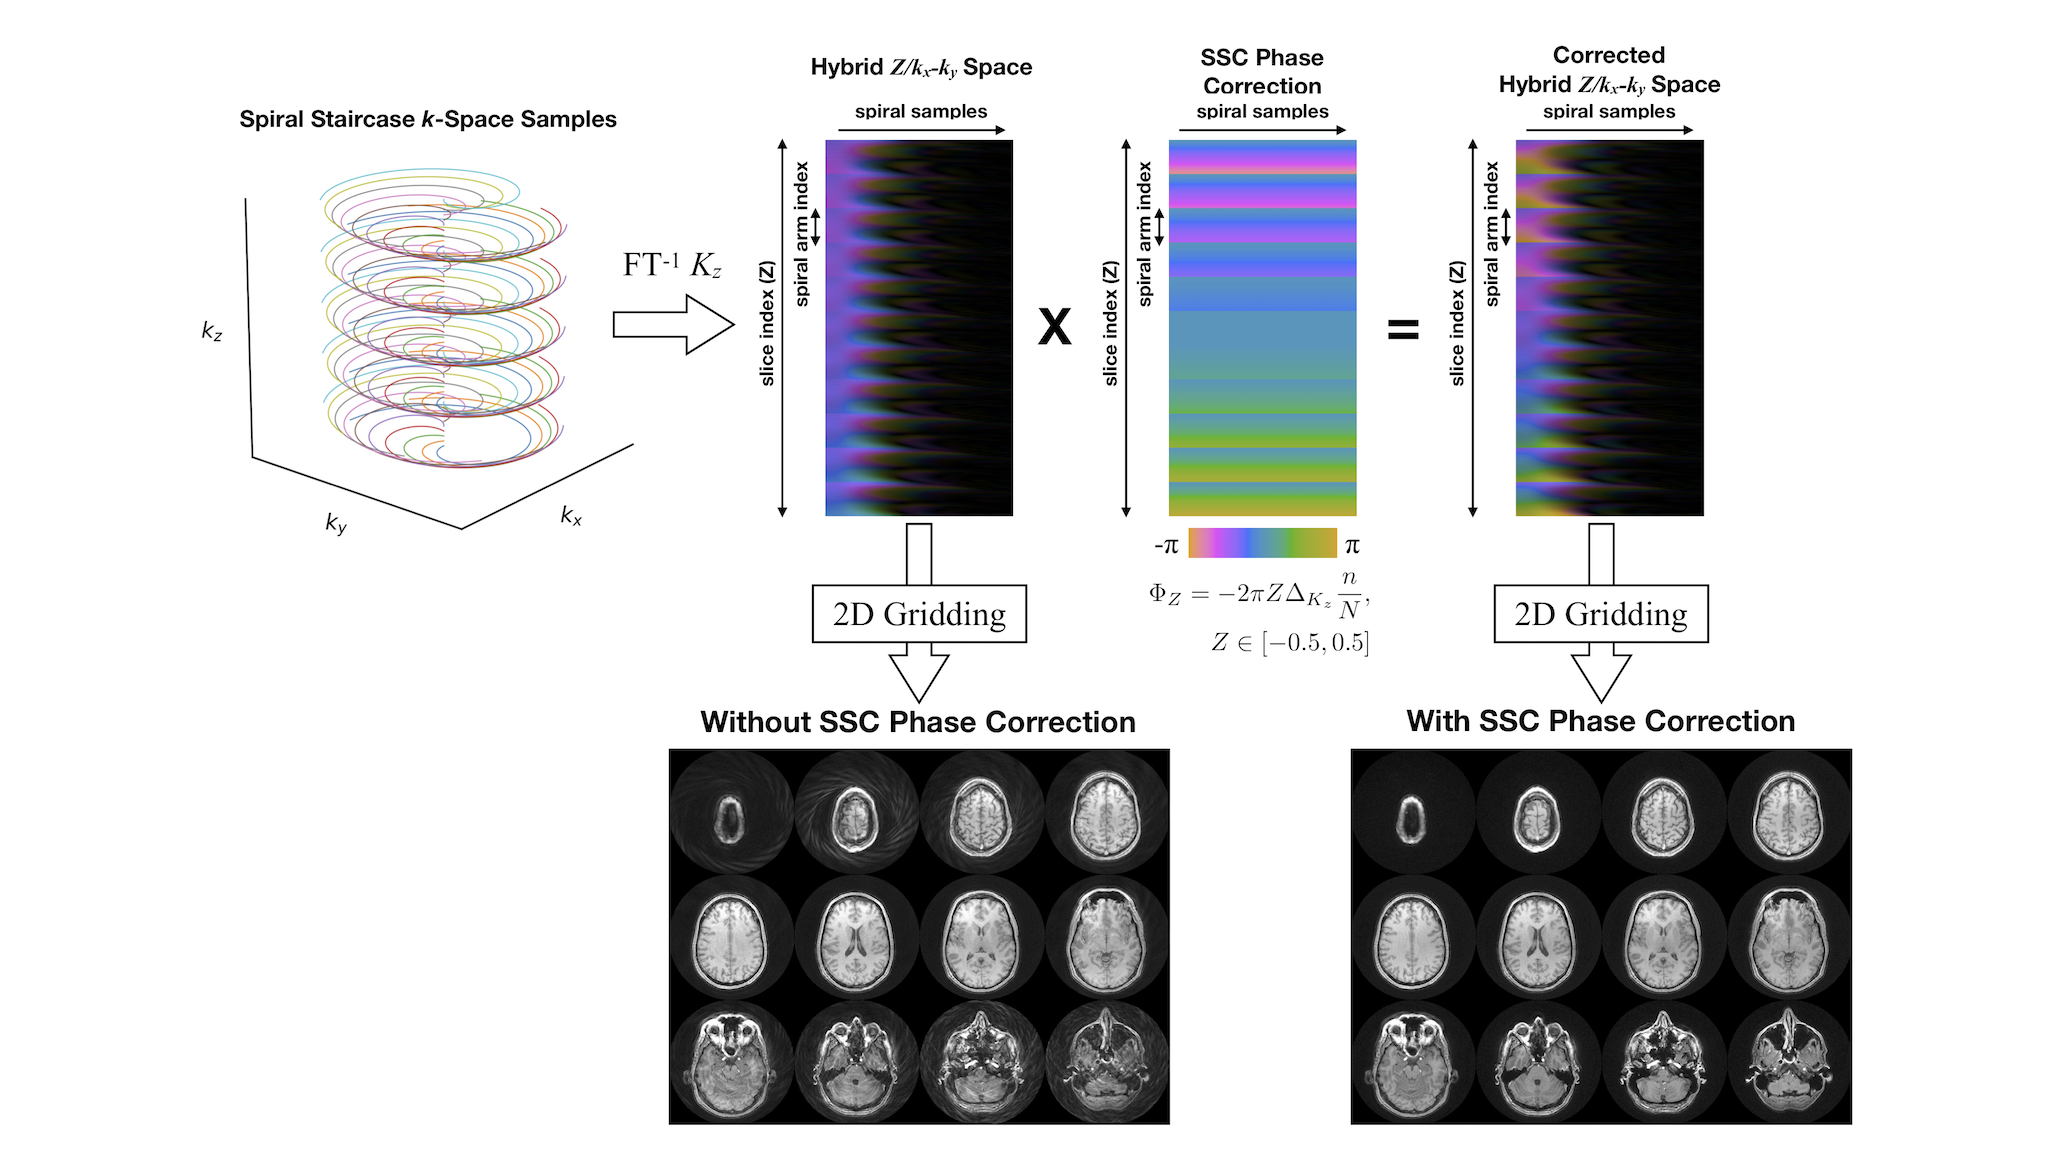
We propose a novel 3D trajectory (Figure 1) comprising spiral arms in parallel kx-ky planes, each with a unique position along the kz axis. We refer to this trajectory as a “spiral staircase” (SSC). This trajectory is similar to previously reported distributed spiral3 and rotated stack-of-spirals4 (SOS) trajectories, but with periodic arm-rotation (rather than incremented by the golden angle) to maintain uniform sampling in kz, and flexibility for sub-Nyquist distances between arms along kz. While we believe this trajectory has many benefits, this work focuses on its potential for improved geometry factors for through-plane parallel imaging acceleration.
Reconstruction of fully-sampled SSC data (Figure 1) was performed in three-steps: 1) a 1D inverse FFT along the Cartesian kz dimension to transform the data into a hybrid kx-ky-Z space, 2) a Z-dependent phase applied to the data to compensate for the shifts in kz, collapsing sets of spiral arms into slices, and 3) 2D gridding and FFT to reconstruct each slice.
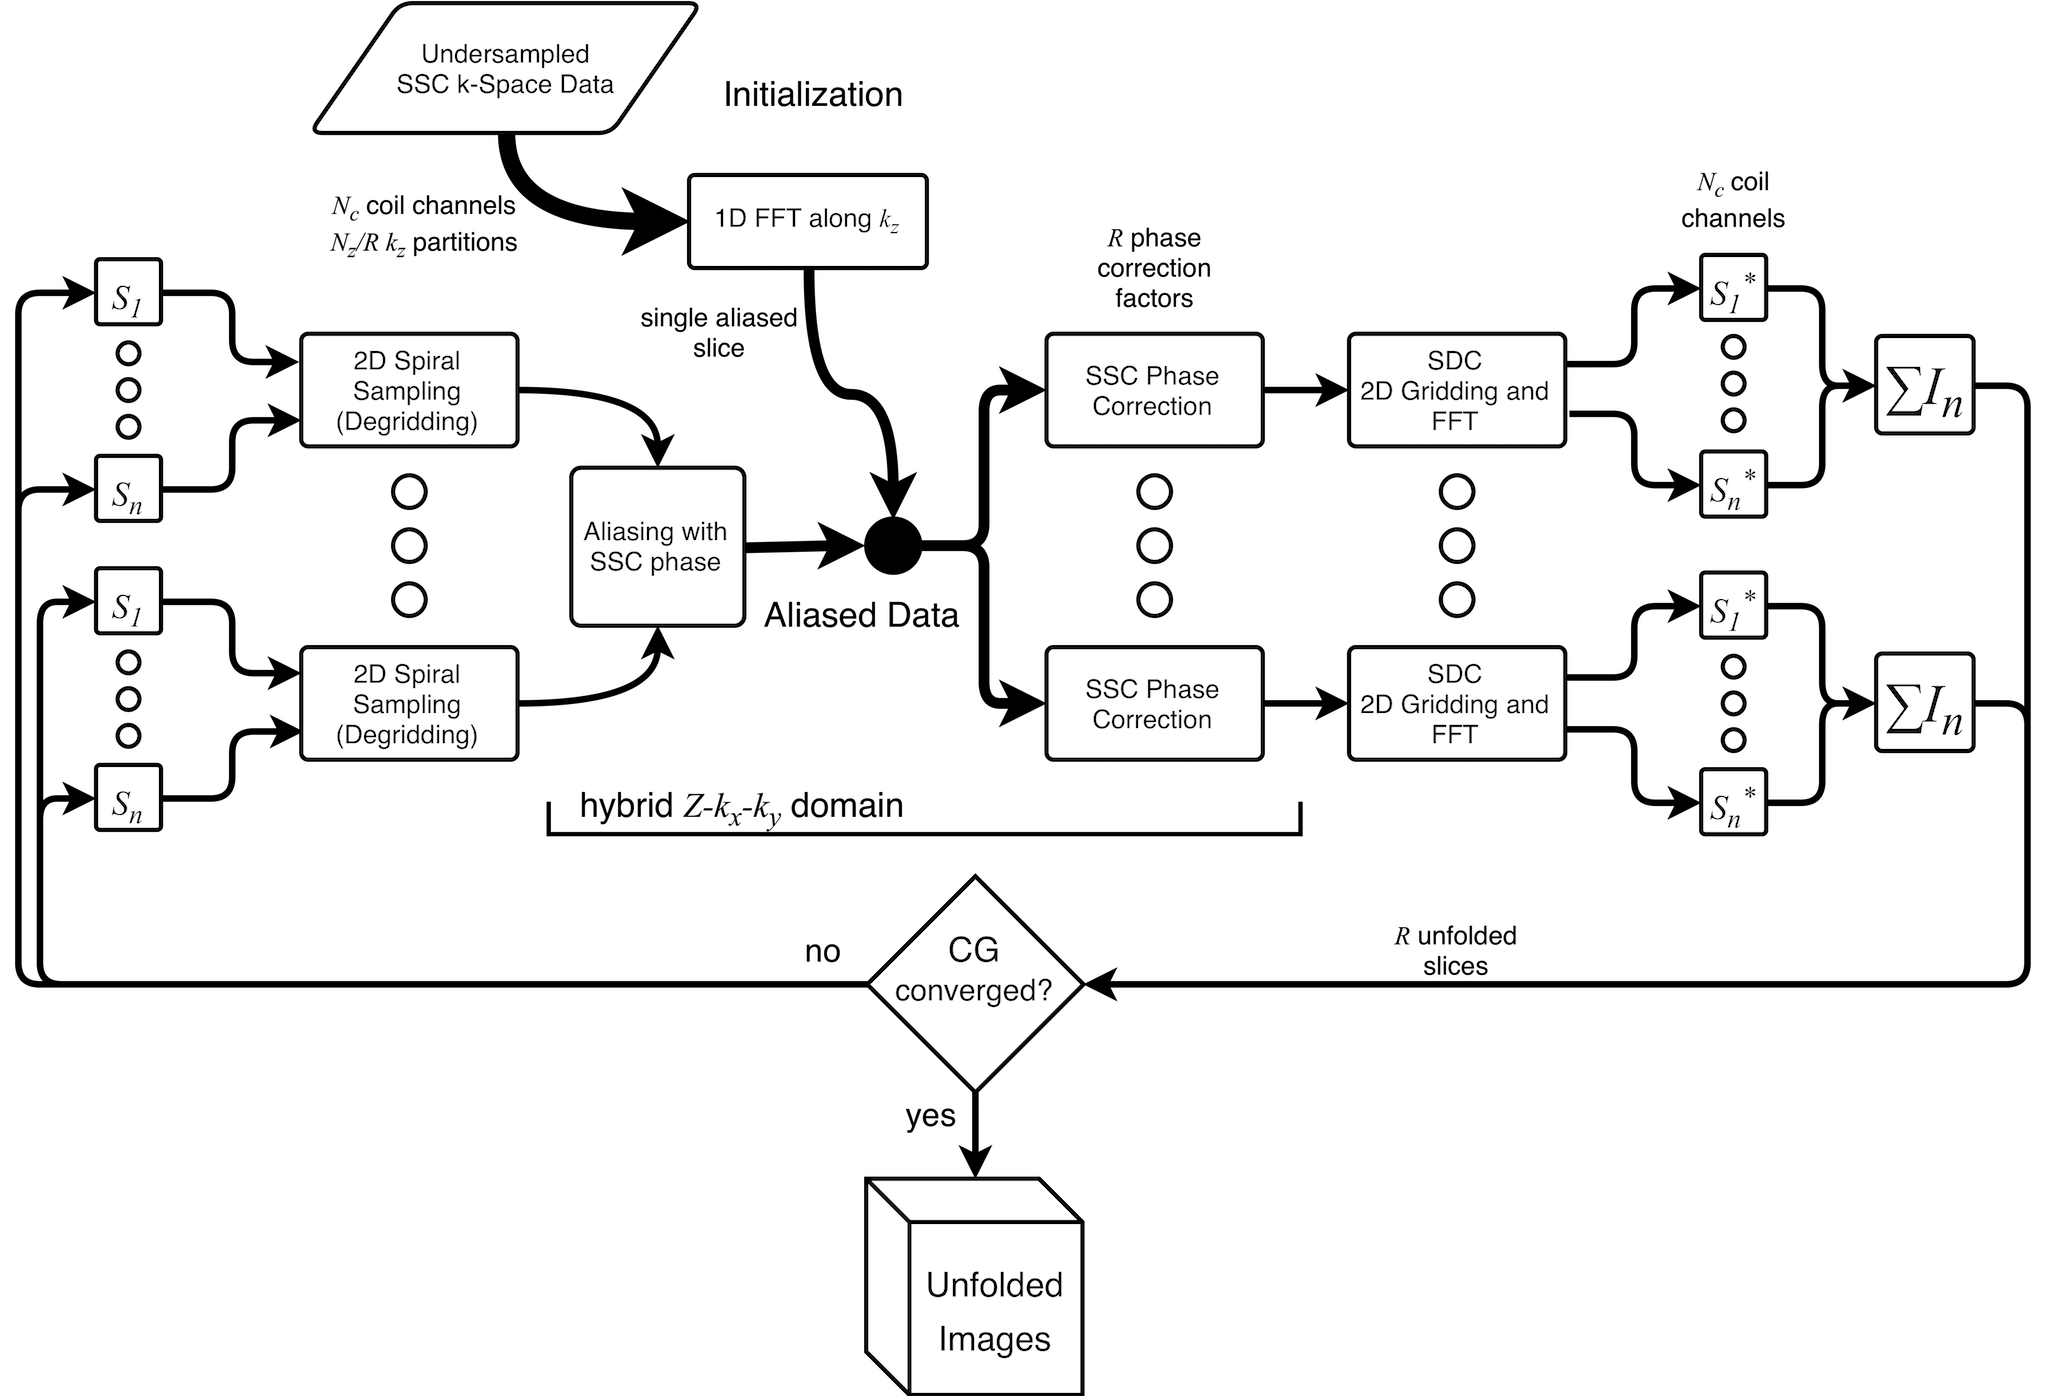
In the case of through-plane aliasing, the phase correction in the second step is different for the nominal and any aliased slices. The result is reduced aliasing coherence and ultimately improved g-factor as SENSE encoding matrix becomes easier to invert. Figure 2 shows how SSC phase correction was incorporated in an iterative SENSE (conjugate gradient) technique to reconstruct data with through-plane undersampling.
A volunteer was scanned on a 3T system (Ingenia, Philips, The Netherlands) in under an IRB approved protocol. Data were acquired using a 15-channel head coil using an FFE sequence with 𝜏 (readout duration) = 9.76 ms, flip angle = 36°, TE1/TE2/TR = 1.36/2.51/30 ms, voxel size = 1.0 x 1.0 x 2.0 mm3, axial imaging volume = 240 x 240 x 130 mm3 (65 prescribed slices plus 20% oversampling). Each kz segment contained 30 spiral arms with 'mixed'5 arm-ordering (also controlling the sub-kz shifts). Total scan times were 2:32 (fully sampled), 1:26 (R = 2), and 1:02 (R = 3). All parameters were the same for SOS and SSC acquisitions.
SSC g-factor maps were approximated numerically6 using 25 noise realizations, followed by median filtering with a 5x5 kernel. SOS g-factor maps were calculated analytically. All g-factor maps were calculated from TE1 images before deblurring.
Results
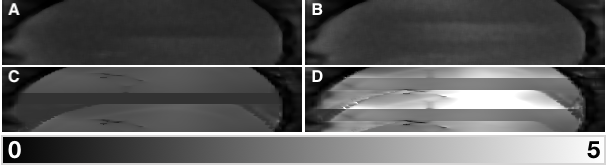
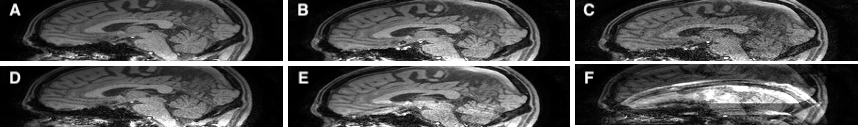
Figure 3 shows central sagittal slices from g-factor maps comparing SSC and SOS for R = 2 and R = 3. Mean g-factor improved from 1.45 to 0.96 for R = 2 and 2.88 to 1.24 for R = 3. Figure 4 shows sagittal reformats from reconstructed images for R = 2 SSC and SOS data after joint fat-water separation and off-resonance deblurring7 (water-only images are shown).
Inclusion of a regularization factor (tissue presence map) resulted in g-factors < 1.0 outside the brain, but were masked for the mean g-factor calculations. Mean g-factor < 1.0 in the R = 2 SSC data is likely the result of too few iterations in the numerical calculations.
Discussion and Conclusions
Long-𝜏 3D spiral acquisitions are well suited for parallel imaging acceleration due to high SNR efficiency. These results demonstrate that the spiral staircase trajectory reduces g-factor to near optimal (1.0), expanding the utility of parallel imaging even with non-ideal coil geometries. Note as well as reduced overall g-factor there is reduced structure in the g-factor map, which further improves image appearance.
Acknowledgements
Thanks to Melvyn Ooi and Zhiqiang Li for assisting with data collection and transfer.References
- F. A. Breuer, M. Blaimer, M. F. Mueller, N. Seiberlich, R. M. Heidemann, M. A. Griswold, and P. M. Jakob, “Controlled aliasing in volumetric parallel imaging (2D CAIPIRINHA),” Magn. Reson. Med., vol. 55, no. 3, pp. 549–556, 2006.
- S. R. Yutzy, N. Seiberlich, J. L. Duerk, and M. A. Griswold, “Improvements in multislice parallel imaging using radial CAIPIRINHA,” Magn. Reson. Med., vol. 65, no. 6, pp. 1630–1637, 2011.
- D. C. Turley and J. G. Pipe, “Distributed spirals: A new class of three-dimensional k-space trajectories,” Magn. Reson. Med., vol. 70, no. 2, pp. 413–419, 2013.
- W. Deng, B. Zahneisen, and V. A. Stenger, “Rotated stack-of-spirals partial acquisition for rapid volumetric parallel MRI,” Magn. Reson. Med., vol. 76, no. 1, pp. 127–135, Jul. 2016.
- J. G. Pipe, E. Ahunbay, and P. Menon, “Effects of interleaf order for spiral MRI of dynamic processes,” Magn. Reson. Med., vol. 41, no. 2, pp. 417–422, 1999.
- P. M. Robson, A. K. Grant, A. J. Madhuranthakam, R. Lattanzi, D. K. Sodickson, and C. A. McKenzie, “Comprehensive quantification of signal-to-noise ratio and g-factor for image-based and k-space-based parallel imaging reconstructions,” Magn. Reson. Med., vol. 60, no. 4, pp. 895–907, 2008.
- D. Wang, N. R. Zwart, and J. G. Pipe, “Joint water–fat separation and deblurring for spiral imaging,” Magn. Reson. Med., vol. 79, no. 6, pp. 3218–3228, 2018.
Figures