2402
System conditioning during GRAPPA kernel training improves temporal SNR in accelerated EPI-based functional, diffusion, and perfusion MRI applications1Radiology, Brigham and Women's Hospital, Boston, MA, United States, 2Department of Radiology, Harvard Medical School, Boston, MA, United States, 3Athinoula A. Martinos Center for Biomedical Imaging, Massachusetts General Hospital, Charlestown, MA, United States, 4Harvard-MIT Health Sciences and Technology, Massachusetts Institute of Technology, Cambridge, MA, United States
Synopsis
This work examines methods to improve the conditioning of the linear system of equations used to compute GRAPPA and Dual-Polarity GRAPPA reconstruction coefficients, and it's effect on temporal SNR in applications that employ accelerated EPI data. We test three methods: (i) system normalization, (ii) simple Tikhonov regularization, and (iii) 2D k-space filters applied to the calibration data prior to the linear system formation. Examples of tSNR improvement are shown, drawing from EPI-based in-vivo functional, diffusion, and perfusion imaging data acquired at 3T and 7T.
Introduction
Accelerated parallel MR imaging (pMRI) can increase temporal efficiency and reduce geometric distortions in echo planar imaging (EPI). However, these improvements come at a cost of SNR loss due to g-factor effects. To date, many investigations to mitigate SNR loss in pMRI methods have focused on SENSE[1,2], perhaps in part because the SENSE linear system of equations map naturally to cost-function minimization approaches[3]. System conditioning in GRAPPA[4], however, has received less attention.
This work examines methods to mitigate SNR loss in GRAPPA-based reconstructions of accelerated 2D EPI data. We examine system normalization/preconditioning, Tikhonov regularization, and 2D filters applied to the k-space calibration data set itself, and their effect on EPI-based functional, diffusion, and perfusion imaging.
Methods
GRAPPA reconstructs under-sampled imaging data by estimating missing data from a linear combination of sampled data. This is modeled as $$K g = t,$$ with $$$t$$$ the target k-space data, $$$K$$$ an array composed of neighboring k-space data, and $$$g$$$ a coefficients vector that maps elements of $$$K$$$ to $$$t$$$.
Although $$$K$$$ is typically over-determined, the condition of the system can often be improved. One approach is preconditioning[5], $$\psi K g = \psi t ,$$ with $$$\psi$$$ a diagonal matrix with elements normalized to rows of the system matrix, $$$\psi_{ii} = 1 / \sqrt{\sum_j \left| K_{ij} \right|^2}$$$. With most of the signal energy concentrated in the center region of k-space, preconditioning can normalize the signal-energy balance across all rows of the system. A similar effect can be achieved by applying a 2D k-space filter prior to forming $$$K$$$ [6], to reduce bias from the high-signal central region.
After forming the normal equations $$K^H \psi^2 K g = K^H \psi^2 t $$ to produce a smaller system matrix and reduce computational load, Tikhonov regularization[7] can be applied which results in $$(K^H \psi^2 K + \lambda I) g = K^H \psi^2 t.$$
The effect on temporal SNR (tSNR)[8] of including the preconditioning factor $$$\psi$$$, applying k-space filters, and varying $$$\lambda$$$, in accelerated EPI data is presented below. In-plane accelerated gradient-echo BOLD-weighted EPI data (1.5 mm iso, TR=2 sec, TE=22 ms, 128x128 matrix size, 41 slices, R=3, 75 repetitions) at 7T and PASL-based perfusion-weighted (3.4x3.4x4.0 mm, TR=3.2 sec, TE=13 ms, 64x64 matrix size, 24 slices, R=2, Q2TIPS labeling (TI=1800 ms, 700 ms bolus), 52 control/label pairs) and diffusion-weighted (2.0 mm iso, TR=7.7 sec, TE=84 ms, 128x128 matrix size, R=2, 59 slices, b=1000 s/mm2, 1 diffusion direction, 61 repetitions) data at 3T, respectively, were acquired in-vivo.
Conventional multi-shot EPI pre-scan calibration data was collected using temporal encoding for Dual-Polarity GRAPPA (DPG)[9] calibration. DPG reconstruction was performed to both remove Nyquist ghosts and synthesize missing data. While not shown, standard GRAPPA reconstructions followed similar trends. Calculated tSNR maps along with the corresponding condition number---the ratio of the smallest to largest singular value, σmin/σmax, of the modified system matrix---are shown in the Results.
Results
Figure 1 presents tSNR maps of the BOLD-weighted EPI data. The lowest tSNR is seen where no system regularization or normalization is used, Fig. 1a. As various system conditioning methods are applied, the tSNR improves. Similarly, Figure 2, as the number of phase-encode lines centered around the echo (at ky=0) that contribute to the GRAPPA linear system is increased, both the condition number and the tSNR increases.
Figure 3 illustrates the tSNR of the BOLD-weighted data after applying k-space filters prior to GRAPPA linear system formation. The applied filter is shown below the tSNR image for each case. Filtering boosts tSNR in all cases by emphasizing high-spatial-frequency k-space data, with minimal difference between the various filters.
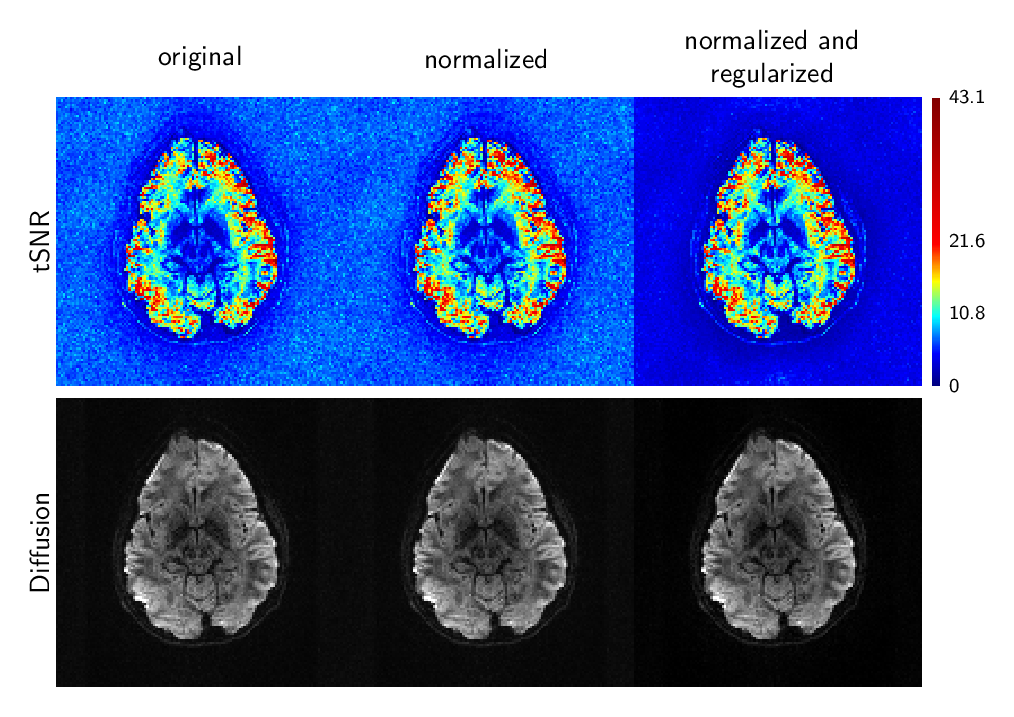
Figure 4 illustrates tSNR maps and corresponding images for the diffusion-weighted data. Although the effect is subtle, the tSNR maps show that diffusion tSNR can be improved via algorithmic normalization and regularization.
Discussion and Conclusions
This study demonstrates that system conditioning approaches can have a positive impact on temporal SNR when reconstructing accelerated EPI data using DPG. While the effects of regularization have been previously investigated in the context of BOLD-weighted EPI[10], we have demonstrated here that diffusion and perfusion applications can also benefit. Further, we demonstrated that the application of high-pass k-space filters has a regularizing effect, which follows from the well known property that introducing white noise in the calibration data is similar to Tikhonov regularization[11,12]. Normalizing the system with the preconditioning operator, $$$\psi$$$, is preferable, however, as it is more easily automated.Acknowledgements
This work was supported in part by the NIH NIBIB (grants P41-EB015896, R01-EB019437, and R03-EB023489), by the BRAIN Initiative (NIH NIMH grant R01-MH111419), and by the MGH/HST Athinoula A. Martinos Center for Biomedical Imaging; and was made possible by the resources provided by NIH Shared Instrumentation Grant S10-RR023043.References
- King KF and Angelos A. "SENSE image quality improvement using matrix regularization." In Proc. of the ISMRM 9th Scientific Meeting, page 1771, Glasgow, Scotland, Apr 2001.
- Lin F-H, Kwong KK, Belliveau JW, Wald LL. "Parallel imaging reconstruction using automatic regularization." Magn Reson Med, 51(3):559--567, Mar 2004.
- Hoge WS, Brooks DH, Madore B, and Kyriakos WE. "A tour of accelerated parallel MR imaging from a linear systems perspective." Concepts in MR, 27A(1):17--37, 2005.
- Griswold MA, Jakob PM, Heidemann RM, Nittka M, Jellus V, Wang J, Kiefer B, Haase A. "Generalized autocalibrating partially parallel acquisitions (GRAPPA)." Magn Reson Med, 47(6):1202--1210, Jun 2002.
- Björck Å. Numerical methods for least squares problems, chapter 7.2.6, page 283. SIAM Press, 1996.
- Huang F, Li Y, Vijayakumar S, Hertel S, Duensing GR. "High-pass GRAPPA: An image support reduction technique for improved partially parallel imaging." Magn Reson Med, 59(3):642--649, 2008.
- Björck Å. Numerical methods for least squares problems, chapter 2.7.2., page 101. SIAM Press, 1996.
- Triantafyllou C, Polimeni JR, Wald LL. "Physiological noise and signal-to-noise ratio in fMRI with multi-channel array coils." Neuroimage, 55(2):597--606, 2011.
- Hoge WS, Polimeni JR. "Dual-polarity GRAPPA for simultaneous reconstruction and ghost correction of EPI data." Magn Reson Med, 76(1):32--44, 2016
- Polimeni JR, Bhat H, Witzel T, Benner T, Feiweier T, Inati SJ, Renvall V, Heberlein K, Wald LL. "Reducing sensitivity losses due to respiration and motion in accelerated Echo Planar Imaging by reordering the autocalibration data acquisition." Magn Reson Med, 75(2):665--679, Feb 2016.
- Sodickson DK. "Tailored SMASH image reconstructions for robust in vivo parallel MR imaging." Magn Reson Med, 44(2):243--251, Aug 2000
- Ding Y, Xue H, Ahmad R, Chang T-C, Ting ST, Simonetti OP. "Paradoxical effect of the signal-to-noise ratio of GRAPPA calibration lines: A quantitative study." Magn Reson Med, 74(1):231--239, 2015.
Figures
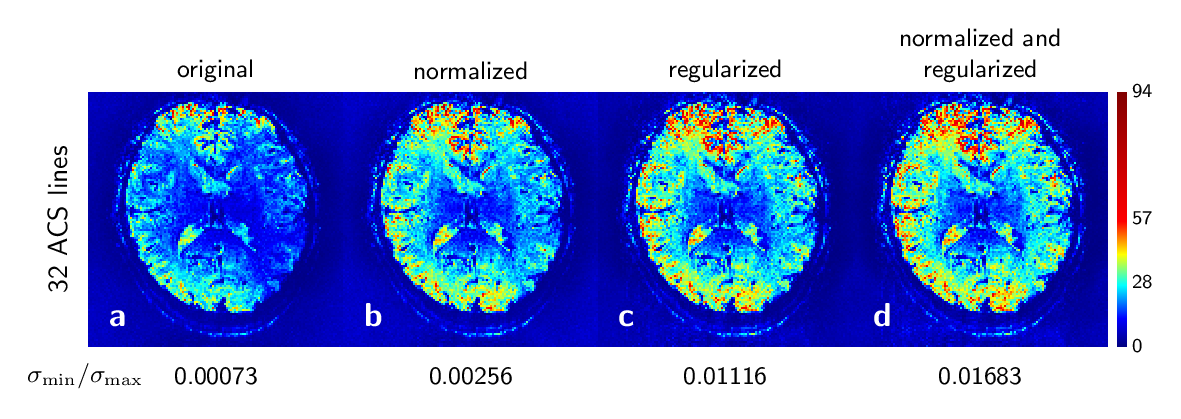
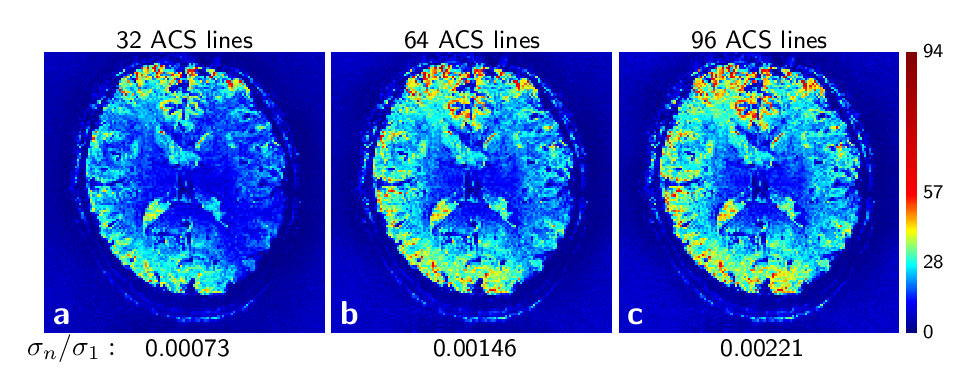
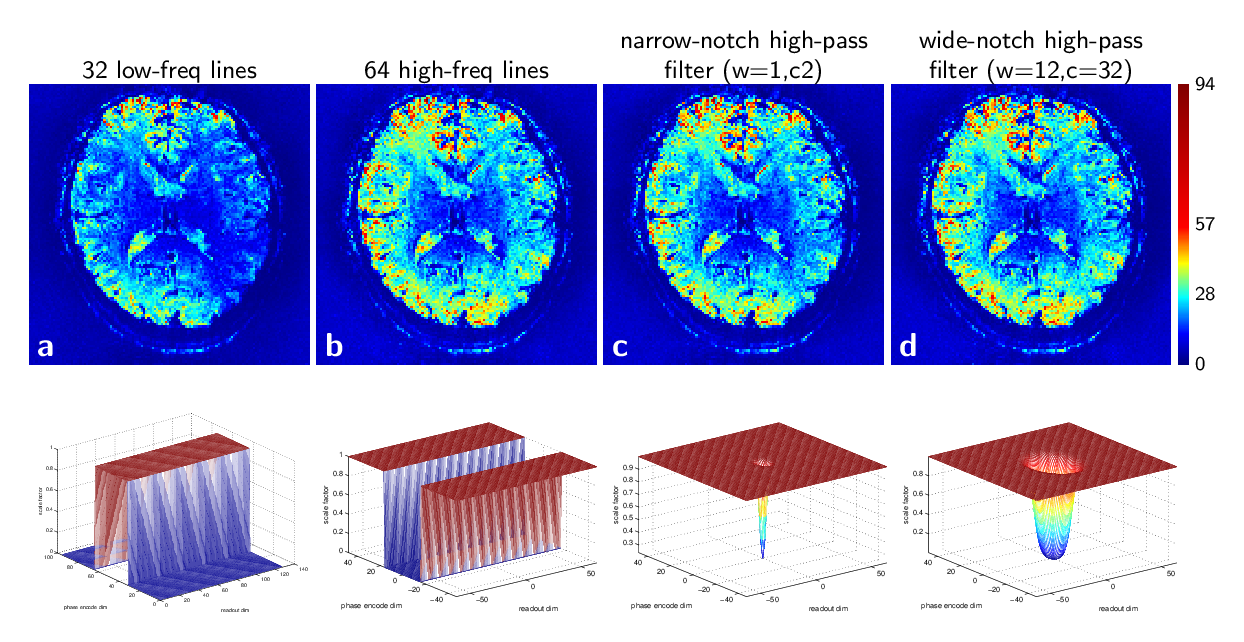
Figure 3. tSNR maps of 7T BOLD-weighted EPI data after k-space filters have been applied. The mesh plots illustrate the filter applied prior to GRAPPA calibration for each tSNR image in the first row. Sub-figure (b) corresponds to a filter that selects 64 high-spatial-frequency k-space lines from the calibration data. Plots (c) and (d) show a narrow-notch (w=1, c=2) and wide-notch (w=16, c=32) filter, generated from Eq. 2 of [5], $$$F_2 = 1 - (1 + e^{(\sqrt{k_x^2 + k_y^2} - c )/w})^{-1} + (1 + e^{(\sqrt{ k_x^2 + k_y^2} + c)/w})^{-1}$$$,
where c and w control the cut-off frequency and the sharpness of the filter boundary.