2396
Spleen metabolism altered by human pancreatic cancer xenograftsSantosh Kumar Bharti1, Paul T Winnard1, Raj Kumar Sharma1, Yelena Mironchik1, Marie-France Penet1,2, and Zaver M. Bhujwalla1,2,3
1Division of Cancer Imaging Research, The Russell H. Morgan Department of Radiology and Radiological Science, The Johns Hopkins University School of Medicine, Baltimore, MD, United States, 2Sidney Kimmel Comprehensive Cancer Center, The Johns Hopkins University School of Medicine, Baltimore, MD, United States, 33Department of Radiation Oncology and Molecular Radiation Sciences, The Johns Hopkins University School of Medicine, Baltimore, MD, United States
Synopsis
Cachexia is a poorly understood metabolic syndrome characterized by cancer-induced tissue wasting and weight loss. Cachexia occurs with the highest frequency and severity in pancreatic ductal adenocarcinoma (PDAC). To further understand this syndrome, here we used 1H MRS to analyze spleen metabolites in normal mice and mice with and without cachexia-inducing PDAC. We detected profound spleen weight loss in cachectic mice. 1H MR spectra identified significant depletion of amino acids, cholines, creatine in cachectic mice that provide new insights into the syndrome that may present novel strategies to prevent or reduce cachexia-induced weight loss and the morbidity and mortality associated with the syndrome
Introduction
Cancer-induced cachexia accounts for approximately 20% of all cancer deaths 1. In pancreatic cancer, the syndrome affects nearly 80% of patients 2-3. The extreme weight loss due to cachexia results in a particularly poor quality of life causing profound weakness, listlessness, and inability to function. In pancreatic cancer especially, where resection is not possible for a majority of patients, palliation with chemotherapy is the only option of prolonging life, and cachexia results in lower tolerance to chemotherapy. Cachectic patients experience a wide range of symptoms affecting several organ functions such as muscle, liver, brain, and heart, that decrease quality of life and worsen prognosis. A major characteristic of cachexia is the accelerated skeletal muscle and fat storage wasting causing nutrient mobilization both directly as lipid and amino acids, and indirectly as glucose derived from the exploitation of liver gluconeogenesis that reaches the tumor through the bloodstream 4. Patients with cachexia develop a wide range of metabolic stress from increased proteins and fat tissue burning resulting in increased energy expenditure. Previously, we have reported the initial characterization of a myoblast optical imaging reporter that allowed real-time longitudinal monitoring of the early onset of cancer induced wasting and measured plasma metabolic changes associated with PDAC-induced cachexia 5. Here, for the first time, we have performed high-resolution quantitative 1H magnetic resonance spectroscopy (MRS) of spleen tissue obtained from normal mice and mice bearing PDAC that are cachectic (Pa04C) and non-cachectic (Panc1). A significant reduction in spleen weight and significant changes in 1H MRS derived metabolite profiles were detected with cachexia.Methods
The human pancreatic cancer cell line, Panc1, was obtained from ATCC. The human pancreatic cancer cell line, Pa04C, was provided by Dr. Maitra 6. Six to 8 week old male severe combined immunodeficient mice were inoculated in the right flank with cancer cells (5 ×10⁶). Mice were euthanized once tumors were ~ 300 mm3. Control, cachectic and non-cachectic groups consists of 9, 10 and 9 mice per group respectively. Once the mice were sacrificed, spleens were harvested, freeze clamped and stored at -80°C for 1H MRS analysis. Dual phase solvent extraction was performed on spleen tissue. The water phase was separated, freeze dried, reconstituted in D2O PBS and transfer to an NMR tube for spectral acquisition. All 1H MR spectra were acquired on an Avance III 750 MHz (17.6T) Bruker NMR spectrometer equipped with a 5 mm broad band inverse (BBI) probe. 1H MR spectra with water suppression were acquired using a single pulse sequence with the following experimental parameters: spectral width of 15495.86 Hz, data points of 64 K, 90° flip angle, relaxation delay 10 sec, acquisition time 2.11 sec, 64 scans with 8 dummy scans, receiver gain 80.6. Spectral acquisition, processing and quantification were performed using TOPSPIN 3.5 software.Results and Discussion
As anticipated, mice with cachexia-inducing Pa04C tumors showed significant weight loss with time. For the first time we observed that spleens from Pa04C tumor bearing mice showed a profound weight loss (Figure 1) when compared to spleens from normal mice and mice with Panc1 tumors. An increase in the size of the liver and spleen has been previously reported in terminal cachectic human patients from colorectal cancer measured by CT scan 2-11 months prior to death 7. Quantitative 1H MRS analysis of water-soluble metabolites of spleen showed significant metabolic perturbations associated with cachexia (Figure 2). A significant decrease in almost all amino acids was observed in cachectic (Pa04C) mouse spleens compared to normal and non-cachectic (Panc1) mouse spleens (Figure 3). Differences in choline metabolites, creatine, glutamine, glutamate, glutathione and aspartate were observed in cachectic mouse spleens compared to non-cachectic mouse spleens and spleens from healthy control mice (Figure 3). The significant decrease of amino acids in the cachectic spleens may reflect increased utilization of amino acids by the tumor or other organs during the cachexia muscle/protein wasting 4. These results provide new insights into changes in spleen metabolism during cachexia, and support investigating metabolic targets to reduce cachexia associated morbidityAcknowledgements
Supported by NIH R01CA193365 and R35CA209960.References
1. Argiles, J. M.; Busquets, S.; Stemmler, B.; Lopez-Soriano, F. J., Cancer cachexia: understanding the molecular basis. Nature reviews. Cancer 2014, 14 (11), 754-62. 2. Fearon, K. C.; Baracos, V. E., Cachexia in pancreatic cancer: new treatment options and measures of success. HPB (Oxford) 2010, 12 (5), 323-4. 3. Ozola Zalite, I.; Zykus, R.; Francisco Gonzalez, M.; Saygili, F.; Pukitis, A.; Gaujoux, S.; Charnley, R. M.; Lyadov, V., Influence of cachexia and sarcopenia on survival in pancreatic ductal adenocarcinoma: A systematic review. Pancreatology : official journal of the International Association of Pancreatology 2015, 15 (1), 19-24. 4. Porporato, P. E., Understanding cachexia as a cancer metabolism syndrome. Oncogenesis 2016, 5, e200. 5. Winnard, P. T.; Bharti, S.; Penet, M.-F.; Marik, R.; Mironchik, Y.; Wildes, F.; Maitra, A.; Bhujwalla, Z. M., Detection of Pancreatic Cancer-induced Cachexia using a Fluorescent Myoblast Reporter System and Analysis of Metabolite Abundance. Cancer Research 2015. 6. Penet, M. F.; Shah, T.; Bharti, S.; Krishnamachary, B.; Artemov, D.; Mironchik, Y.; Wildes, F.; Maitra, A.; Bhujwalla, Z. M., Metabolic imaging of pancreatic ductal adenocarcinoma detects altered choline metabolism. Clinical cancer research : an official journal of the American Association for Cancer Research 2015, 21 (2), 386-95. 7. Lieffers, J. R.; Mourtzakis, M.; Hall, K. D.; McCargar, L. J.; Prado, C. M. M.; Baracos, V. E., A viscerally driven cachexia syndrome in patients with advanced colorectal cancer: contributions of organ and tumor mass to whole-body energy demands. The American journal of clinical nutrition 2009, 89 (4), 1173-1179.Figures

Figure
1: Changes in total spleen weight post tumor inoculation. After sacrificing the
mice, spleens from normal, cachectic (Pa04C) and non-cachectic (Panc1) mice were
removed and weighted. A significant decrease of spleen weight was observed with
cachexia (normal vs Panc1 mice, p>0.935;
normal vs Pa04C mice, # p<0.06;
Panc1 vs Pa04C; xp<0.02).
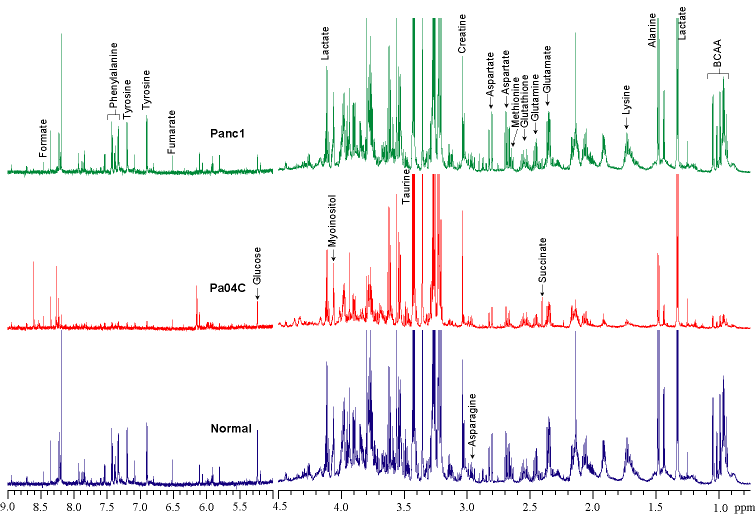
Figure 2:
Representative 1H MR spectra acquired from aqueous phase tissue extracts
of spleen obtained from normal mice and
cachectic (Pa04C ) and non-cachectic (Panc1) tumor bearing mice.

Figure 3: Quantitative estimation of metabolites in water-soluble
extracts from spleen. Unpaired one tailed Student t-tests were performed
between Normal (n=9) vs Panc1 (n=9),
Normal vs Pa04C (n=10) and Panc1 vs Pa04C; p-values <0.05 were
considered significant. Bar plots represent
Mean ± SEM. Areas under the peaks were normalized to references and sample
weights. * represents significant difference between Normal vs Panc1, # represents
significant difference between Normal vs
Pa04C, and x represents significant difference between Pa04C vs Panc1.