2390
Stacked In-plane Histology for Quantitative Validation of Non-invasive Imaging Biomarkers: Application to an Infiltrative Brain Tumour Model1Glasgow Experimental MRI Center, University of Glasgow, Glasgow, United Kingdom, 2Centre of Clinical Brain Science, Edinburgh, United Kingdom, 3Institute of Cancer Sciences, University of Glasgow, Glasgow, United Kingdom, 4University of Glasgow, Glasgow, United Kingdom, 5Department of Clinical Physics and Bioengineering, Greater Glasgow Health Board and University of Glasgow, Glasgow, United Kingdom, 6Institute of Cancer Sciences, Glasgow university, Glasgow, United Kingdom
Synopsis
Despite the advance in medical imaging, it is important to validate new imaging biomarkers for a particular disease against histopathology, which is considered the ground truth. Here we propose a methodology for the quantitative validation of MRI biomarkers by the co-registration of histological probability maps with MR images. Using a mouse model of infiltrative brain tumours, we show this approach is far more robust than those currently applied.
Introduction
When new methods are proposed as imaging biomarkers for a particular disease state, it is important that they are validated against histopathology. However, this is typically done via qualitative comparison with single histological sections, often with little attempt made at co-registration. We propose a methodology for the quantitative validation of MRI biomarkers by the co-registration of histological probability maps with MR images. This involves 1. Flash-freeze fixation: cryopreservation of tissue, the preferred method of fixation for minimal tissues shrinkage and optimal antigenicity. 2. In-plane sectioning: The histological sections were carefully cut in exactly the same plane as the MR images. This is particularly important where the pathology is heterogeneous, with variation occurring on the length scales of the MRI slice thickness. 3. Multiple slice stacks: To take account of the large difference in thickness between MR images (~1.5 mm) and histological sections (~20 𝜇m), multiple histological sections were registered and combined to produce a histological probability map, covering the same slice thickness as the MRI. 4. Quantitative histological staining: Using stains where the intensity varies proportionally to the observed phenomenon, allows for MR-histology signal comparison. We have applied this approach to a mouse infiltrative brain tumour model. This produced high-quality Tumour Cell Density (TCD) maps precisely co-registered with the corresponding MR images. These TCD maps were generated using both haematoxylin and eosin (H&E) stain and Human Leukocyte Antigen (HLA), which stains for patient-derived tumour cell density.Materials and Methods
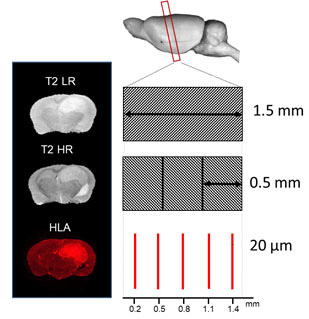
Ten CD1 nude mice were intracranially injected with a G7 Glioblastoma model [1] , which is highly infiltrative at the margins. The mice were scanned with MRI at week 9 and week 12 using a Bruker Biospec 7T system. Scans included: T1 weighted (T1w) , T2 weighted (T2w), Diffusion Tensor Imaging (DTI), perfusion imaging (PWI), and contrast Enhanced CE T1. Following the last scan, the brain was quickly excised from the skull and flash frozen. The frozen brain was carefully cut in exactly the same plane as the high- resolution T2w (T2HR) (0.5 mm thickness), by adjusting the cutting angles until both have the same orientation (see fig.1). The best three histology sections (thickness 20 μm) were co-registered to create a Tumour Cell Density (TCD) map. Finally, the TCD map was co-registered with the MR images to make a 3-dimensional data matrix, which allows for direct quantitative evaluation.Results
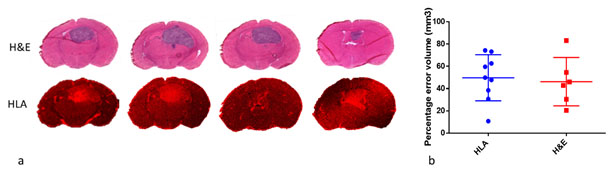
Examining the 20um histological sections shown in figure 2a, it is clear that tumour size and shape vary significantly through the 1.5 mm MRI slice. Using the common practice of determining tumour volume from a single slice, we find large variations in the volume estimation depending on the particular slice chosen. We found the percentage difference between the largest and smallest such volume was 49.7% for HLA and 46.2% for H&E, see figure 2b.
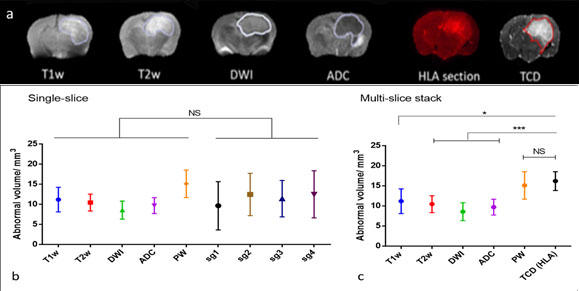
The different MRI modalities (see fig.3a) were assessed using both the single-slice and TCD approaches. Figure 3b shows MRI measured tumour volumes compared with volumes measured from single histological sections. The large standard deviations in volume estimation when using single histological sections, make it difficult to assess the MRI modalities, as no significant differences are seen between them. However, tumour volume measurements made using TCD’s show a higher abnormal volume than all other modalities and with a much reduced standard deviation, Figure 3c. There is now a statistically significant difference between volume measurements made with TCD’s and those measured with T1,T2, DW and ADC. Only perfusion-weighted MRI measurements show no significant difference with TCD tumour volume measurements.
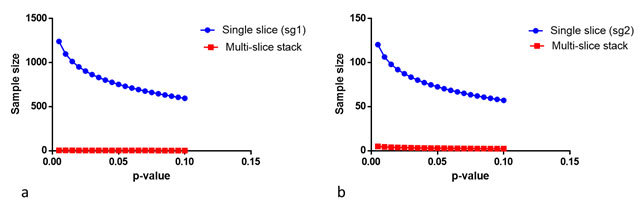
The reduction in the standard deviation of the TCD tumour volume measurements, compared to the single slice approach, makes it far easier to find statistically significant differences between measurements. For example, figure (4a,b) shows power calculations determining the number of animals needed to achieve significance, when comparing T2w volume measurements with the single-slice or multiple slice TCD approaches. Our results show that for the single approach between 78 and 800 animals would be needed to achieve p<0.05. Whereas, using the multi-slice TCD approach, only 9 animal would be needed to reach p<0.01.
Conclusion
- We present a novel method for the quantitative assessment of MRI biomarkers demonstrates its application in mouse tumour model.
- Stacked in-plane histological slices can be used to generate TCD maps, taking in account orientation and thickness. ·
- Co-register of MR images with TCD maps allows quantitative validation of new imaging biomarkers via direct voxel-by-voxel comparison. ·
- Multi-slice histology improves the accuracy of volume measurement, greatly reducing the number of animals required to reach statistical significance.
Acknowledgements
H. Al-Mubarak would like to thanks the Ministry of Higher Education and Scientific Research in Iraq for financial support.References
1. Natividad Gomez-Roman, K.S., Lesley Gilmour, Graham Hamilton, and Anthony J Chalmers, A novel 3D human glioblastoma cell culture system for modeling drug and radiation responses. Neuro-Oncology, 2017(19(2)): p. 229–241.Figures