2384
The Effects of Ground Truth Variance on Radio-Pathomic Mapping in Prostate Cancer1Biophysics, Medical College of Wisconsin, Wauwatosa, WI, United States, 2Radiology, Medical College of Wisconsin, Wawautosa, WI, United States, 3Pathology, Medical College of Wisconsin, Wawautosa, WI, United States, 4Pathology, University of Wisconsin Madison, Madison, WI, United States, 5Pathology, University of Chicago, Chicago, IL, United States, 6Biostatistics, Medical College of Wisconsin, Wawautosa, WI, United States, 7Urological Surgery, Medical College of Wisconsin, Wawautosa, WI, United States
Synopsis
achine learning provides a framework for non-invasively extracting more information from a clinical prostate scan by leveraging aligned post-surgical tissue samples with in-vivo imaging to create predictive models of histological characteristics. Many of these algorithms rely on a pathological diagnosis as the ground truth for the classification or regression task. This study aims to investigate the effects of varying the ground truth label in generating voxel-wise radio-pathomic maps of epithelium and lumen density in prostate cancer.
Introduction
Prostate cancer is the most frequently diagnosed noncutaneous cancer in men in the United States, accounting for approximately one in five new cancer diagnoses.(1) The current clinical protocol for diagnosis relies on tissue analysis prior to definitive therapy, where biopsies may be obtained using magnetic resonance imaging guidance. While ground truth has historically been considered the pathological diagnosis using Gleason grading criteria (G3-G5), it is becoming clear that the pathological diagnosis itself has moderate interobserver variability.(2)
Machine learning provides a framework for non-invasively extracting more information from a clinical prostate scan by leveraging aligned post-surgical tissue samples with in-vivo imaging to create predictive models of histological characteristics and clinical outcomes.(3, 4) Many of these algorithms rely on a pathological diagnosis as the ground truth for the classification or regression task. This study aims to determine if a previously published prostate cancer detection technique, radio-pathomic maps of lumen and epithelial density,(5) are dependent on pathologist defined regions of interest (ROIs).
Methods
Patient Population Thirty patients scheduled for radical prostatectomy were prospectively recruited for this institutional review board (IRB) approved study. Imaging was acquired on a 3T scanner (General Electric, Waukesha, WI) two weeks prior to surgery using an endorectal coil. MP-MRI included field-of-view (FOV) optimized and constrained undistorted single shot (FOCUS) diffusion weighted imaging (DWI) with ten b-values (b=0, 10, 25, 50, 80, 100, 200, 500, 1000, and 2000), T2-weighted imaging, and dynamic contrast enhanced imaging. Robotic prostatectomy was performed, and prostate samples were sectioned using patient-specific custom 3D printed slicing jigs to match the slice orientation to the T2 weighted image.
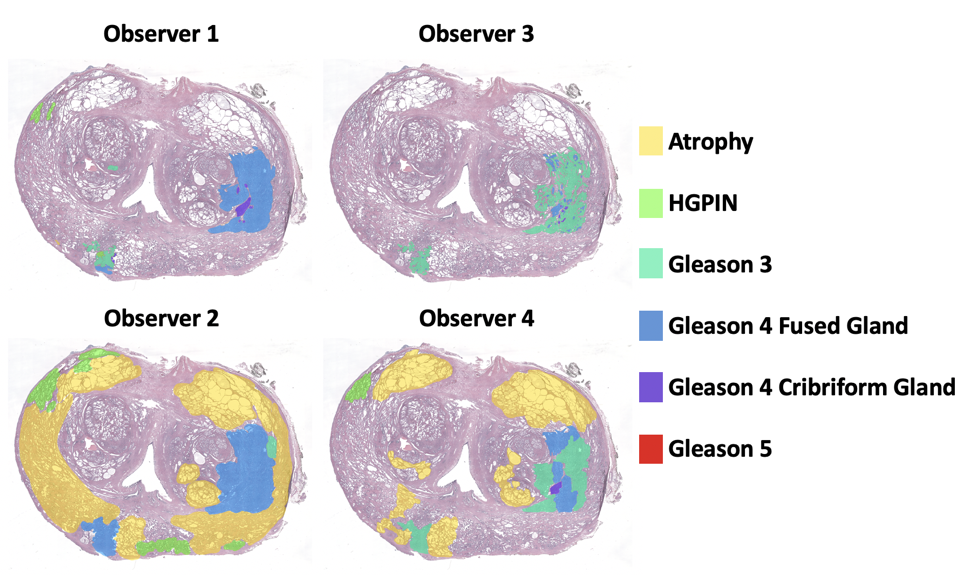
Tissue Processing Prostate samples were whole-mount hematoxylin and eosin (H&E) stained, digitized, and annotated by four urological fellowship trained pathologists from three institutions. Annotation was performed on a microsoft surface. All pathologists were instructed to mark the same six classes which included: Atrophy, HGPIN, G3, G4 fused gland, G4 cribriform gland, and G5. Annotation marker size was left to the discretion of the individual pathologist. A total of 33 slides were included in this study. Annotations were brought into MRI space using a non-linear transform, calculated from control points manually placed.(5, 6) Pathologist-annotated regions (PA-ROIs) that consisted of at least 50 contiguous voxels were included for further analysis. A morphological algorithm previously published(5) was applied in histology space to quantify lumen and epithelium density, these masks were aligned in T2 space using an identical transform.
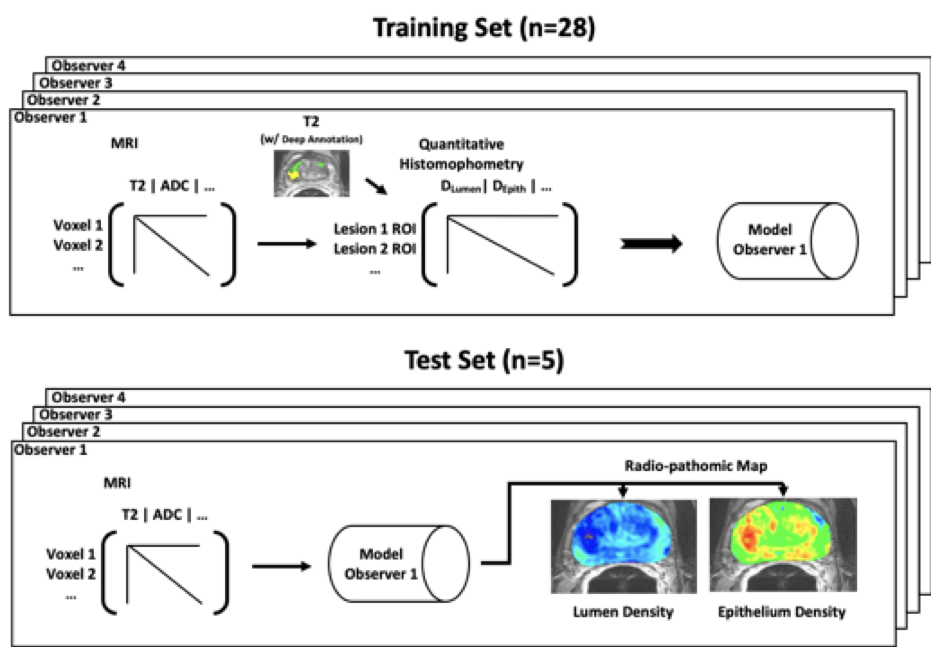
Radio-Pathomic Mapping Radio-pathomic mapping uses normalized MP-MRI values from six contrasts (ADC b=0-1000, ADC b=1000-2000, ADC b=500-2000, b=0, T2, and delta T1) to predict lumen and epithelium density in MRI space using a partial least squares regression algorithm with one latent variable. The 33 slides were split into 28 training and 5 test slides with balanced high grade tumor burden between the datasets. Models were created by evaluating a lesion-wise median value of lumen and epithelium density paired with the respective MRI values. A total of eight models were created, a lumen and epithelium model for each pathologist.
Model Evaluation Models were applied voxel-wise to the 5 held out slides in MRI space. Model performance was quantified voxel-wise within the test set as a correlation coefficient between models.
Results
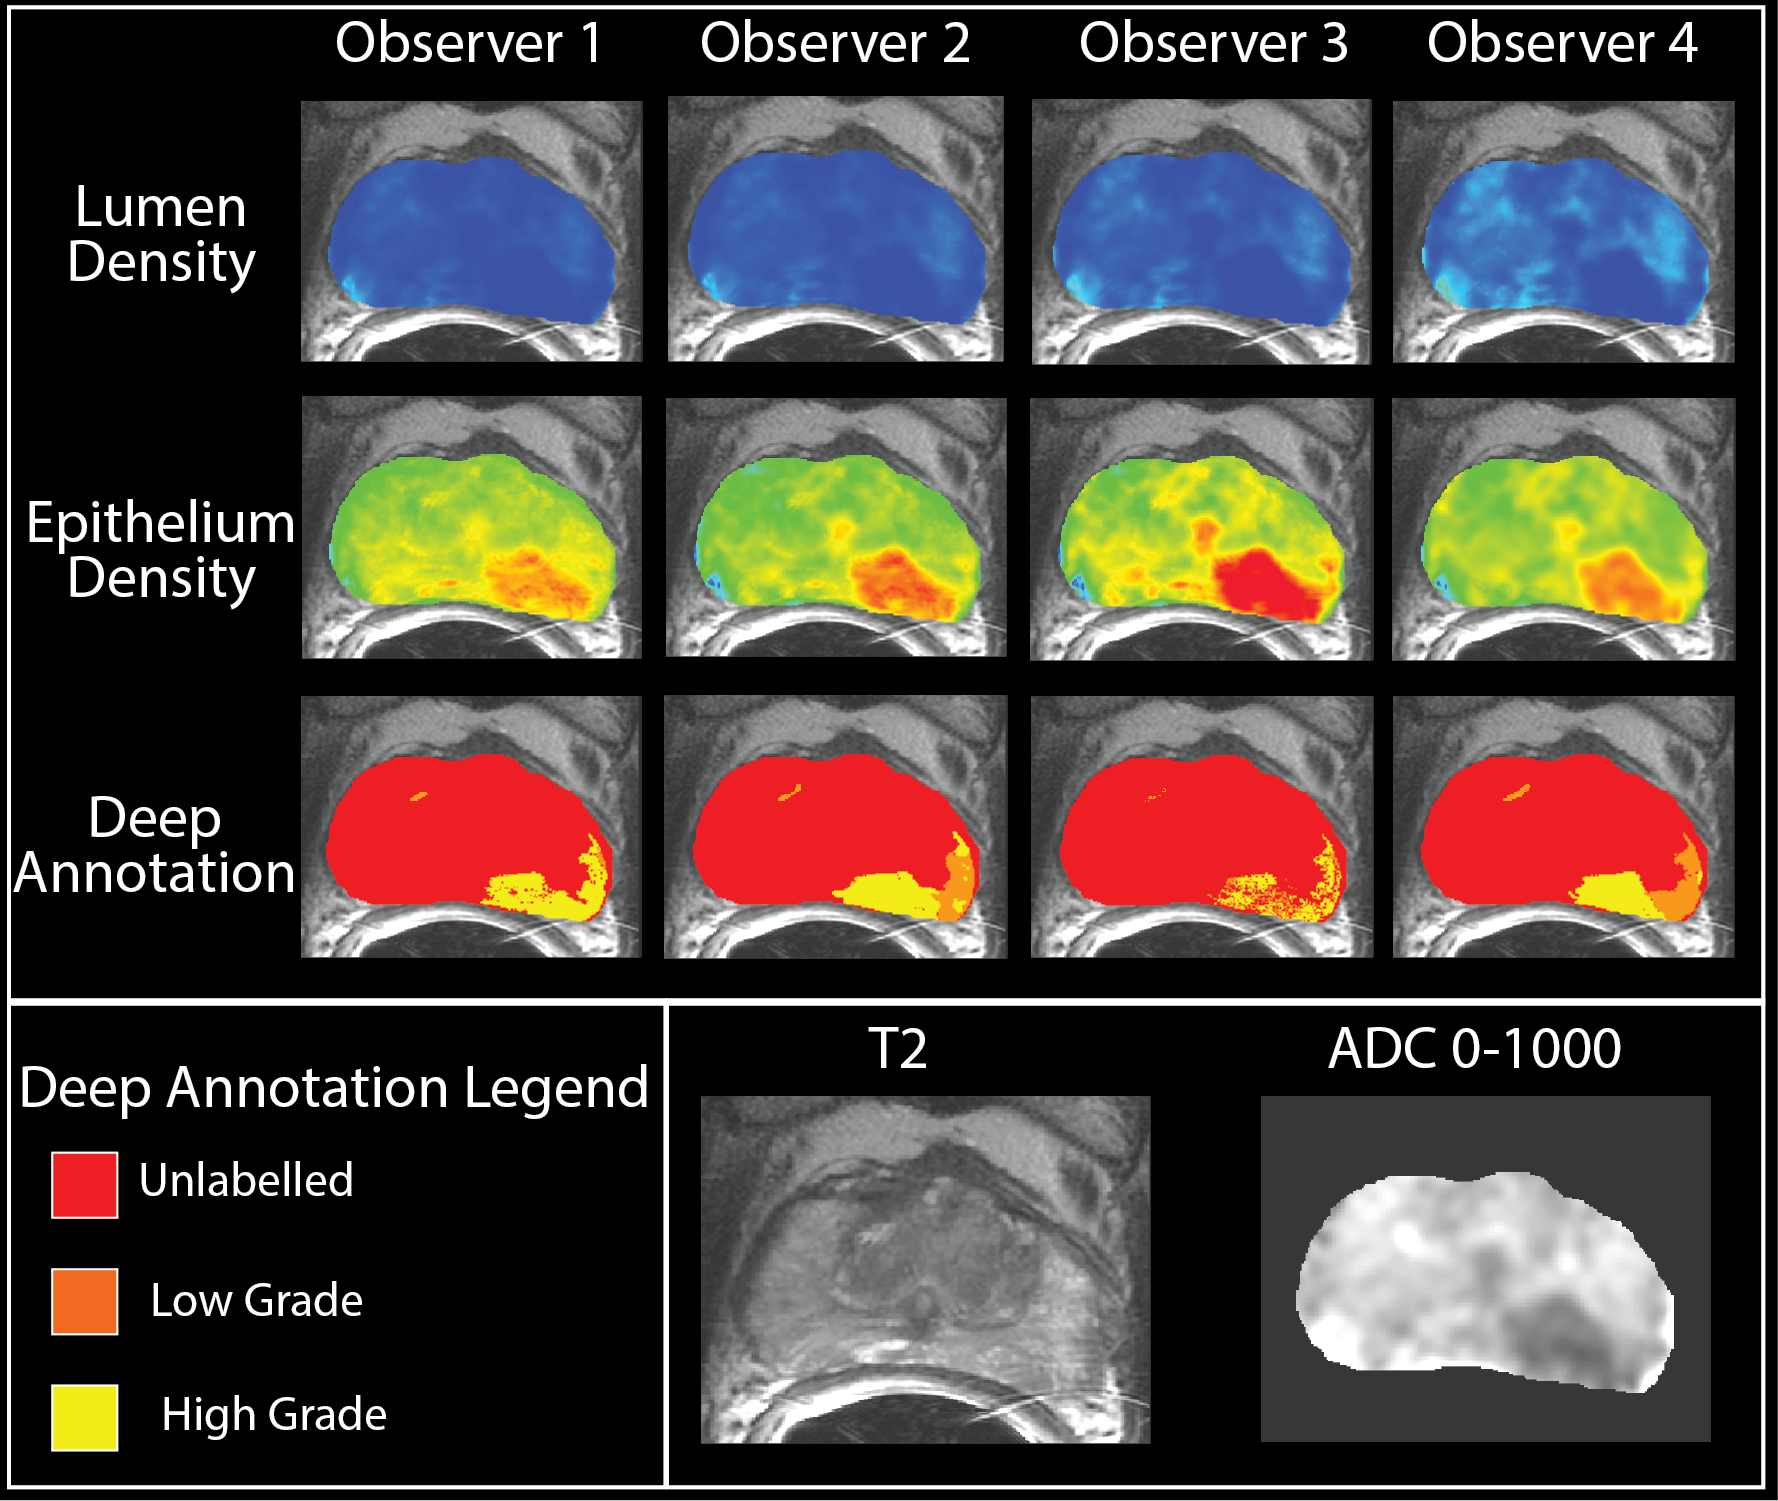
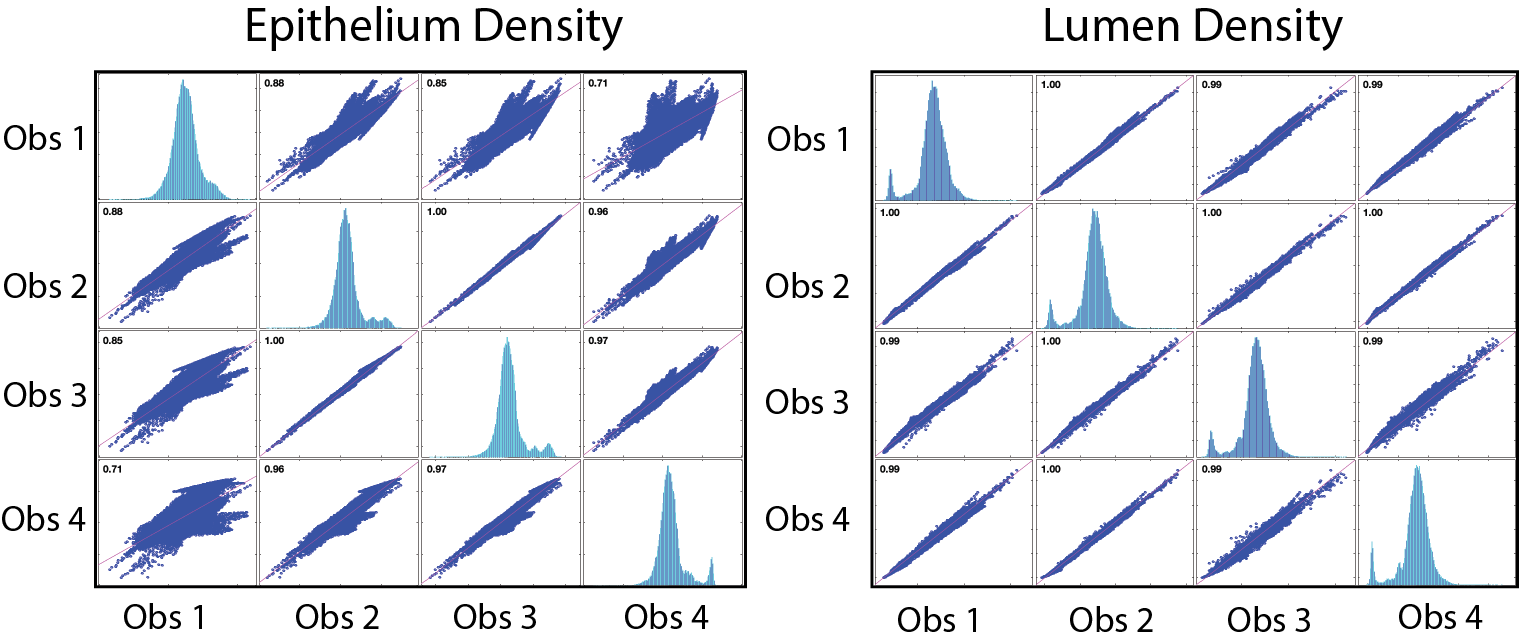
All models showed significant pairwise correlation ( p<0.001 ). Lumen models had a correlation coefficient (Figure 4) of at least 0.99, suggesting model stability with respect to ground truth variability. The epithelium models ranged from 0.71 to 1.00. Representative output maps can be seen in Figure 3 along with each pathologists respective deep annotation of that slice.Discussion and Conclusion
This study examined the effect of ground truth variability on the radio-pathomic mapping technique in prostate cancer. Models were trained using 28 slides, each of which were annotated by four pathologists. All models were then compared to a held out test set of 5 slides. In addition to demonstrating significant correlation between models, all models clearly indicate the presence of tumor associated regions.
Epithelium density maps showed greater variability than the lumen density maps. This difference may have resulted from the automated segmentation algorithm used to stratify epithelium and lumen density and its sensitivity to similarly colored stroma near epithelial cells in histology space. While all pathologists identified similar lesions, the style of annotation differed greatly between pathologists. Regardless, we found the proposed radio-pathomic mapping algorithm to be robust against ROI variability introduced by pathologist.
Acknowledgements
Funding was provided by the State of Wisconsin Tax Check-off Program for Prostate Cancer Research (RO1CA218144 and R01CA113580) and the National Center for Advancing Translational Sciences (NIH UL1TR001436 and TL1TR001437).References
1. Siegel RL, Miller KD, Jemal A. Cancer statistics, 2018. CA Cancer J Clin. 2018;68(1):7-30.
2. Allsbrook WC, Jr., Mangold KA, Johnson MH, Lane RB, Lane CG, Amin MB, Bostwick DG, Humphrey PA, Jones EC, Reuter VE, Sakr W, Sesterhenn IA, Troncoso P, Wheeler TM, Epstein JI. Interobserver reproducibility of Gleason grading of prostatic carcinoma: urologic pathologists. Hum Pathol. 2001;32(1):74-80.
3. Shah V, Pohida T, Turkbey B, Mani H, Merino M, Pinto PA, Choyke P, Bernardo M. A method for correlating in vivo prostate magnetic resonance imaging and histopathology using individualized magnetic resonance-based molds. Rev Sci Instrum. 2009;80(10):104301.
4. Wibmer A, Hricak H, Gondo T, Matsumoto K, Veeraraghavan H, Fehr D, Zheng J, Goldman D, Moskowitz C, Fine SW, Reuter VE, Eastham J, Sala E, Vargas HA. Haralick texture analysis of prostate MRI: utility for differentiating non-cancerous prostate from prostate cancer and differentiating prostate cancers with different Gleason scores. Eur Radiol. 2015;25(10):2840-50.
5. McGarry SD, Hurrell SL, Iczkowski KA, Hall W, Kaczmarowski AL, Banerjee A, Keuter T, Jacobsohn K, Bukowy JD, Nevalainen MT, Hohenwalter MD, See WA, LaViolette PS. Radio-pathomic Maps of Epithelium and Lumen Density Predict the Location of High-Grade Prostate Cancer. Int J Radiat Oncol Biol Phys. 2018;101(5):1179-87.
6. Hurrell SL, McGarry SD, Kaczmarowski A, Iczkowski KA, Jacobsohn K, Hohenwalter MD, Hall WA, See WA, Banerjee A, Charles DK, Nevalainen MT, Mackinnon AC, LaViolette PS. Optimized b-value selection for the discrimination of prostate cancer grades, including the cribriform pattern, using diffusion weighted imaging. J Med Imaging (Bellingham). 2018;5(1):011004.
Figures