2378
Measuring eye deformation between planning and proton beam therapy position using MRI.1Radiology & Ophthalmology, Leiden University Medical Center, Leiden, Netherlands, 2Radiology, Leiden University Medical Center, Leiden, Netherlands, 3Radiotherapy, Leiden University Medical Center, Leiden, Netherlands, 4Ophthalmology, Leiden University Medical Center, Leiden, Netherlands
Synopsis
MRI is becoming a new important imaging modality for ocular tumours. The acquisition of the MR-images for therapy planning are acquired in supine position, but proton beam radiotherapy is performed with the patient in sitting position. By performing scans in supine and in flexed position, we found that this change in gravity direction produces no substantial changes (<0.3mm) in eye and tumour shape. Our results indicate that supinely acquired MR images can be used to accurately plan proton beam radiotherapy of ocular tumours.
Introduction
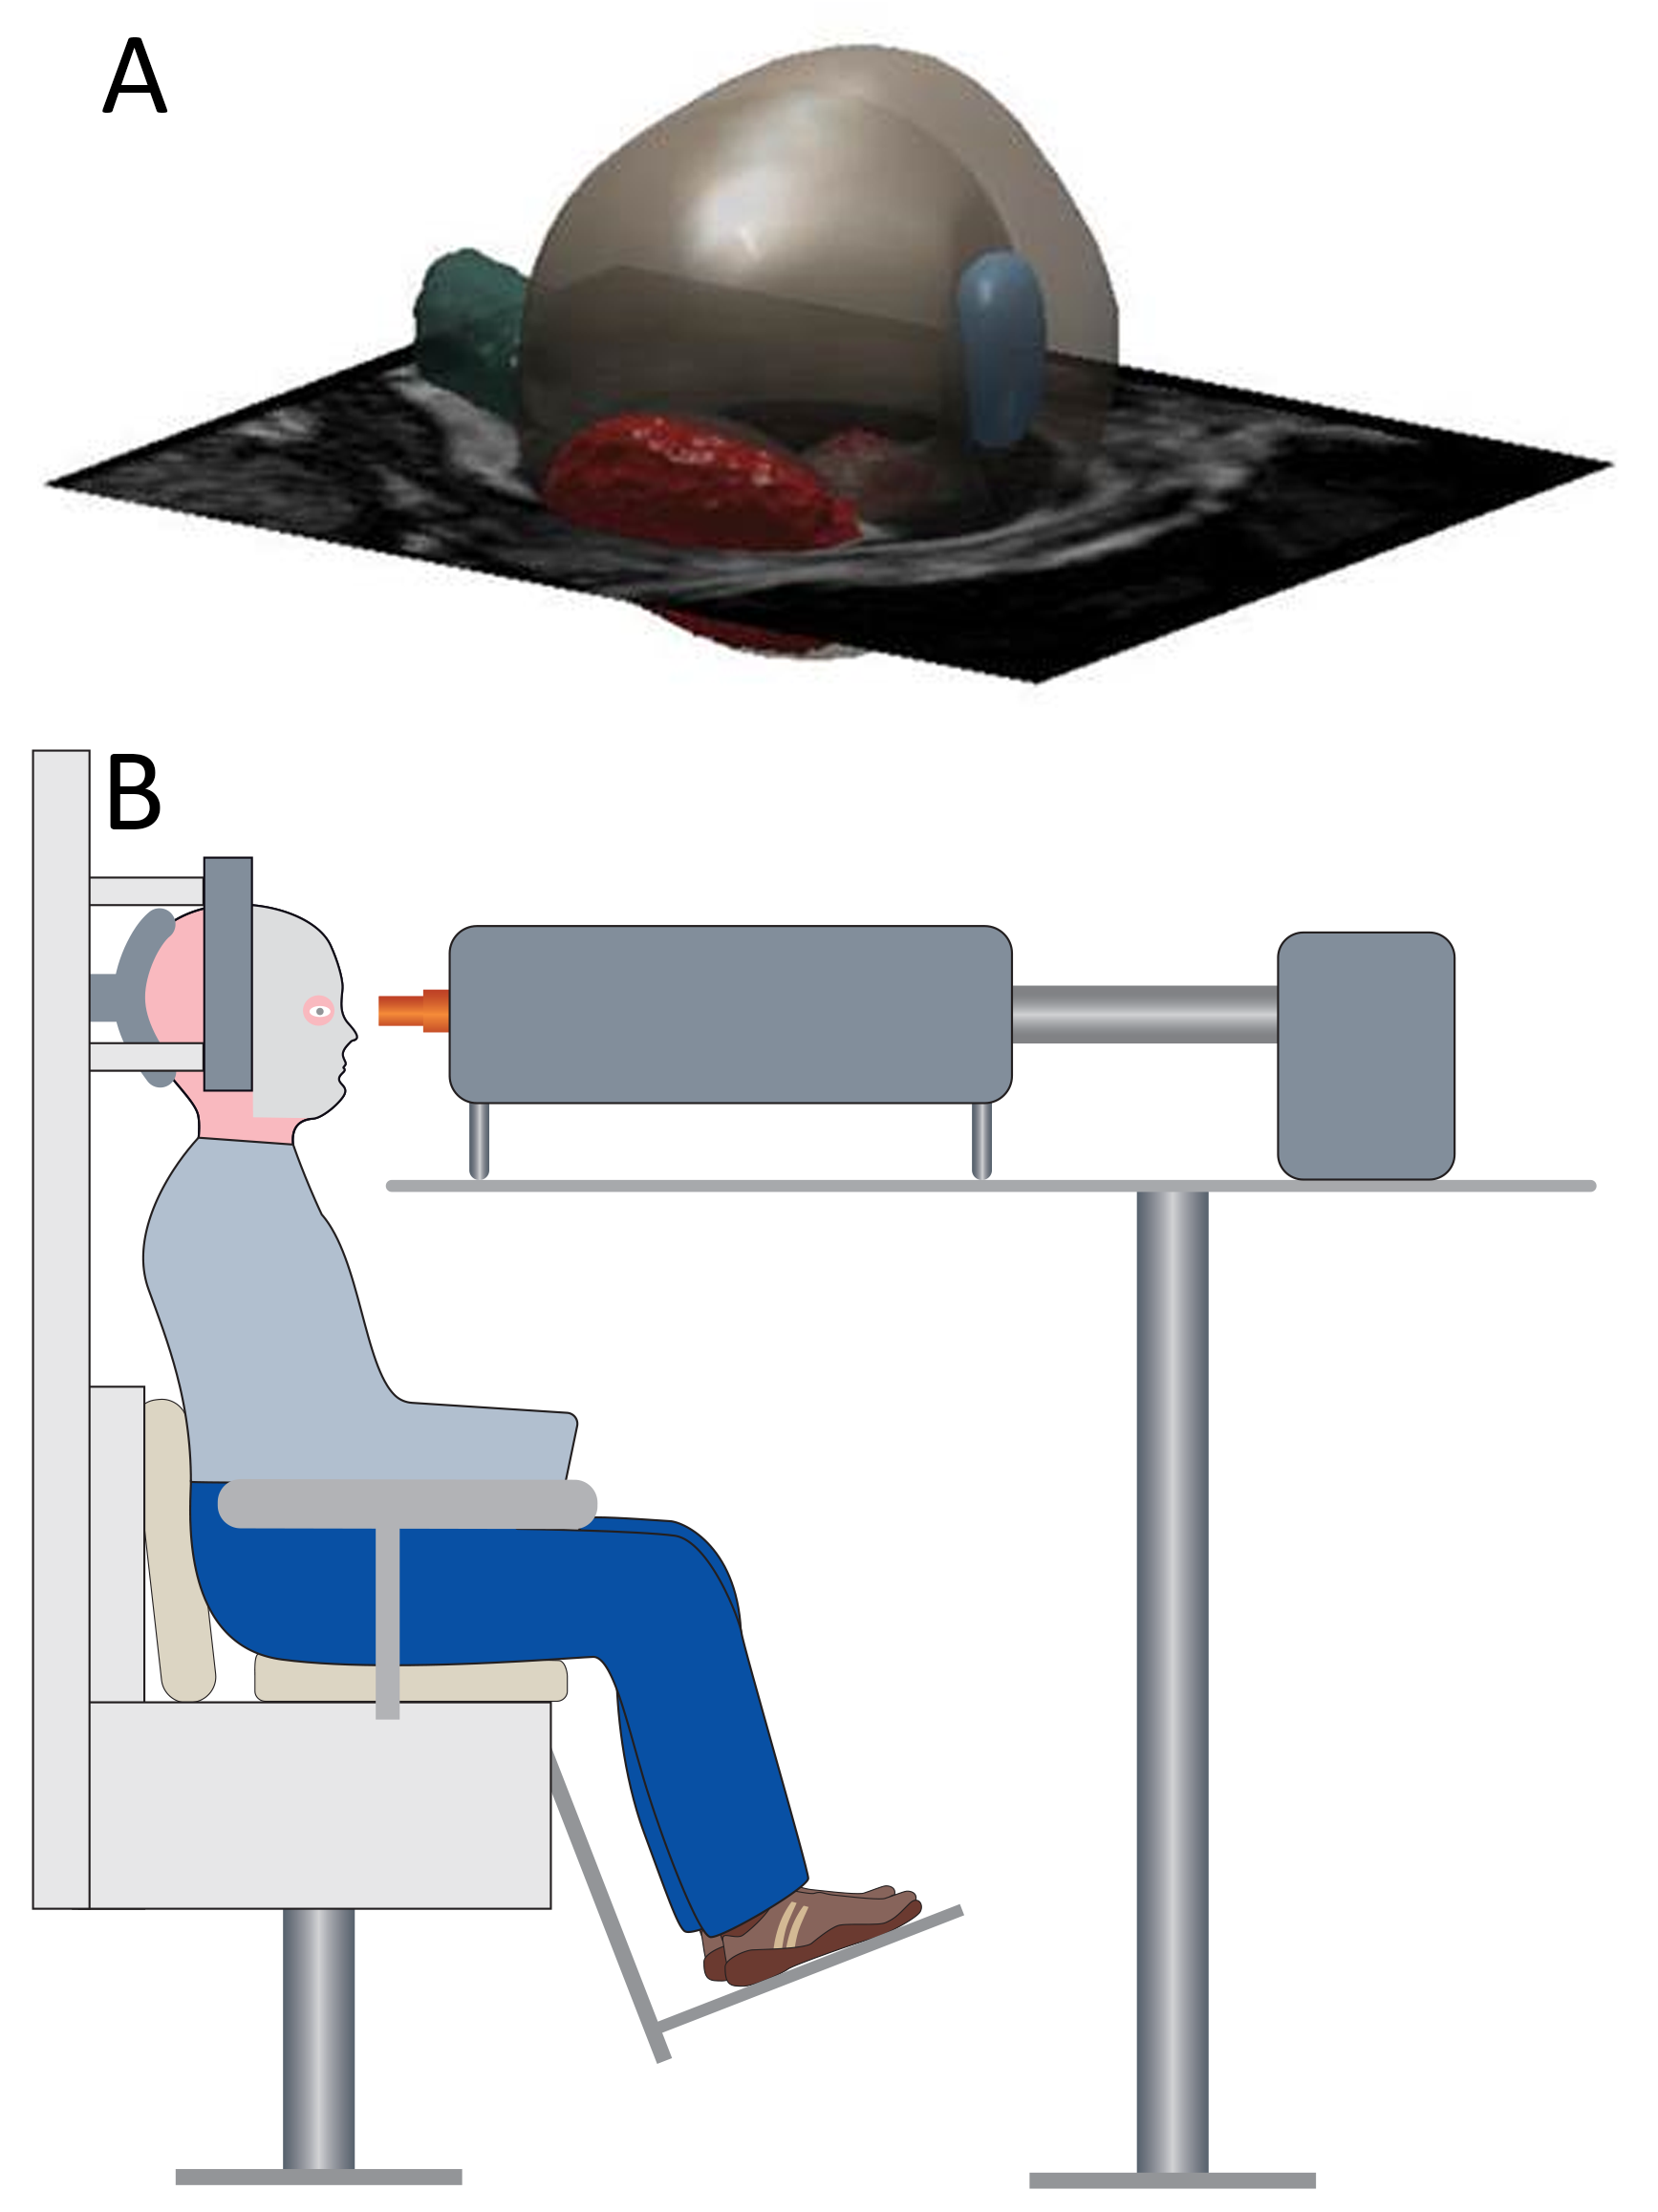
Uveal melanoma (UM) is the most common primary malignant intraocular tumour1,2. Proton beam irradiation (PBT) is often the therapy of choice for large tumours, as well as tumours in close proximity to the optic nerve. Conventionally 2D ultrasound imaging is used to plan the radiotherapy, but recently 3D MRI is proposed for PBT treatment planning3,4,5. However, while PBT is performed with the patient in sitting position, the acquisition of the MR-images is performed in supine position (figure 1). This change in gravity direction potentially changes the shape of the eye and tumour. As even small geometrical deformation can lead to over- or underdose to the tumour and surrounding healthy tissues, we used MRI to investigate and quantify the effect of different patient positions on the shape of the eye and tumour.Methods
Seven volunteers and one UM patient were scanned with closed eyes in two positions on a 3T Philips MRI scanner with a 47mm surface coil after giving informed consent. One set of images was acquired in supine position, while a second set was acquired in flexed position, mimicking the patient sitting upright for PBT (figure 1). Additionally, two volunteers were scanned twice in the supine position to assess the reproducibility. For the healthy subjects, the analyses were performed on 3D T2-weighted images (turbo spin echo, TR/TE: 2500ms/285ms, voxel size: 0.9mm isotropic, echo train length: 130, NSA: 2, time:3 min) as these provide optimal contrast to differentiate the sclera, while for the UM patients a post-contrast T1 (TR/TE:350ms/9.4ms, voxel size: 1.0mm isotropic, scan time: 3 min) was used to differentiate between UM and retinal detachment.
The two scans were registered and subsequently the sclera, or if applicable tumour, were segmented (figure 2) using Elastix 4.9.09 in Mevislab 3.0.2 (MeVis Medical Solutions AG, Bremen, Germany). After registration the sclera, lens and tumour were segmented using Subdivision Surfaces controlled by the maximal gradient magnitude6. This method is independent of signal amplitude which is valuable as the signal amplitude varies per MRI scan. For the UM patient only the tumour-vitreous border could be accurately compared, as the fast retinal wash-out of the contrast agent changed the appearance of the eye-wall between both acquisitions (figure 3).
Results
A masked registration was performed in all scans, to accommodate a potentially rotated eye within moved head, after which the eye-wall or tumour were successfully segmented. Figure 2 (middle) shows the result of the registration and subsequent segmentation for one of the subjects. In healthy controls the median difference between the supine and flexed scans was 0.1mm (95th percentile (P): 0.3mm), which is in the order of the reproducibility of the method (95th P: 0.3mm), figure 4. The slightly larger difference in eye-shapes of subjects 5 was caused by eye-motion artefacts. In the UM patient we found a median UM difference of the tumour of 0.1mm (95th P: 0.4mm) (figure 3 & 4).Discussion
The small differences in eye shapes of the healthy eyes are probably mainly caused by small registration errors due to the high rotational symmetry of the eye. As the tumour breaks this symmetry, a more accurate registration was possible for the UM-patient, explaining the lower median difference in tumour shapes. As there is approximately 10 minutes between the acquisition of the supine and flexed MR-images, the washout of the Gd-contrast agent might result in an artificial change in tumour shape. A T2-weighted sequence would be less sensitive to this effect, but on T2 the tumour is often difficult to discriminate from retinal detachment. For all subjects motion artefacts are another cause of artificial differences, as these blur the anatomical boundaries. Nevertheless, we can conclude that the changes in eye and/or tumour shape between sitting and supine position are less than 0.3mm, which is significantly better than accuracy of the conventional Ultrasonic techniques, which have a reproducibility of 0.6mm7. We are currently expanding the number of UM patients to confirm our findings for other tumour shapes.Conclusion
No significant deformations in eye and tumour shape were detected, indicating that that supinely acquired MR images of the eye can be used to accurately plan proton beam therapy of eye tumours.Acknowledgements
The authors thank Berend Stoel, Niels Dekker and Denis Shamonin (LKEB, LUMC) fort their help with image registration and Emmanuelle Fleury (Erasmus MC) for discussions on MR-based therapy planning of UM. This work is part of the research program Protons4Vision with project number 14654 which is financed by the Netherlands Organization for Scientific Research (NWO).References
1. Singh AD, Turell ME, Topham AK. Uveal melanoma: Trends in incidence, treatment, and survival. Ophthalmology. 2011. doi:10.1016/j.ophtha.2011.01.040
2. Chang AE, Karnell LH, Menck HR. The national cancer data base report on cutaneous and noncutaneous melanoma: A summary of 84,836 cases from the past decade. Cancer. 1998. doi:10.1002/(SICI)1097-0142(19981015)83:8<1664::AID-CNCR23>3.0.CO;2-G
3. Beenakker JWM, Ferreira TA, Soemarwoto KP, et al. Clinical evaluation of ultra-high-field MRI for three-dimensional visualisation of tumour size in uveal melanoma patients, with direct relevance to treatment planning. Magn Reson Mater Physics, Biol Med. 2016. doi:10.1007/s10334-016-0529-4
4. De Graaf P, Göricke S, Rodjan F, et al. Guidelines for imaging retinoblastoma: Imaging principles and MRI standardization. Pediatr Radiol. 2012. doi:10.1007/s00247-011-2201-5
5. Nguyen HG, Sznitman R, Maeder P, et al. Personalized Anatomic Eye Model From T1-Weighted Volume Interpolated Gradient Echo Magnetic Resonance Imaging of Patients With Uveal Melanoma. Int J Radiat Oncol Biol Phys. 2018.
6. Kitslaar PH, van’t Klooster R, Staring M, Lelieveldt BPF, van der Geest RJ. Segmentation of branching vascular structures using adaptive subdivision surface fitting. In: Medical Imaging 2015: Image Processing. Vol 9413. International Society for Optics and Photonics; 2015:94133Z.
7. Char DH, Kroll S, Stone RD, Harrie R, Kerman B. Ultrasonographic measurement of uveal melanoma thickness: interobserver variability. Br J Ophthalmol. 1990;74:183–185. doi: 10.1136/bjo.74.3.183.
Figures