2376
Quality assurance of quantitative MRI for biomarker discovery in locally advanced cervical cancer1Radiation Oncology, the Netherlands Cancer Institute, Amsterdam, Netherlands, 2Clinical Medicine, Aarhus University Hospital, Aarhus, Denmark, 3Radiation Oncology, Leiden University Medical Center, Leiden, Netherlands, 4Institute of Oncology Ljubljana, Ljubljana, Slovenia, 5Radiation Oncology, Tata Memorial Centre, Mumbai, India, 6Radiation Oncology, Amsterdam University Medical Center, Amsterdam, Netherlands, 7Radiatiotherapy, University Medical Center Utrecht, Utrecht, Netherlands, 8Radiotherapy, Medical University of Vienna, Vienna, Austria, 9Medical Physics, Oslo University Hospital, Oslo, Norway, 10Centre Hospitalier de l'Universite de Montreal, Montreal, QC, Canada, 11Medical Physics Unit, McGill University, Montreal, QC, Canada
Synopsis
Large multi-center studies are needed to realize the utilization of quantitative MRI (qMRI) as a biomarker for cervical cancer. In this study we created a framework for a multi-center imaging biomarker study, maximizing the consistency between quantitative results in the presence of a large variety of MRI systems. This way, large deviations in qMRI values can be detected and corrected before enrolment of patients in a study. Furthermore, these results can be used to determine the statistical power of the study.
Introduction
Quantitative MRI (qMRI) is promising for predicting outcome in locally advanced cervical cancer1,2. However, current evidence is built on small patient cohorts. Therefore, a prospective multi-center trial ‘IQ-EMBRACE’ was designed (sub-study of EMBRACE-II protocol3) in which 320 patients will undergo an MRI exam prior to radio(chemo)therapy. Large multi-center studies typically involve a wide variety in MRI systems, with different vendors, field strengths, and generations. To deal with this variety we optimized the trial sequences on each system individually and evaluated them with a quality assurance procedure using calibration phantoms. Benchmark sequences (i.e. reference standards available on all systems) were included to investigate whether deviations between institutes result from protocol differences in the trial sequences or from system variations. The aim of this study was to assess the accuracy and repeatability of qMRI at the participating institutes.Methods
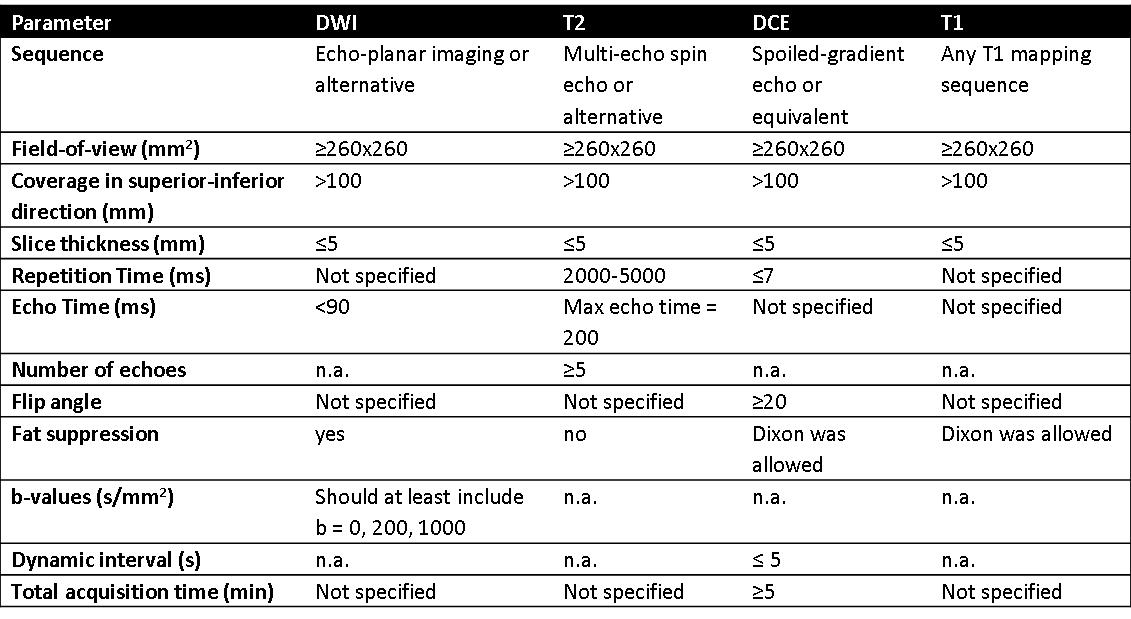
Measurements were performed in ten institutes (four 1.5T systems, six 3T systems from three vendors) prior to the inclusion of the first patient. For the trial sequences requirements were defined (Table 1) and acceleration techniques were allowed. The parameters of the benchmark sequences were specified in detail such that they were similar on all systems. Both benchmark and trial sequences were repeated to assess repeatability.
For diffusion weighted imaging (DWI) we used the Diffusion Phantom Model 128 (High Precision Device, Inc, Boulder, Colorado, USA). As a benchmark sequence we used the sequence specified in the phantom’s manual4. T2 mapping was assessed with the Eurospin II TO5 phantom (Diagnostic Sonar LTD, Livingston, Scotland). As a benchmark sequence we used a single slice non-accelerated multi-echo spin-echo sequence. For pharmacokinetic modelling with dynamic contrast-enhanced (DCE-) MRI data the Quantitative Imaging Biomarker Alliance (QIBA) suggests to assess signal stability and linearity of the DCE sequence and the accuracy of baseline T1 mapping5. For the first two aspects, we created a phantom consisting of ten samples with gadolinium concentrations from 0 to 10 mM. For evaluation of T1 mapping, the Eurospin II TO5 phantom was used. A single-slice, non-accelerated, inversion recovery series was applied as a benchmark sequence.
Bland-Altman statistics was used to calculate the bias and 95% confidence intervals (CI) for the measured qMRI parameters. Short-term repeatability was expressed as the within-subject standard deviation (wCV) for repeated measurements. For signal stability of the DCE sequence we calculated the CV as the standard deviation of signal intensities of all dynamic scans divided by the mean. For signal linearity we converted the measured signal intensities to estimated concentration values6 and compared the values to the true values.
Results
Although variation in sequence choice was allowed, in general the same base sequence was used: an EPI sequence for ADC mapping; multi-echo spin echo for T2 mapping, except in one institute a series of separate T2-weighted images with different TEs was acquired; a variable flip angle approach for T1 mapping; and a spoiled-gradient echo (with or without Dixon) for DCE-MRI.
The bias in ADC measurements of both benchmark and trial sequences were within the limit of ≤ 40*10-6 mm2/s of the QIBA profile4 for all institutes (Fig. 1). The median short-term repeatability of the trial sequence was 0.3% (range 0.0 – 0.7%).
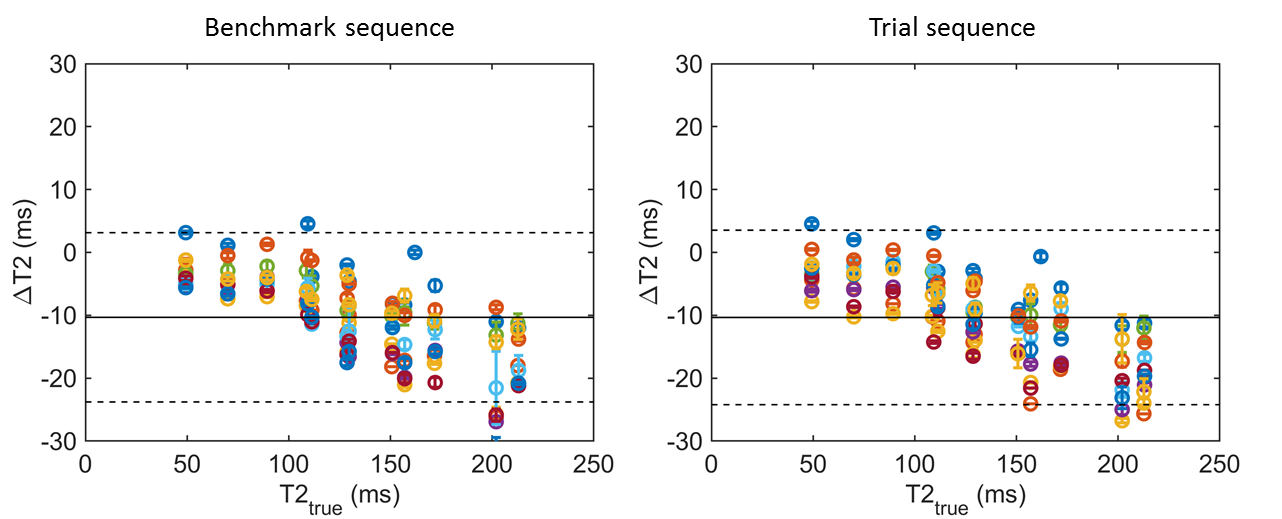
The variation in T2 values between the institutes was the same for the benchmark and trial sequence (Fig. 2), illustrating that the protocol variations between the centers did not affect the T2 values. Median short-term repeatability of the trial sequence was 0.4% (range 0.3 – 1.2%).
The benchmark sequence for T1 mapping gave consistent results across all institutes: mean bias = 9 ms (CI= -74 - 92 ms) (Fig. 3). The differences with the trial sequence were larger: mean bias = 52 ms (CI= -562 - 666 ms). The results at one institute were different from the others, which was corrected after another iteration of new sequence optimization. Median short-term repeatability was 0.6% (range 0.5 – 1.5%).
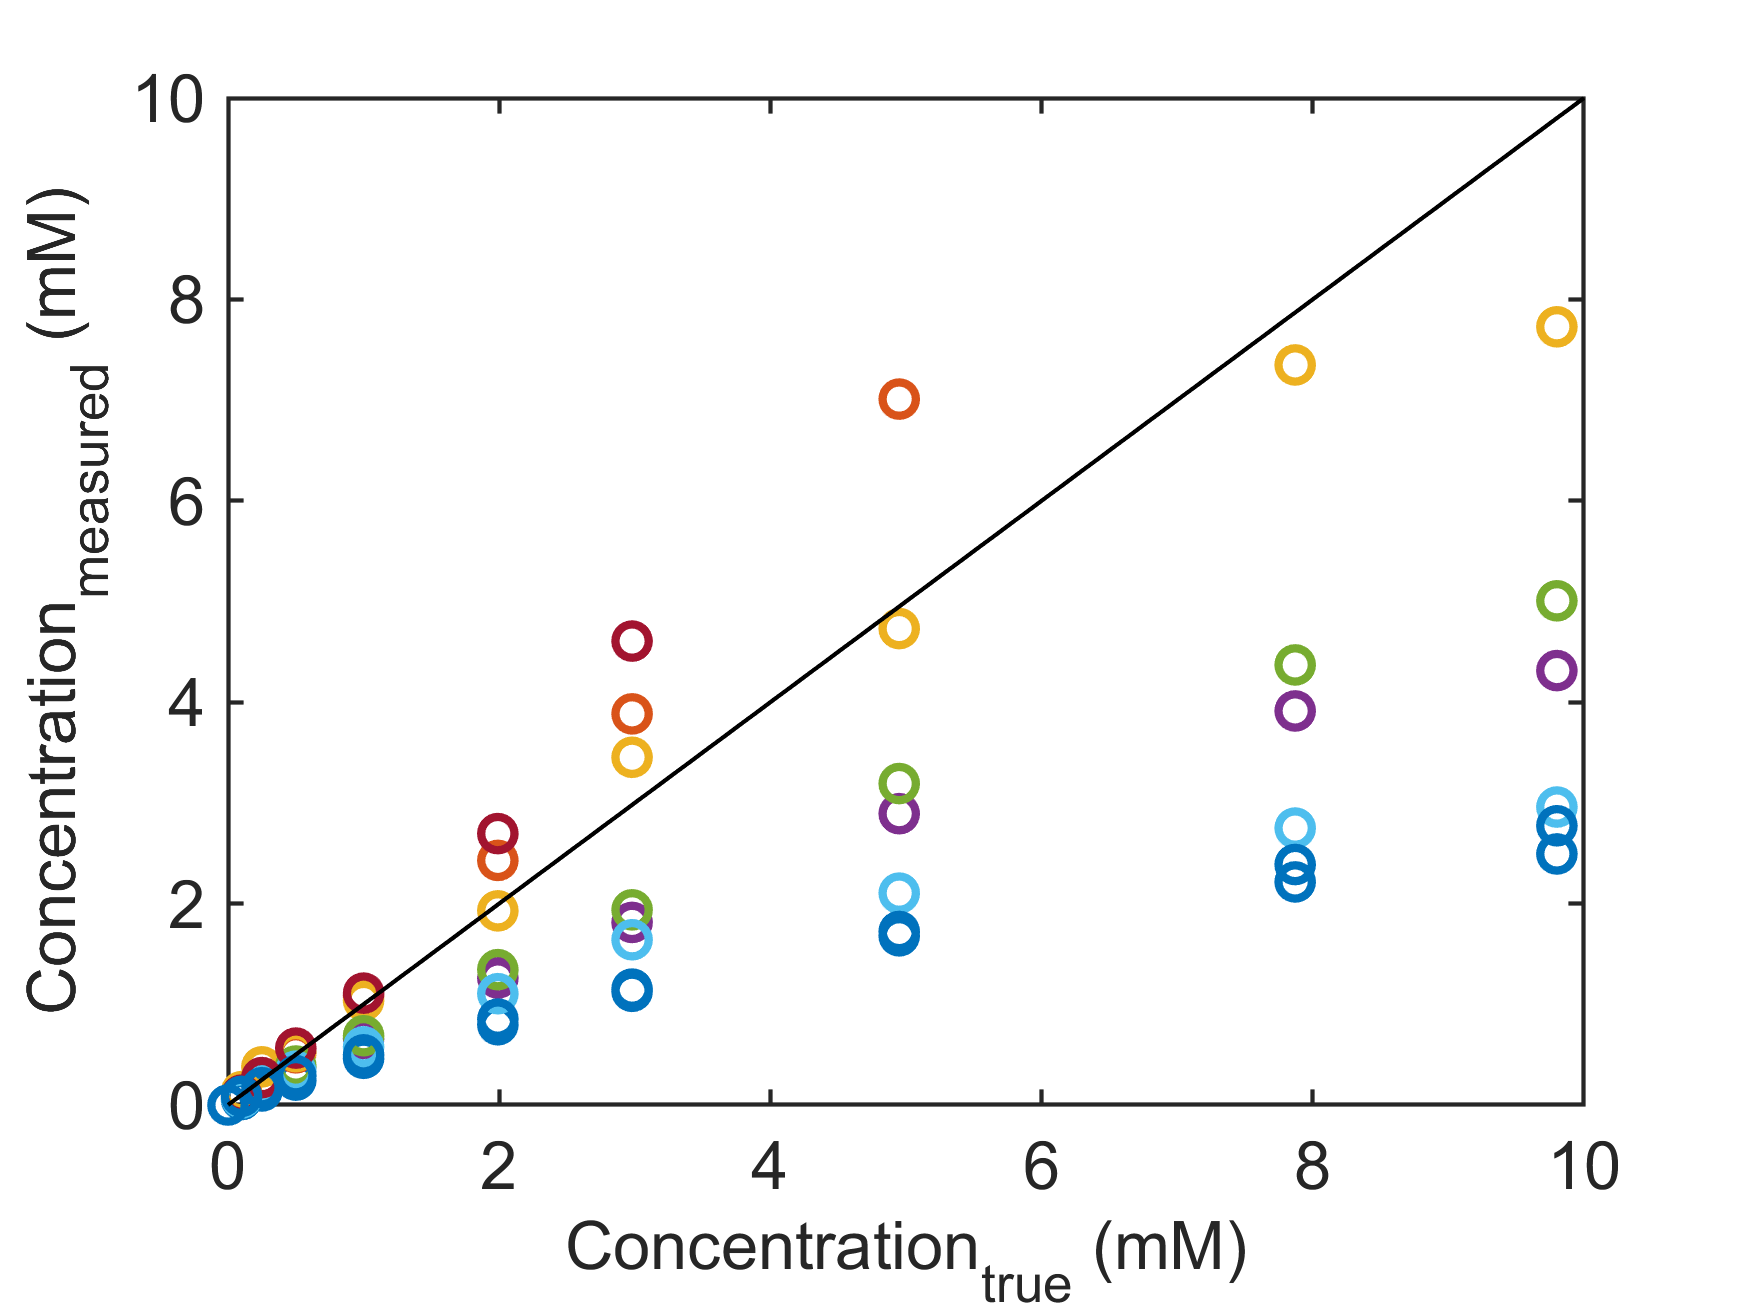
The CV for the signal stability for the DCE sequence was 0.4% (range 0.0 – 3.5%). The measured concentrations were linear up to 0.5 mM in all institutes (Fig. 4).
Discussion and Conclusion
The benchmark sequences showed consistent results between systems. The clinical sequences also showed good consistency, with the exception of T1 mapping which was less accurate and reproducible with the variable flip angle sequence. For DCE large deviations for concentrations above 0.5 mM were observed, which requires further investigation. In conclusion, we have created the framework for a multi-center imaging biomarker study, maximizing the consistency between quantitative results in the presence of a large variety in equipment.Acknowledgements
No acknowledgement found.References
1. Halle C, Andersen E, Lando M et al. Hypoxia-induced gene expression in chemoradioresistant cervical cancer revealed by dynamic contrast enhanced MRI. Cancer Research 2012; 72(20):5285-95 2. Erbay G, Onal C, Karadeli E, et al. Predicting tumor recurrence in patients with cervical carcinoma treated with definitive chemoradiotherapy: value of quantitative histogram analysis on diffusion-weighted MR images. Act Rad. 2017; 58(4):481-488 3. Pötter R, Tanderup K, Kirisits C, et al. The EMBRACE II study: The outcome and prospect of two decades of evolution within the GEC-ESTRO GYN working group and the EMBRACE studies. Clin and Transl Rad Oncol 2018; 9: 48-60 4. QIBA Profile: Diffusion-Weighted Magnetic Resonance Imaging (DWI) 2017 (https://qibawiki.rsna.org/images/7/7d/QIBADWIProfilev1.45_20170427_v5_accepted_linenumbers.pdf) 5. QIBA Profile: DCE-MRI quantification, 2011 (https://qibawiki.rsna.org/images/7/7b/DCEMRIProfile_v1_6-20111213.pdf ) 6. Schabel MC and Parker DL. Uncertainty and bias in contrast concentration measurements using spoiled gradient echo pulse sequences. Phys Med Biol. 2008; 53(9):2345-73Figures