2371
Optimisation of luminal water imaging for classification of prostate cancer1Centre for Medical Imaging, University College London, London, United Kingdom, 2Department of Radiology, University College London Hospital NHS Foundation Trust, London, United Kingdom
Synopsis
Luminal Water Imaging (LWI) using a multi-echo T2 sequence with 64 echoes has been proposed for microstructural assessment of prostate cancer. We have previously demonstrated that LWI could be simplified and performed using 32 echoes. The purpose of this study was to investigate whether further reduction in echo train length is possible. Reducing echo train length reduces SAR and provides the opportunity to improve LWI resolution and/or volume coverage without exceeding maximum SAR requirements for imaging patients.
Introduction
A decrease in glandular volume is a hallmark of increasing Gleason grade in prostate tumours 1. LWI may provide a non-invasive measure of tumour Gleason grade 2,3 and/or potentially help localise suspicious areas within the prostate where diffusion imaging is significantly degraded by artefact.
Sabouri et al (using a multi-echo (ME) T2 sequence with 64 echoes) demonstrated two distributions of T2 relaxation times within the prostate, Tlong corresponding to glandular water and Tshort corresponding to cellular/extracellular water. Devine et al 3 showed that LWI could be performed using 32 echoes by constraining the T2 signal decay fitting with assumptions derived from the work of Sabouri et al 2.
However, a 32 echo ME-T2 sequence remains SAR intensive, limiting image resolution and volume coverage. The purpose of this study is to evaluate whether a further reduction in echo train length is possible in order to overcome imaging limitations imposed by adherence to SAR constraints.
Method
Following informed consent, 19 men (mean age 66 years) were imaged on a 3.0T Phillips Achieva system using a 32-channel cardiac coil. All men underwent a standard multi-parametric MRI examination 4 as part of routine investigation of elevated prostate specific antigen. Additional LWI was conducted at the time of multi-parametric MRI 5 (Table 1). The multi-parametric MRI was reported by a board-certified radiologist, and all patients underwent targeted biopsy of suspicious lesions and the contralateral prostate. Following biopsy, an experienced radiologist contoured regions aware of their positive and negative biopsy status on T2 weighted images. A total of 31 regions of interest (ROI) were contoured across the 19 patients, with a maximum of 1 biopsy positive and 1 biopsy negative lesion per patient.
Luminal Water Fraction (LWF) maps were generated for each patient from the acquired 32 echo dataset as previously described 2,3. In addition, 3 further sets of LWF maps were derived using the first 16, 8 and 6 echoes of the 32 echo dataset respectively.
ROIs were transferred to the LWF maps and ROC analysis performed to evaluate classification accuracy of LWF (for differentiation between cancer and benign ROIs) derived from each map (32, 16, 8 and 6 echo).
To review the LWF derivation process, signal for each of the 32 echoes as function of echo time was plotted from a benign and cancer peripheral zone region for an exemplar patient with unilateral peripheral zone biopsy confirmed tumour (Figure 1). Signal decay was fitted using the LWI model 3 initially using 32, and then repeated using the first 16, 8 and 6 echoes respectively. T2 relaxation time distributions were generated for each fitted dataset and LWF calculated.
Results
For the exemplar patient, goodness of fit was comparable between 32 and 16 echoes, but was visibly reduced for 8 and 6 echo derived fits for both the benign and cancer regions (Figures 2 and 3 respectively). LWF decreased with a reduction in echo number for both benign and cancer regions (Figures 2 and 3 respectively). However, ROC curves for 32, 16, 8 and 6 echo derived LWF measurements in 19 patients were comparable across decreasing number of echoes (Figure 4), with only a marginal decrease in ROC area under curve (ROC-AUC of 0.85, 0.82, 0.81 and 0.80 for 32, 16, 8 and 6 echo derived LWF) evident with decreasing echo number.Discussion
Optimisation of protocols is important for clinical use. A 32 echo acquisition protocol requires a scan time of 5 minutes 49 seconds and provides a 6 slice coverage 5. Despite a reduction in goodness of fit, we found only a marginal reduction in classification performance as the number of echoes used to derive LWF decreased – suggesting that echo train length could be decreased to facilitate clinical use. For example, full coverage of the prostate (88 mm craniocaudal) could be achieved with a <5 minute scan time and 20 slices if 6 echoes were acquired. Alternatively, image resolution could potentially be improved to 1.6x1.6x4mm from 2x2x4mm with a 20 slice coverage and a 6 minute acquisition. Future work is required to prospectively validate clinical performance of reduced echo train length LWI clinical protocols.Conclusion
Optimisation of LWI to provide full coverage of the prostate is feasible by reducing echo train length whilst maintaining SAR and merits prospective evaluation.Acknowledgements
Prof. Shonit Punwani receives research support from the UCLH NIHR Biomedical Research CentreReferences
[1] Shah, R. B., & Zhou, M. (2016). Recent advances in prostate cancer pathology: Gleason grading and beyond. Pathology international, 66(5), 260-272.
[2] Sabouri, S., Chang, S. D., Savdie, R., Zhang, J., Jones, E. C., Goldenberg, S. L., ... & Kozlowski, P. (2017). Luminal water imaging: A new MR imaging T2 mapping technique for prostate cancer diagnosis. Radiology, 284(2), 451-459.
[3] Devine, W., Giganti, F., Johnston, E., Panagiotaki, E., Punwani, S., Alexander, D. C., & Atkinson, D. (2018, June). Two compartment fitting for Luminal Water Imaging: multi-echo T2 in Prostate Cancer. Joint Annual Meeting ISMRM-ESMRMB 2018.
[4] Barentsz, J. O., Weinreb, J. C., Verma, S., Thoeny, H. C., Tempany, C. M., Shtern, F., ... & Cornud, F. (2016). Synopsis of the PI-RADS v2 guidelines for multiparametric prostate magnetic resonance imaging and recommendations for use. European urology, 69(1), 41-49.
[5] Devine, W., Giganti, F., Johnston, E., Panagiotaki, E., Punwani, S., Alexander, D., & Atkinson, D. (2018, June). Multi-echo T2 modelling to predict PIRADS 2.0 score. Joint Annual Meeting ISMRM-ESMRMB 2018.
Figures

Table 1: Acquisition parameters

Figure 1: Patient MR images
Left: Luminal water fraction (LWF) map derived from 32 echo dataset. Middle: Corresponding T2 weighted image acquired as part of multi-parametric MRI. Left: Corresponding Apparent Diffusion Coefficient map derived from multi-parametric MRI diffusion weighted imaging acquisition. Low T2 signal and reduced ADC are evident within the left peripheral zone between 3-5 o’clock in keeping with biopsy positive tumour. Normal T2 signal and ADC is present throughout the right peripheral zone. Red and green squares on the LWF map represent selected regions used for derivation of benign (green) and cancer (red) fits and T2 distributions in figures 2 and 3 respectively.

Figure 2: Benign T2 distribution and curve fitting.
Patient exemplar of change in goodness of fit (right column) with decreasing echo number in the benign region indicated in figure 1 (green square). A good fit is maintained for 16 echoes with reduced goodness of fit demonstrated at 8 and 6 echoes. Corresponding T2 distributions (left column) with calculated Tshort peak area (A1) and Tlong peak area (A2) used to derive luminal water fraction (LWF). LWF decreases with reduced echo number, however remains significantly higher than LWF measurement for cancer pathology for the corresponding number of echoes.

Figure 3: Cancer T2 distribution and curve fitting.
Patient exemplar of change in goodness of fit (right column) with decreasing echo number in the cancer region indicated in figure 1 (red square). A good fit is maintained for 16 echoes with reduced goodness of fit demonstrated at 8 and 6 echoes. Corresponding T2 distributions (left column) with calculated Tshort peak area (A1) and Tlong peak area (A2) used to derive luminal water fraction (LWF). LWF decreases with reduced echo number, however remains significantly lower than LWF measurement for benign pathology at the corresponding number of echoes.
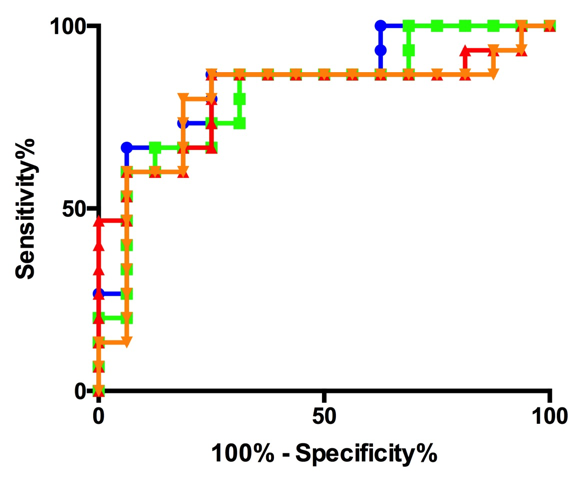
Figure 4: ROC curve for 32 (blue), 16(green), 8(red), 6(orange)
ROC curves derived from luminal water fraction (LWF) regions of interest contoured by radiologist at histologically confirmed benign and cancerous areas within the prostate for 32 (blue), 16 (green), 8 (red) and 6 (orange) echo derived LWF maps. Little difference exists between individual ROC curves. Classification ability of quantitative LWF measurements remains good with a ROC area under curve slightly decreasing from 0.85 to 0.8 from 32 to 6 echoes.