2370
Quantitative Imaging of Pharmacodynamics in a Phase 1 Clinical Study of the Vascular Disrupting Agent Crolibulin (EPC2407)1Department of Cancer Physiology, Moffitt Cancer Center, TAMPA, FL, United States, 2Winship Cancer Institute, Emory University School of Medicine, Atlanta, GA, United States, 3Perlmutter Cancer Center, NYU Langone Health, New York, NY, United States, 4Imaging Endpoints, LLC, Scottsdale, AZ, United States, 5Department of Oncologic Sciences, University of South Florida, Tampa, FL, United States
Synopsis
Diffusion and DCE-MRI were performed at baseline and 2-3 days following Crolibulin (EPC2407) treatment in a phase 1 clinical study of this vascular disrupting agent. ADCw, Ktrans, Ve, and Vp parameter maps were computed and co-registered across scan dates. Over 10 subjects there was an average of 44% decrease in mean tumor Ktrans 2-3 days after initiation of therapy relative to baseline Ktrans values. The decrease in whole-tumor Ktrans was significantly greater in subjects who received 24 mg/m2 drug relative to those who received 13 mg/m2 Crolibulin. Voxel-wise analysis of changes in ADCw, Ktrans, Ve, and Vp will be presented.
Purpose
Anti-cancer therapies targeting tumor vasculature fall into two main categories, antiangiogenic agents designed to prevent the formation of new blood vessels (neovascularization), and Vascular Disrupting Agents (VDAs) that target endothelial cells and pericytes of established tumor vasculature. Clinical development of VDAs has been hampered by non-availability of biomarkers to select likely responders and for identification of an Optimal Biological Dose (OBD) rather than the Maximum Tolerated Dose (MTD) (1, 2). Dynamic Contrast-Enhanced MRI (DCE-MRI) (3), Diffusion MRI (DW-MRI) (4, 5), and MR elastography (6) have shown promise in clinical and pre-clinical biomarker studies of VDAs. Crolibulin (EPC2407) is a 4-aryl-chromene single isomer microtubulin inhibitor with vascular disrupting and apoptotic activity (7, 8). DCE-MRI, carbogen-enhanced BOLD MRI, and photoacoustic imaging have been investigated in pre-clinical tumor models as biomarkers of Crolibulin action (9-11). Here we report results from a phase 1 clinical study of Crolibulin in which DW-MRI and DCE-MRI images were acquired at baseline and 2-3 days post-drug. Our objective is to combine information from DW-MRI and DCE-MRI quantitative parameter maps into a biomarker of Crolibulin pharmacodynamics and tumor response.Methods
Crolibulin was infused over 4 h on a daily x 3, 21 day cycle schedule to extend exposure of tumor vasculature to the drug in an IRB-approved multi-site clinical study. This dosing regimen was studied in 11 subjects with advanced solid tumors: leiomyosarcoma, colorectal, ovary, hepatocellular (2), NSCLC, pancreas, carcinoid, hemangiopericytoma, larynx, and small bowel. Imaging was performed on either 1.5 T or 3 T MRI scanners, and analyzable MRIs were available from 10 subjects who received Crolibulin doses between 13-24 mg/m2. DW-MRI single-shot EPI images were acquired during a held-inhalation breathhold in 6 mm slices with isotropic diffusion weighting and b = 0, 150, 300, 450 s/mm2, and repeated with diffusion weighting applied in the superior/inferior direction. DCE-MRI data were collected on subjects repeating a “breathe-in, breathe-out, hold” pattern, with the imaging occurring during each held-expiration period. Prior to the dynamic portion of the scanning 4 pre-contrast 3D-GRE images were obtained at flip angles of 15°, 23°, 30° and 60° for computing pre-contrast T1 maps. The dynamic series portion of the imaging comprised of 24-30 3D-GRE images collected during repeated “held exhalation” breath-holds with a temporal resolution of 16-18 seconds. Typical parameters for the 3D-GRE imaging were, 12 slices reconstructed to a matrix size of 256 x 256, slice thickness = 5 mm, TR = 5.0 ms, TE = 2.1 ms, and α=30°. After 1-2 pre-contrast images had been acquired, gadolinium contrast was injected at a dose of 0.1 mmole/kg at a rate of 4 mL/s using a power-injector, and chased with a 20 mL saline flush also injected at 4 mL/s.Results
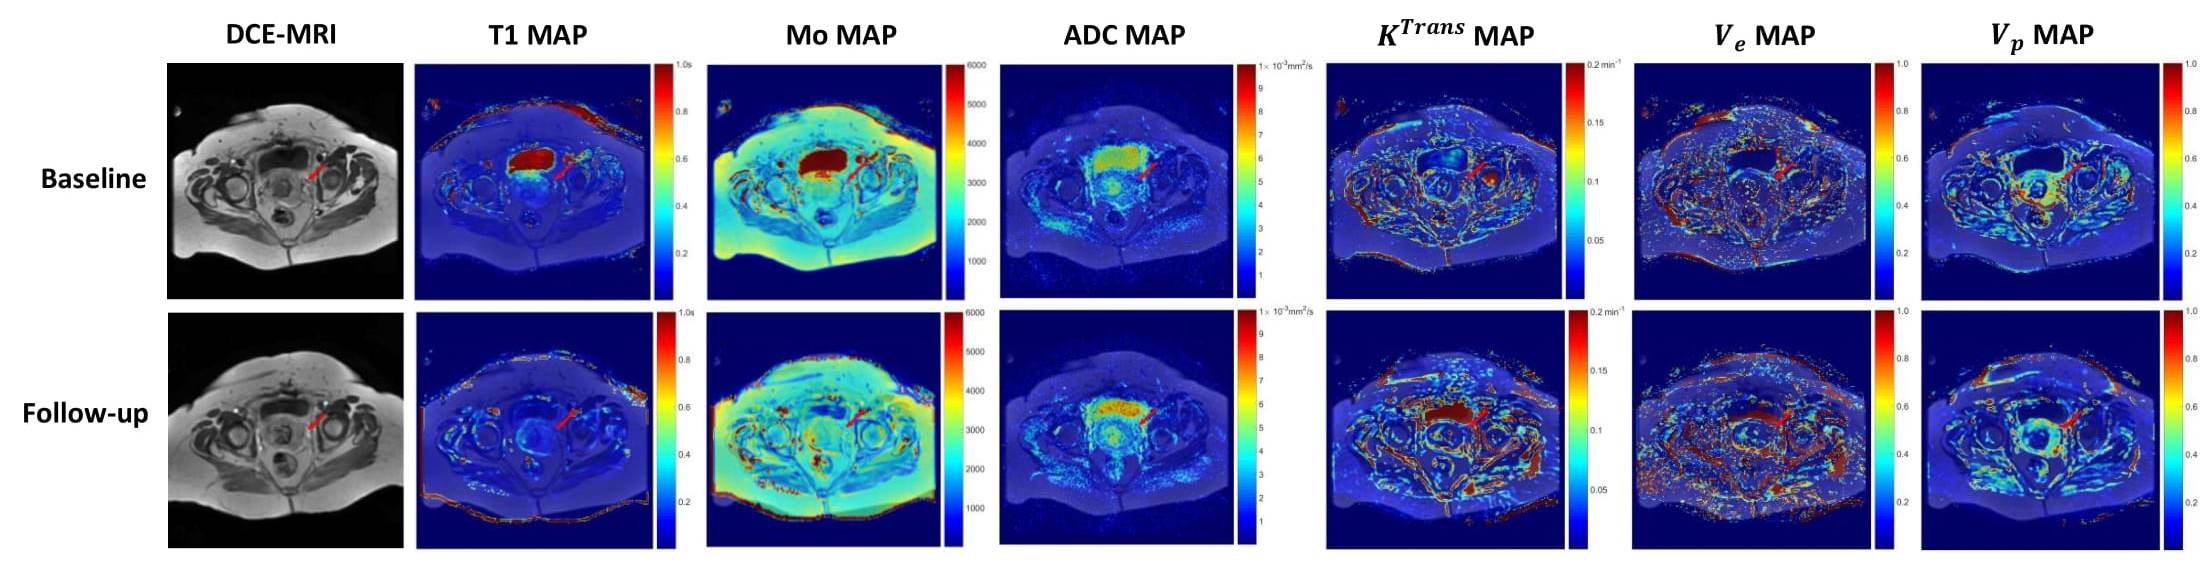
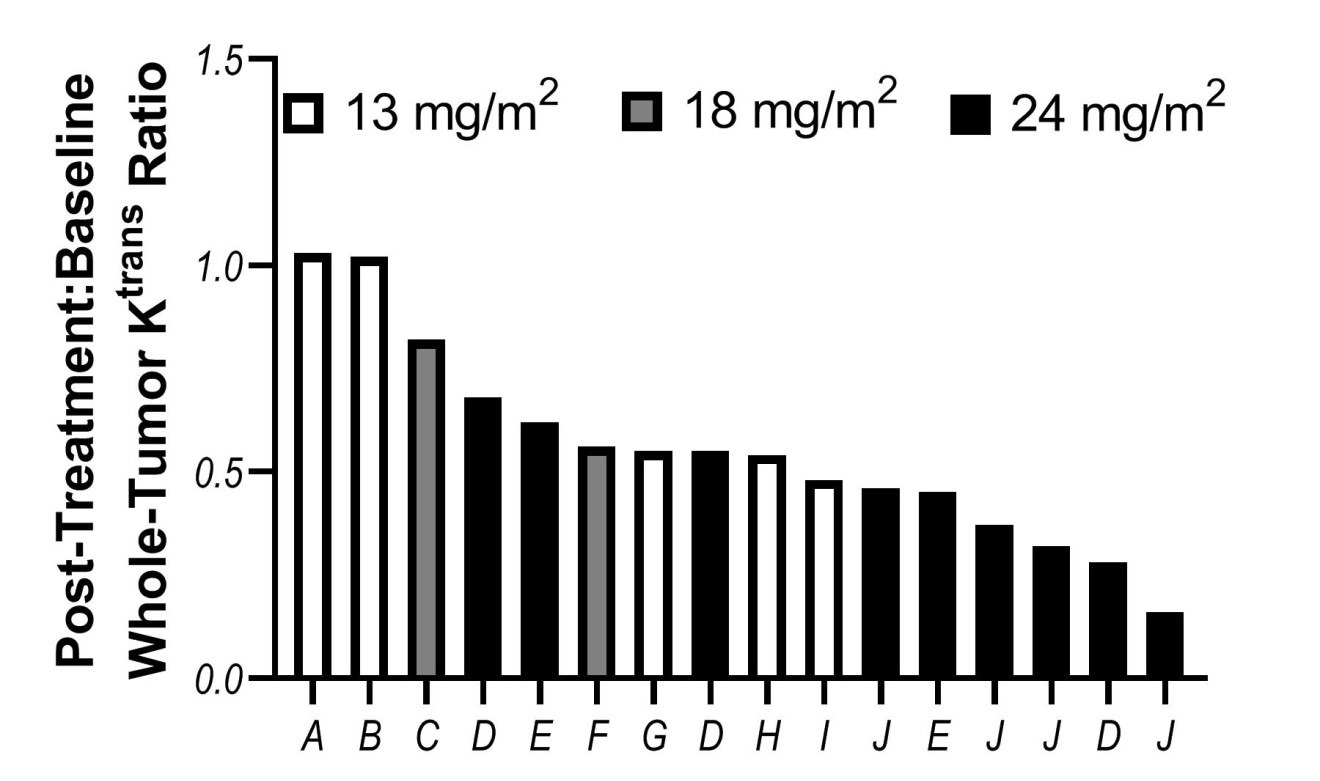
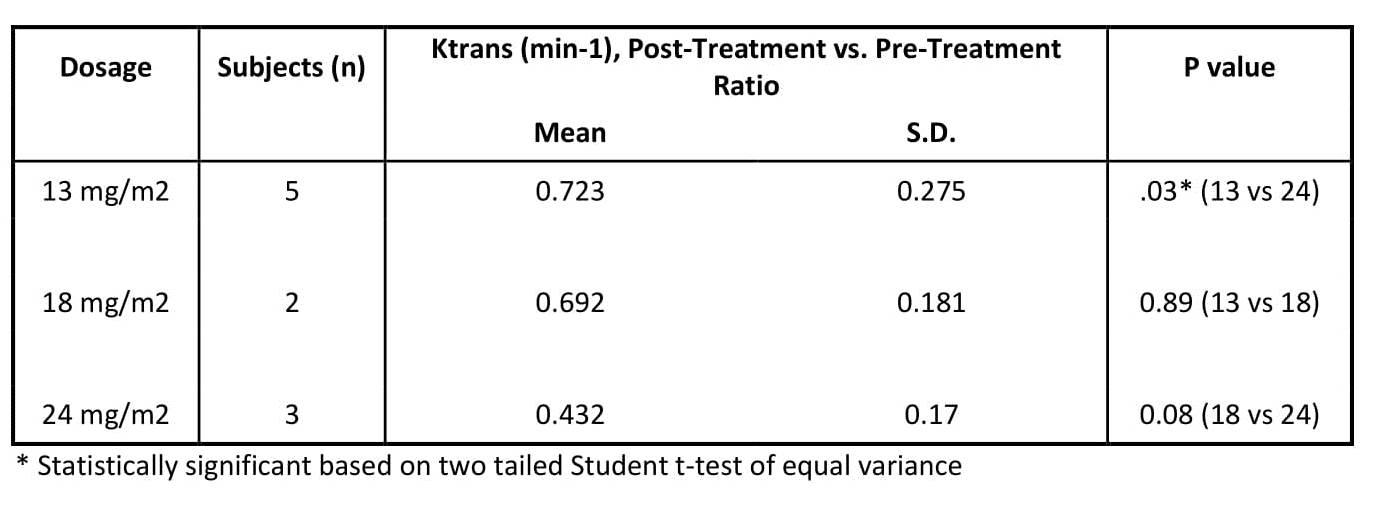
Per visit and between visits, all images were registered using either rigid or non-rigid registration. Pre-contrast T1 maps and proton density maps (Mo) were obtained by fitting pre-contrast T1-weighted images acquired with varying flip angles to a linearized gradient-echo signal equation (12). These maps, together with the DCE-MRI images, were used to calculate voxelwise gadolinium concentrations that were fitted to an Extended Tofts Model (13) to extract model parameters Ktrans (reflective of perfusion or microvascular permeability), Ve (extracellular extravascular volume fraction), and Vp (plasma volume fraction) using the methods presented by Mouridsen et al. (14) and Murase (15). Apparent Diffusion Coefficient of water (ADC) maps were obtained by fitting the diffusion-weighted images to the signal equation (S=So e-b ADC). An example of the quantitative parameters maps before and post-treatment of a patient with a malignant mass in the uterus is shown in Figure 1. On a whole-tumor basis the index lesions had a 44% overall reduction in Ktrans post-treatment relative to pre-treatment (Figure 2). In addition, index lesions in the 24 mg/m2 cohort had significant decline in Ktrans compared to 13 mg/m2 cohort (Figure 3, p=.03). Significant changes were observed in ADCw, Ktrans, Ve, and Vp parameter values between baseline and follow-up images on a voxelwise basis.Conclusions
Whole-tumor analysis of DCE-MRI demonstrates a correlation between change in Ktrans with drug dose, providing a translatable biomarker of drug pharmacodynamics. Additionally, spatial heterogeneity of changes in the tumors were visible on all quantitative parameter maps. Our ongoing efforts are directed at identification of threshold values at baseline on mutually registered DW-MRI and DCE-MRI parameter maps that are jointly predictive of response to Crolibulin at follow-up. Our overall objective is to develop a biomarker to guide stratification of patients at baseline by likelihood of response to Crolibulin treatment.
Acknowledgements
No acknowledgement found.References
1. Hollebecque A, Massard C, Soria JC. Vascular disrupting agents: a delicate balance between efficacy and side effects. Current opinion in oncology. 2012;24(3):305-15.
2. Chase DM, Chaplin DJ, Monk BJ. The development and use of vascular targeted therapy in ovarian cancer. Gynecologic oncology. 2017;145(2):393-406.
3. Galbraith SM, Maxwell RJ, Lodge MA, Tozer GM, Wilson J, Taylor NJ, Stirling JJ, Sena L, Padhani AR, Rustin GJ. Combretastatin A4 phosphate has tumor antivascular activity in rat and man as demonstrated by dynamic magnetic resonance imaging. Journal of clinical oncology : official journal of the American Society of Clinical Oncology. 2003;21(15):2831-42.
4. Koh DM, Blackledge M, Collins DJ, Padhani AR, Wallace T, Wilton B, Taylor NJ, Stirling JJ, Sinha R, Walicke P, Leach MO, Judson I, Nathan P. Reproducibility and changes in the apparent diffusion coefficients of solid tumours treated with combretastatin A4 phosphate and bevacizumab in a two-centre phase I clinical trial. European radiology. 2009;19(11):2728-38.
5. Shi C, Liu D, Xiao Z, Zhang D, Liu G, Liu G, Chen H, Luo L. Monitoring Tumor Response to Antivascular Therapy Using Non-Contrast Intravoxel Incoherent Motion Diffusion-Weighted MRI. Cancer research. 2017;77(13):3491-501.
6. Li J, Jamin Y, Boult JK, Cummings C, Waterton JC, Ulloa J, Sinkus R, Bamber JC, Robinson SP. Tumour biomechanical response to the vascular disrupting agent ZD6126 in vivo assessed by magnetic resonance elastography. Br J Cancer. 2014;110(7):1727-32.
7. Kasibhatla S, Gourdeau H, Meerovitch K, Drewe J, Reddy S, Qiu L, Zhang H, Bergeron F, Bouffard D, Yang Q, Herich J, Lamothe S, Cai SX, Tseng B. Discovery and mechanism of action of a novel series of apoptosis inducers with potential vascular targeting activity. Molecular cancer therapeutics. 2004;3(11):1365-74.
8. Gourdeau H, Leblond L, Hamelin B, Desputeau C, Dong K, Kianicka I, Custeau D, Boudreau C, Geerts L, Cai SX, Drewe J, Labrecque D, Kasibhatla S, Tseng B. Antivascular and antitumor evaluation of 2-amino-4-(3-bromo-4,5-dimethoxy-phenyl)-3-cyano-4H-chromenes, a novel series of anticancer agents. Molecular cancer therapeutics. 2004;3(11):1375-84.
9. Kalmuk J, Folaron M, Buchinger J, Pili R, Seshadri M. Multimodal imaging guided preclinical trials of vascular targeting in prostate cancer. Oncotarget. 2015;6(27):24376-92.
10. Folaron M, Seshadri M. Bioluminescence and MR Imaging of the Safety and Efficacy of Vascular Disruption in Gliomas. Molecular imaging and biology : MIB : the official publication of the Academy of Molecular Imaging. 2016;18(6):860-9.
11. Rich LJ, Seshadri M. Photoacoustic imaging of vascular hemodynamics: validation with blood oxygenation level-dependent MR imaging. Radiology. 2015;275(1):110-8.
12. Chang LC, Koay CG, Basser PJ, Pierpaoli C. Linear least-squares method for unbiased estimation of T1 from SPGR signals. Magnetic resonance in medicine. 2008;60(2):496-501.
13. Tofts PS. Modeling tracer kinetics in dynamic Gd-DTPA MR imaging. Journal of magnetic resonance imaging : JMRI. 1997;7(1):91-101.
14. Mouridsen K, Christensen S, Gyldensted L, Ostergaard L. Automatic selection of arterial input function using cluster analysis. Magnetic resonance in medicine. 2006;55(3):524-31.
15. Murase K. Efficient method for
calculating kinetic parameters using T1‐weighted dynamic contrast‐enhanced
magnetic resonance imaging. Magnetic Resonance in Medicine: An Official Journal
of the International Society for Magnetic Resonance in Medicine.
2004;51(4):858-62.
Figures