2369
T1 relaxivity in the bone marrow to monitor response to therapy in acute myeloid leukemia xenografts1Haematopoietic Stem Cell Laboratory, The Francis Crick Institute, London, United Kingdom, 2In Vivo Imaging, The Francis Crick Institute, London, United Kingdom
Synopsis
Mouse models of cancer are extensively used to better understand the pathobiology of the disease, to test potential novel therapies, and for the development of diagnostic and prognostic imaging tools. Currently, diagnosis of acute myeloid
Introduction
Mouse models of cancer are extensively used to better understand the pathobiology of the disease, to test potential novel therapies, and for the development of diagnostic and prognostic imaging tools 1-3. In fact, mouse models of human acute myeloid leukaemia (AML) have been used to link several factors such as genetic mutations in AML cells or AML/BM stroma interactions to response to therapy 2. Currently, diagnosis of AML is quite invasive and it is based predominantly on blast quantification in the blood and bone marrow (BM) analysis. Imaging is not part of the clinical follow-up of the patients. Previous patient studies have reported that BM T1 relaxivity is increased in the majority of leukaemia patients, but the significance and prognostic value remain unclear 4-7. Additionally, T1 relaxivity of the mouse BM has not been reported previously. In this study, we use human AML xenograft mouse models to determine whether BM T1 relaxivity can be used to non-invasively assess AML progression/response to therapy.Methods
HL60 were grown in RPMI1640, and were tested for mycoplasma prior to commencing experiments. Media were supplemented with 10% FBS and 1x Penicillin-Streptomycin and all reagents were from Gibco-Life Technologies (Paisley, UK). Human AML patient samples (n=4) were obtained after informed consent at St Bartholomew’s Hospital (London, UK).
All animal experiments were performed under the project license (PPL 70/8904) approved by the Home Office of UK and in accordance with The Francis Crick Institute animal ethics committee guidelines. NSG mice were injected with 2.0x10^6 HL60 cells in the tail vein. Two to three weeks after injection, MRI was performed followed by BM aspiration and flow cytometry to monitor the engraftment. T-cell depleted human AML cells (2.0x10^6 cells per mouse) were injected in NSG mice. Engraftment was assessed at 10 weeks from injection. Once hCD45% in the BM was above 50%, mice underwent MRI followed by AraC (cytosine arabinoside) treatment (10 mg/kg/day) for 7 days. MRI and BM puncture were repeated one week after treatment cessation. Mice were classified as responders or not responders if after treatment the hCD45% in the BM was below or above 30% of the starting value respectively. Non-injected NSG mice were used as controls.
MRI was performed on a 9.4T horizontal bore system (Bruker GMBH) equipped with a B-GA12SH gradient coil system. RF transmission and reception was performed with a 40mm ID quadrature birdcage coil (Bruker GMBH). A series of Fast Low Angle Shot (FLASH) scans were used for femur localization and for slice positioning. T1 scans were performed using a saturation recovery protocol with a RARE readout with the following parameters: TR = 40, 108.5, 182, 261.4, 347.6, 442, 546.2, 662.5, 794.2, 945.8, 1124.7, 1342.7, 1621.8, 2010.3, 2654.4 and 5000 ms; TE 6.02 ms; effective TE 12.04 ms; Rare Factor 4; FOV 30x30x0.5mm3; matrix 128x128, and resolution of 234µm.
All mice were placed in a head-first supine position for imaging. Anaesthesia was induced and maintained using isoflurane (1–4%) in room air supplemented with oxygen (80%/20%). Temperature and respiration rate were monitored using SA Instruments system.
Average T1 values were computed by drawing regions of interest over the bone marrow and muscle, and fit those values using Matlab (MathWorks; Natick, MA).
Results
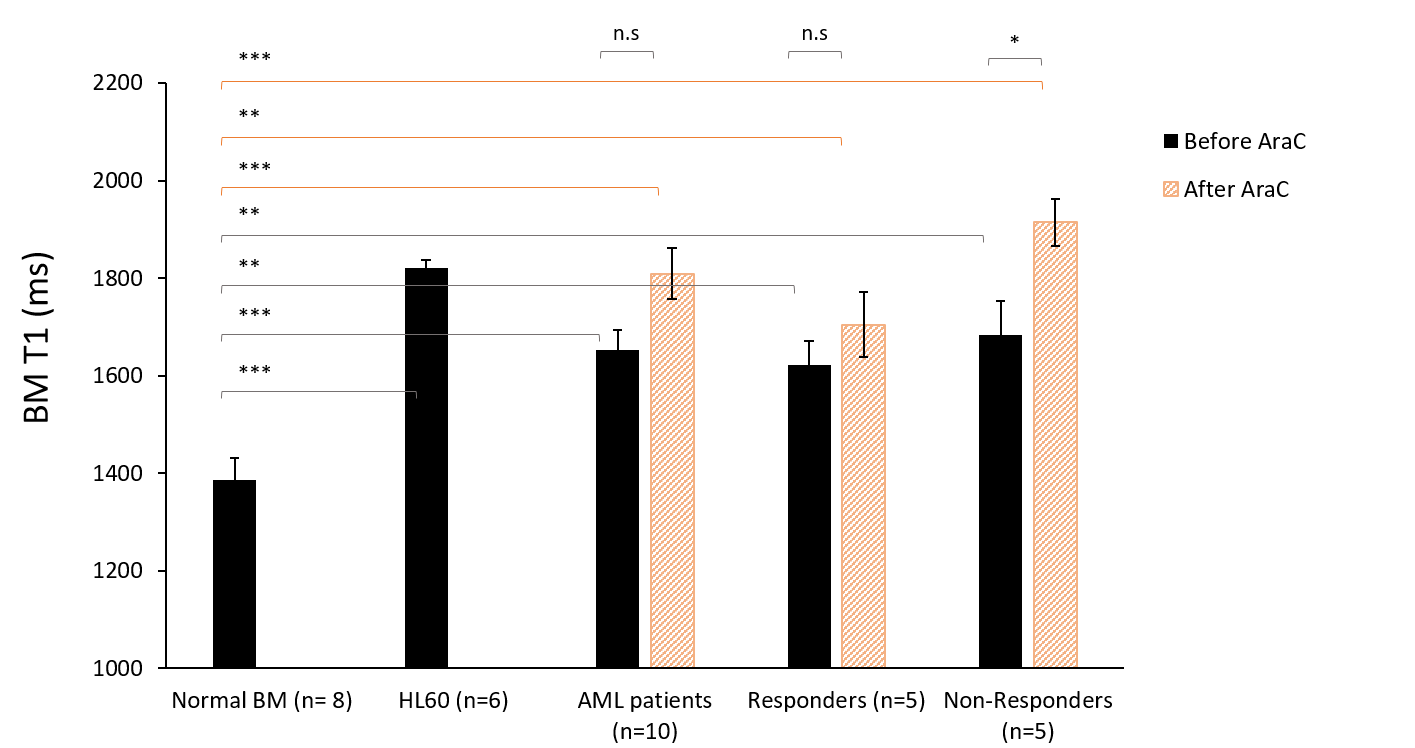
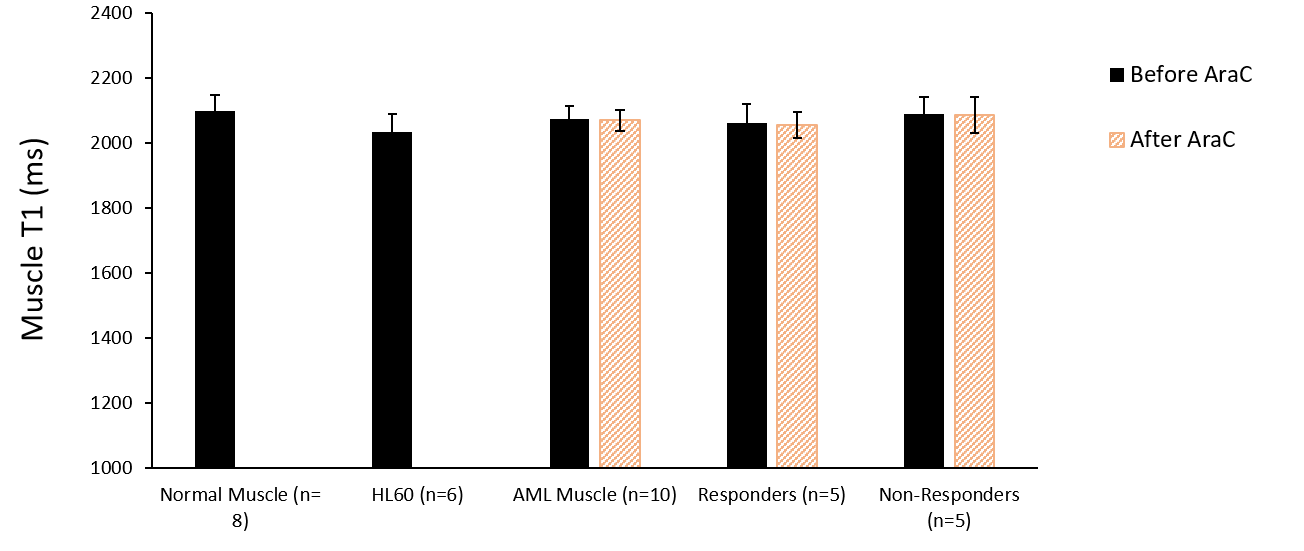
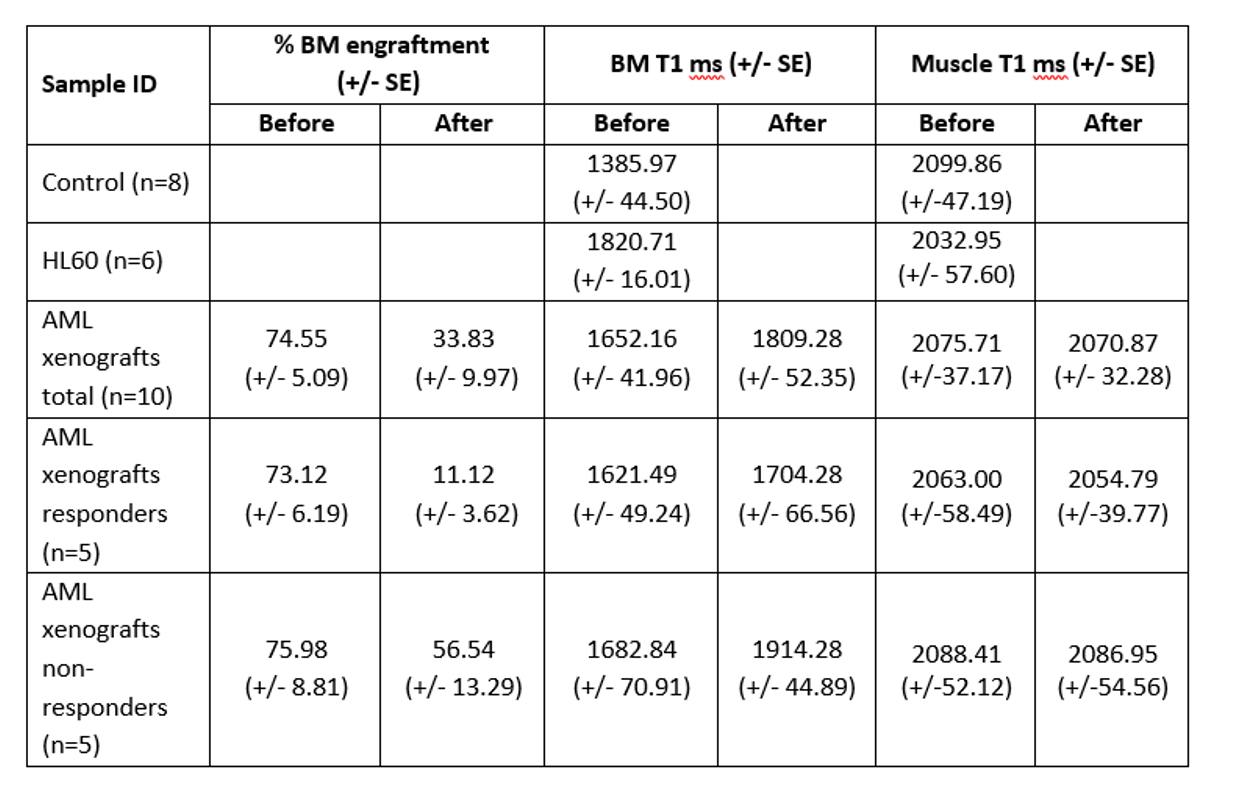
T1 relaxation time was higher in the BM of leukaemia injected mice (Table 1, Figure 1), with higher T1 relaxation for the mice injected with HL60 cell lines. BM of mice injected with AML cells present higher T1 relaxation values than normal BM, and it further increased after chemotherapy treatment. No changes were observed for muscle T1 relaxation (Table 1, Figure 2).Discussion / Conclusion
Our results are in agreement with previously published clinical MR literature. There have been conflicting reports on the prognostic value of T1, with some reports correlating it with response to therapy, whilst others showed no correlation 4-7. In our model, although BM T1 relaxivity did not change in the responders' group, in the non-responders' group it further increased. Although analysis of bigger cohorts of patients would be required, our data suggest a good potential for BM T1 monitoring as a non-invasive marker for AML resistance to therapy.Acknowledgements
The authors would like to thank Veronique Birault and members of the Translation team, Biological Resource Unit, Flow Cytometry and In Vivo Imaging core facilities at the Francis Crick Institute for their valuable help. The authors are grateful to Prof. John Gribben (Barts) for providing human AML samples. A.L.G. was supported by a i2i translational grant scheme from the Francis Crick Institute. D.P. was supported by a non-clinical junior research fellowship from EHA. This work was supported by The Francis Crick Institute, which receives its core funding from Cancer Research UK (FC001045), The UK Medical Research Council (FC001045), and the Welcome Trust (FC001045).References
1. Kohnken R, Porcu P and Mishra A. Overview of the Use of Murine Models in Leukemia and Lymphoma Research. 2017. Front. Oncol. 7:22.
2. Cook GJ, Pardee TS. Animal Models of Leukemia: Any closer to the real thing?. Cancer Metastasis Rev. 2013 June; 32(0): 63–76.
3. Zuber J, Radtke I, Pardee TS, Zhao Z, Rappaport AR, Luo W., McCurrach ME, Yang MM, Dolan ME, Kogan SC, Downing JR, Lowe SW. Mouse models of human AML accurately predict chemotherapy response. 2009. GENES & DEVELOPMENT 23:877–889.
4. Moulopoulos LA and Dimopoulo Mas. Magnetic Resonance Imaging of the Bone Marrow in Hematologic Malignancies. 1997. Blood 90:2127-2147.
5. Yoshikawa T, Tanizawa A, Suzuki K, Tanaka N, Hayashi T, Tsuda M, Ohta G, Kikuchi N, Okamoto H, Sakai T, Taniguchi Y, Ohshima Y. The Usefulness of T1-Weighted Magnetic Resonance Images for Diagnosis of Acute Leukemia Manifesting Musculoskeletal Symptoms prior to Appearance of Peripheral Blood Abnormalities. 2016 Case Rep Pediatr.
6. Thomsen C, Grundtvig P, Karle SH, Christoffersen P, Henriksen O. Prolonged bone marrow T1-relaxation in acute leukaemia. In vivo tissue characterization by magnetic resonance imaging. 1987. Magnetic Resonance Imaging Volume 5, Issue 4.
7. Vande Berg BC, Schmitz PJ, Scheiff JM, Filleu BJ, Michaux JL, Ferrant A, Jamart J, Malghem J, Maldague BE. Acute myeloid leukemia: lack of predictive value of sequential quantitative MR imaging during treatment.1995. Radiology, Vol. 197.
Figures