2368
Detection of pre-metastatic niches in perfused mouse livers by diffusion-weighted imaging at ultra-high field1Champalimaud Research, Champalimaud Centre for the Unknown, Lisbon, Portugal
Synopsis
Cancer cells can induce phenotypic modifications at future sites of dissemination (pre-metastatic niches), which support tumor growth and metastasis. Here we evaluated whether diffusion-weighted imaging (DWI) could detect mouse liver pre-metastatic niches (LPM) ex vivo using ultrahigh magnetic field MRI. Our results show that mean diffusivity (MD) and mean kurtosis (MK) can depict microstructural changes associated with LPM formation, consistent with a more fibrotic and cellular microenvironment revealed by histologic analysis of the same samples. These results represent a solid step toward the development of a non-invasive imaging tool for pre-metastatic niche diagnosis.
INTRODUCTION
Intercellular communication is critical for metastatic progression – a multi-step process involving “premetastatic niche” formation at target organs during early phase spreading. This is mediated by cancer cell-derived exosomes, which can induce phenotypic modifications at future sites of dissemination and prime them for metastasis (1). Mapping premetastatic niches non-invasively could thus provide a crucial diagnostic biomarker for early detection of metastatic spread, and ultimately its prevention. It has recently been shown that pancreatic ductal adenocarcinoma (PDAC)-derived exosomes can induce liver pre-metastatic niches (LPM) in naive mice, characterized by upregulation of fibronectin production by hepatic stellate cells and enhanced macrophage recruitment (2). Given the sensitivity of diffusion-weighted imaging (DWI) metrics to tissue microstructure (3), we hypothesized their suitability for depicting such LPM-associated changes.PURPOSE
To investigate the ability of DWI to detect mouse LPMs ex vivo at ultrahigh-field.METHODS
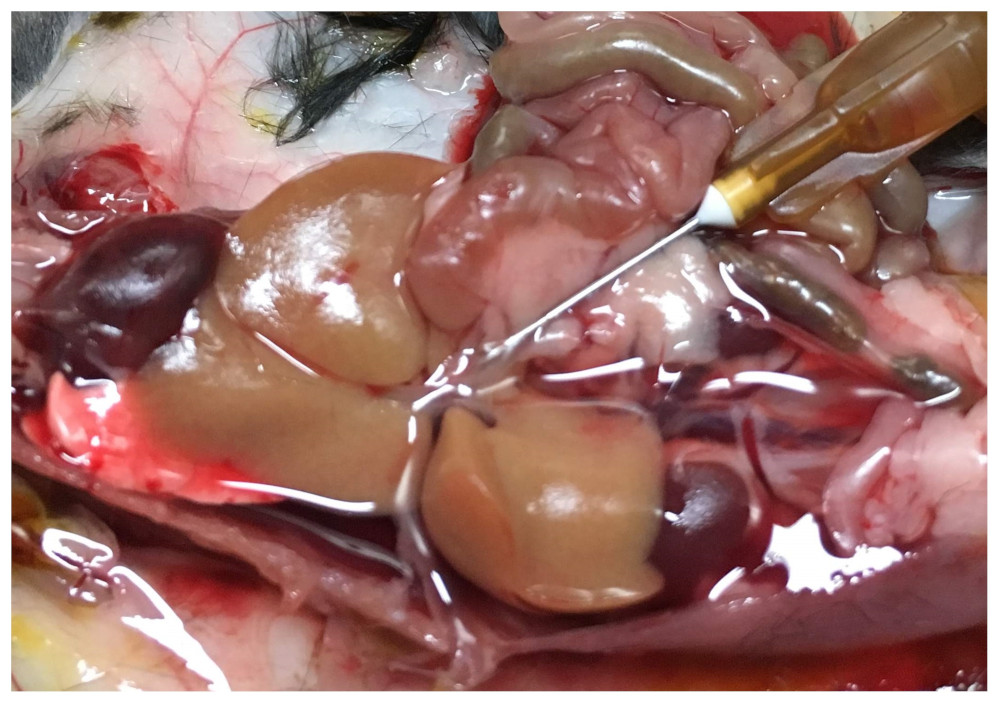
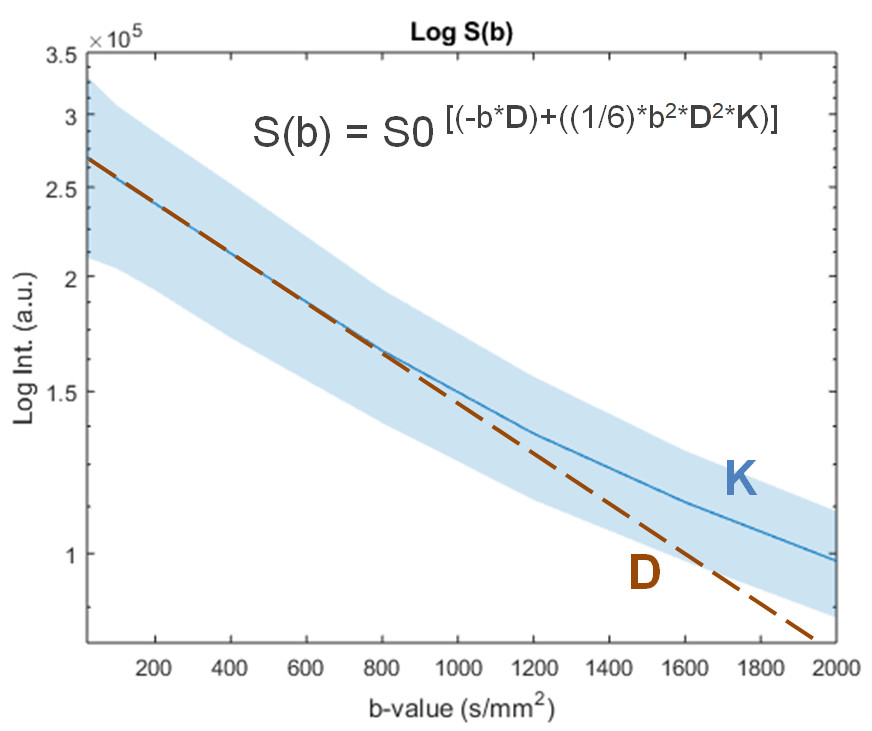
All animal experiments were preapproved by the institutional and national authorities, and carried out according to European Directive 2010/63. Animal model. PDAC-derived exosomes were isolated by ultracentrifugation from pancreatic adenocarcinoma bearing-mice (Pan02 allografts on a C57Bl/6 background) and verified by nanoparticle tracking analysis, and injected in the retro-orbital venous sinus of 5 naive C57Bl/6 mice (LPM group: 5μg of total protein in 100 µL PBS), 3 times a week for 2 weeks, as reported before (2); whereas 5 control C57Bl/6 mice (CTR group) received sham injections (100 µL PBS). Sample preparation and immunofluorescence. After perfusing/fixating each liver in 4% PFA (Fig. 1), one lobule was separated for histology and the rest kept for MRI. For histology, samples were further fixed overnight in 2% PFA + 20% sucrose, OCT-embedded and frozen; tissue cryosections were immunostained for F4/80+, fibronectin, and αSMA, and analyzed by fluorescence microscopy. For MRI, the remaining tissues were kept in PBS for 24h at 4ºC, then loaded on a 15mm NMR tube filled with Fluorinert and sodium azide, and kept at 4ºC for 1 week. MRI. Each sample was scanned on a Bruker 16.4T Aeon Ascend spectrometer equipped with an Avance IIIHD console and a Micro2.5 probe (Gmax 1500 mT/m in all directions). Diffusion was encoded using the remmiRARE pulse sequence (kindly provided by Prof. Mark D Does from Vanderbilt University, USA) using the following acquisition parameters: RARE factor, 12; TE1, 43.9ms; Echo Spacing, 3.3ms; TR, 2s; averages, 2; FOV/matrix, 22.4x15.5mm/104x72 (0.215x0.215mm in plane resolution); 0.8mm slice thickness (10 slices, total); total acquisition time, 67min. For the diffusion weighting, eight b-values were spaced between 20-2000s/mm2, with 20 directions per b-value, Δ/δ= 40/1.8ms, and 8 non-diffusion weighted acquisitions (b0) for normalization. Data analysis. Immunofluorescence data were analyzed for significance between CTR and LPM groups with a two-tailed t-Test (Graph Pad Prism 5.0a, La Jolla/CA, USA). MRI data were analyzed in Matlab R2015a (Natick/MA, USA). Preprocessing included Marchenko-Pastur PCA denoising (4) and Gibbs unringing (5). Data were analyzed by pixel-wise fitting to extract mean diffusivity (MD), mean kurtosis (MK), and fractional anisotropy (FA), based on the literature (6-10). After normality assessment by the Kolmogorov-Smirnov test, CTR and LTR groups were compared for each metric according to the Mann Whitney test.RESULTS
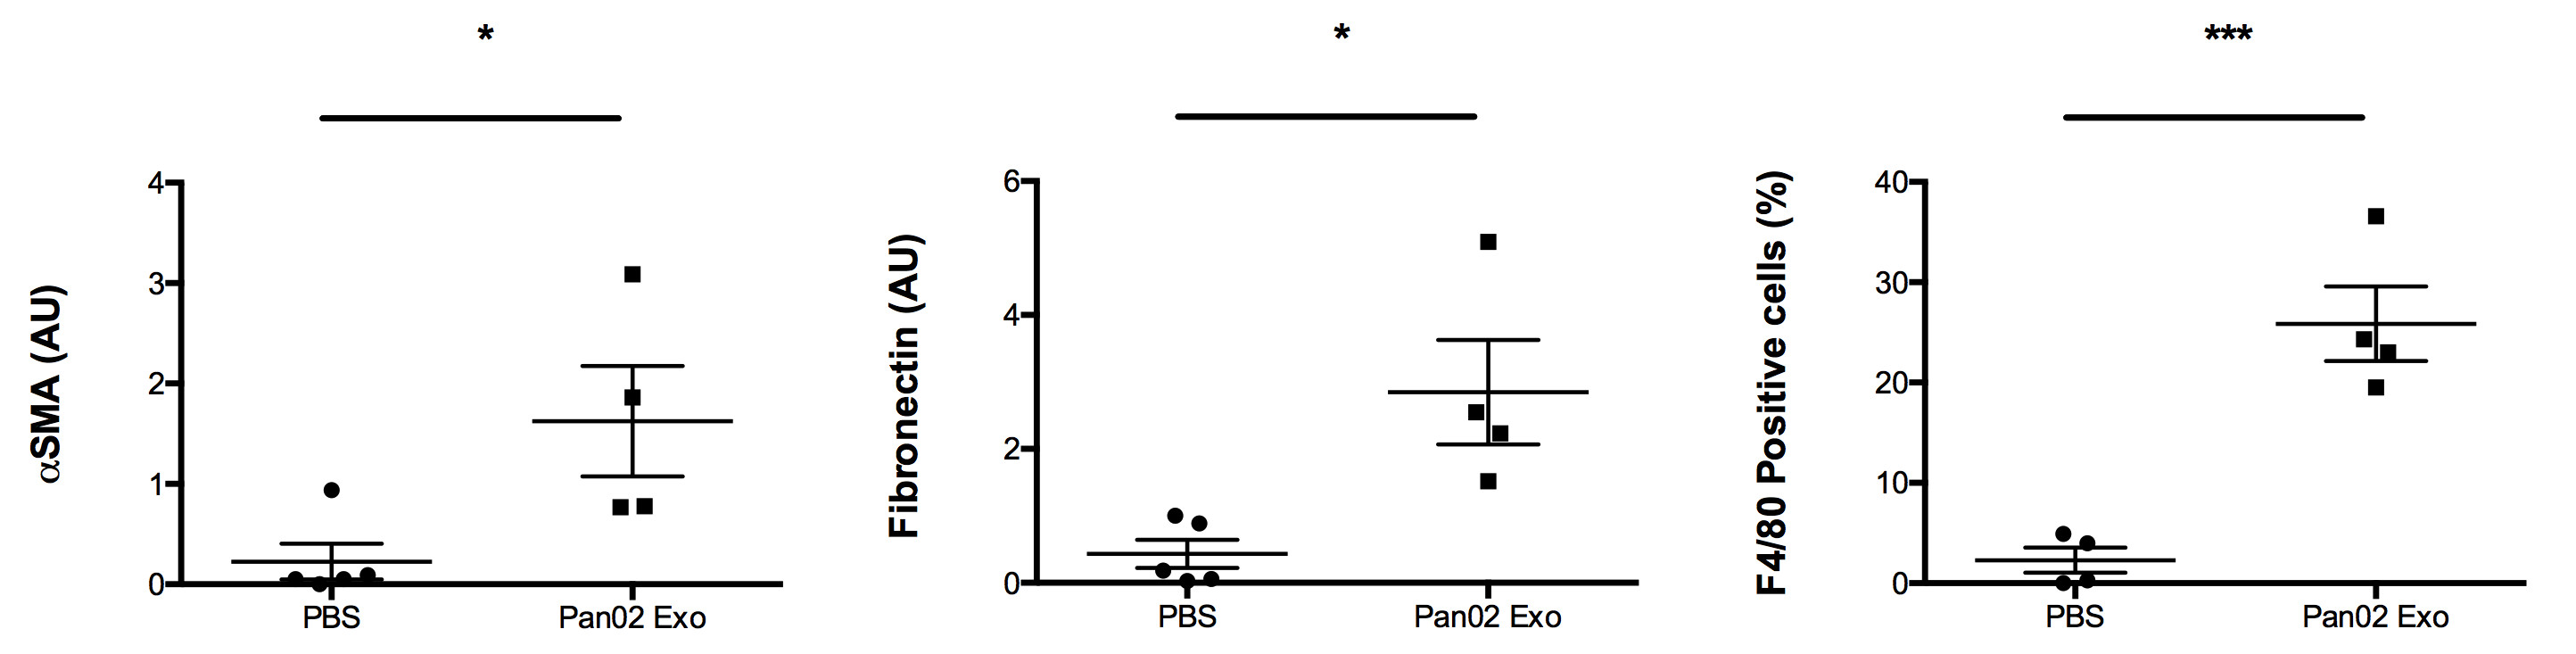
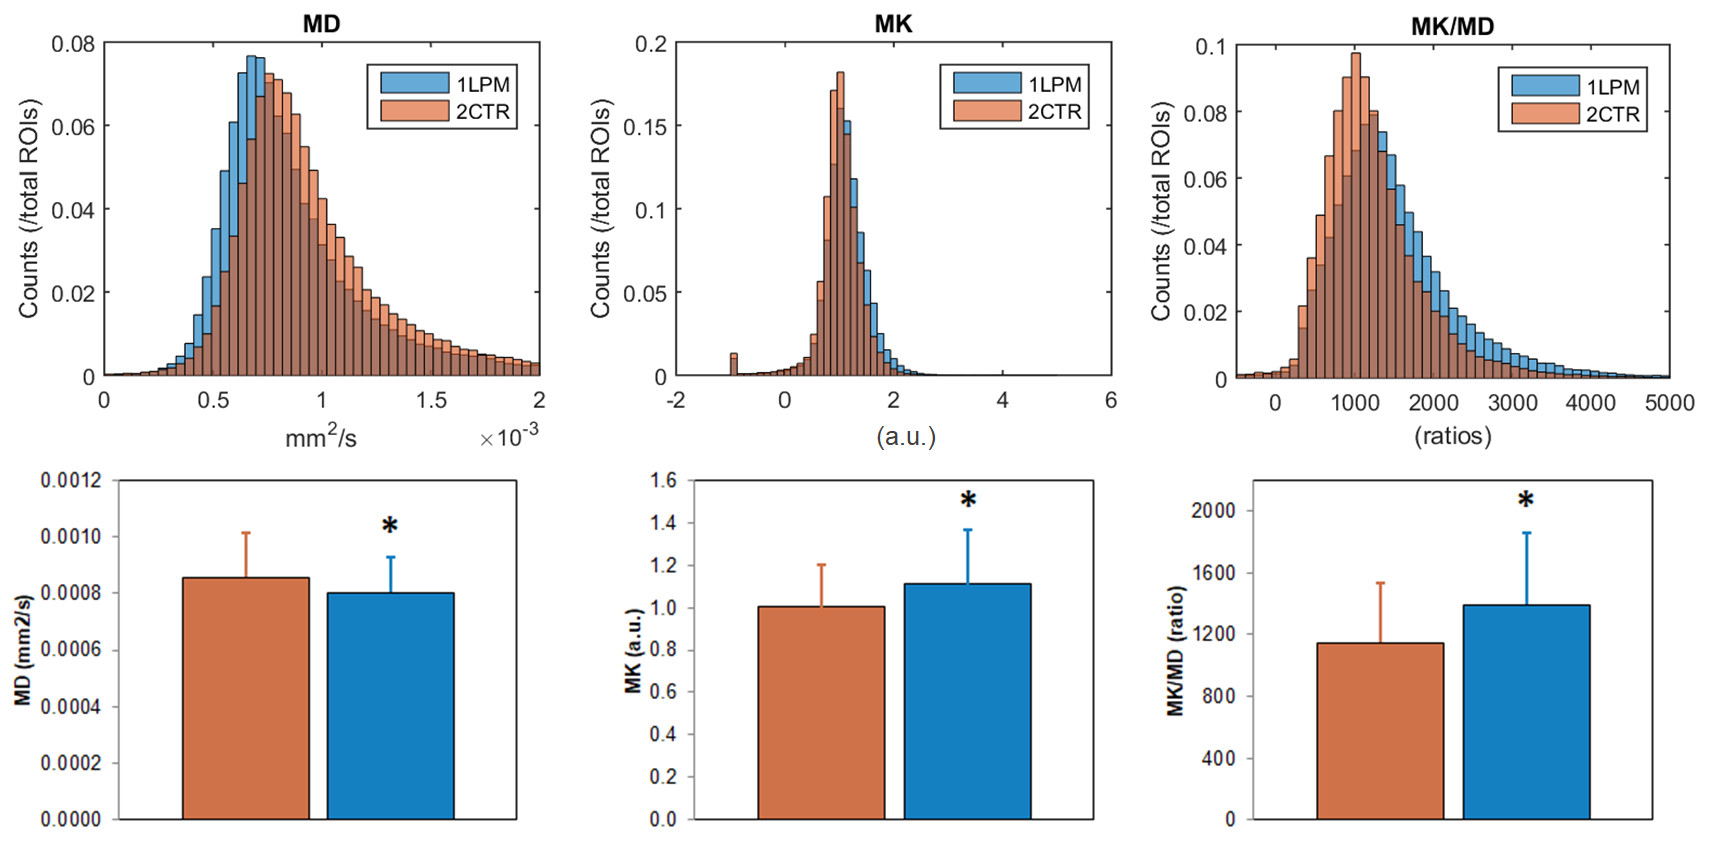
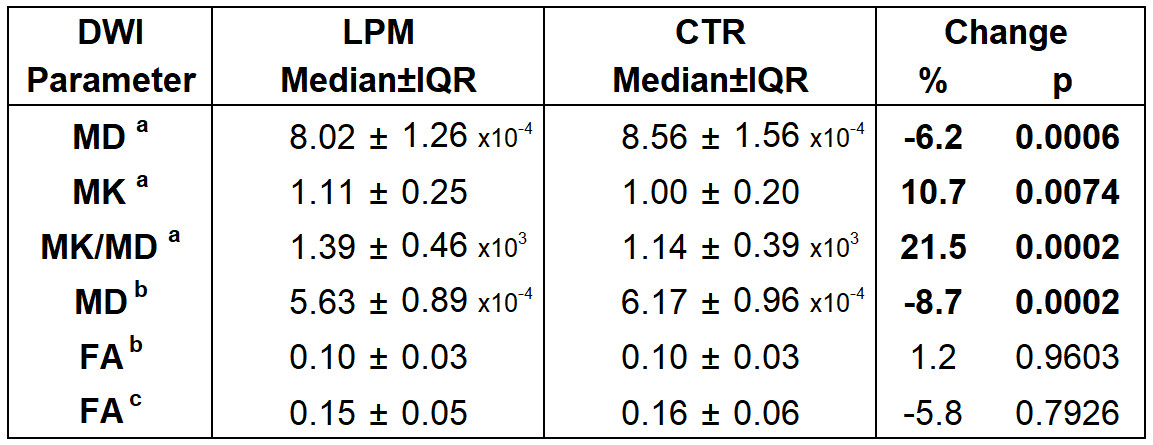
Immunoflurescence studies confirmed a significantly higher accumulation of LPM markers in the respective samples: αSMA, fibronectin, and F4/80+ cells (Fig. 2). DWI analysis (Fig. 3) revealed significantly lower MD (-6%, p=0.0006), higher MK (+11%, p=0.0074), and higher MK/MD (+22%, p=0.0002) in LPM samples (Fig. 4). MD recalculated without correction for kurtosis was also significantly lower in LPM samples (-9%, p=0.0002), but FA did not significantly vary between the two groups (Table 1).DISCUSSION
MK/MD distributions reflect microstructural changes occurring in the LPM group, which are consistent with a more fibrotic and cellular microenvironment revealed by histologic analysis of the same samples. Further studies shall involve enhanced microstructural specificity and independence of orientation dispersion (11), as well as in vivo translation concomitant with metastatic growth.CONCLUSION
Our first-of-its-kind finding represents an important step toward establishing a MRI-based marker for premetastatic niches.Acknowledgements
The authors thank Ms. Joana Maia and Dr. Ana Gregório for their help with the animal model, and Dr. Jelle Veraart for helpful discussions about DWI analysis. Funding Support: Champalimaud Foundation; H2020-MSCA-IF-2016 grant, ref. 751547; EMBO Installation Grant, ref. 3921; NIH, ref. EB019980.References
1. Peinado H, Lavotshkin S, Lyden D. The secreted factors responsible for pre-metastatic niche formation: old sayings and new thoughts. Semin Cancer Biol. 2011; 21: 139-146.
2. Costa-Silva B, Aiello NM, Ocean AJ, Singh S, Zhang HY, Thakur BK, Becker A, Hoshino A, Mark MT, Molina H, Xiang J, Zhang T, Theilen TM, Garcia-Santos G, Williams C, Ararso Y, Huang YJ, Rodrigues G, Shen TL, Labori KJ, Lothe IMB, Kure EH, Hernandez J, Doussot A, Ebbesen SH, Grandgenett PM, Hollingsworth MA, Jain M, Mallya K, Batra SK, Jarnagin WR, Schwartz RE, Matei I, Peinado H, Stanger BZ, Bromberg J, Lyden D. Pancreatic cancer exosomes initiate pre-metastatic niche formation in the liver. Nat Cell Biol. 2015; 17: 816-826.
3. Reynaud O. Time-Dependent Diffusion MRI in Cancer: Tissue Modeling and Applications. Front Phys. 2017; 5.
4. Veraart J, Fieremans E, Novikov DS. Diffusion MRI Noise Mapping Using Random Matrix Theory. Magn Reson Med. 2016; 76: 1582-1593.
5. Kellner E, Dhital B, Kiselev VG, Reisert M. Gibbs-ringing artifact removal based on local subvoxel-shifts. Magn Reson Med. 2016; 76: 1574-1581.
6. Pierpaoli C, Basser PJ. Toward a quantitative assessment of diffusion anisotropy. Magn Reson Med. 1996; 36: 893-906.
7. Basser PJ, Mattiello J, LeBihan D. MR diffusion tensor spectroscopy and imaging. Biophys J. 1994; 66: 259-267.
8. Henriques RN, Correia MM. Interpreting age-related changes based on the mean signal diffusion kurtosis. Proc ISMRM. 2017; Abs 1270.
9. Henriques RN, Correia MM, Nunes RG, Ferreira HA. Exploring the 3D geometry of the diffusion kurtosis tensor-Impact on the development of robust tractography procedures and novel biomarkers. Neuroimage. 2015; 111: 85-99.
10. Jensen JH, Helpern JA, Ramani A, Lu H, Kaczynski K. Diffusional kurtosis imaging: the quantification of non-gaussian water diffusion by means of magnetic resonance imaging. Magn Reson Med. 2005; 53: 1432-1440.
11. Ianus A, Shemesh N, Alexander DC,
Drobnjak I. Double oscillating diffusion encoding and sensitivity to
microscopic anisotropy. Magn Reson Med.
2017; 78: 550-564.
Figures