2367
Diffusion Weighted Imaging at 7T for Differentiation by Grade and Cellularity of Murine Endogenous Pancreatic Ductal Adenocarcinoma1Radiology, Technical University of Munich, Munich, Germany, 2Nuclear Medicine, Technical University of Munich, Munich, Germany, 3Institute of Pathology, Technical University of Munich, Munich, Germany
Synopsis
DWI of mice with endogenous PDAC tumours were acquired in a 7T MRI system without breath gating.
Inclusion of DWI with b-values above 800 s/mm2 in fits substantially improves the qualitative appearance and reduces variance of uniform region fit ADC.
Tumours were grouped (based on histology) by cellularity (amounts of neoplastic cells and stroma, and clustering) and separately by grade. ADC reliably distinguishes tumours of different cellularity (PDAClow 1.58±0.08; PDACmed 1.35±0.07; PDAChigh 1.17 ± 0.11; P<0.0001). Grades G2 and G3 were not distinguishable via ADC (1.43±0.15 vs. 1.43±0.16 10-3 mm2/s), however G4 had significantly lower ADC (1.16±0.10 10-3 mm2/s, P<0.0001).
Introduction
Profiling of tumour composition of pancreatic ductal adenocarcinoma (PDAC) can be crucial for guiding treatment1. We have previously demonstrated2 that high tumour cellularity (amounts of neoplastic cells and stroma, and arrangement into clusters) and regionally low apparent diffusion coefficient (ADC) are important prognostic biomarkers in human PDAC. Also, we established a classification by cellularity in human and endogenous mouse PDAC tumours using diffusion-weighted MRI (DWI) with a 1.5 T clinical system2. The goal of this study was to establish DWI with a 7 T preclinical scanner in the previously-characterized endogenous mouse model of PDAC.
Methods
Tumour model: 36 mice (Ptf1awt/cre;Kraswt/G12D;p53fl/fl) with 79 PDAC tumour regions
MRI System: Small animal 7T magnet (Agilent/GE) MR901 with Bruker AVANCE III HD electronics and a 31 mm inner diameter volume coil (RAPID Biomedical)
MR Imaging: Tumours were identified with T2w RARE anatomical imaging. DWI used a single-shot EPI-readout with 12 b-values (12-1528 s/mm2), effective TE 34 ms, TR 5000 ms, 10 repetitions, no averaging, 9 slices, 1 mm slice thickness, receive bandwidth 100 kHz, 28x18 mm2 FOV, voxel size 0.25x0.25x1 mm3, partial-Fourier factor 1.6, and total scan time 10 min. Imaging was conducted without breath gating.
ADC Fitting: Magnitude images were fit in MatLab with a least-squares model at each voxel for the apparent diffusion coefficient (ADC). To compensate for motion artifacts, which are inconsistent with normally distributed noise, fitting was iterative: First, all repetitions of all b-values were fit. A second fit excluded any repetition further than a threshold (the median of all voxel values in the diffusion-weighted images, including all repetitions and b-values) from the initial fit at that b-value. A third fit repeated this using the result of the second fit to determine excluded points.
Histology: Tumours were fixed in formalin and stained with hematoxylin and eosin (H&E), and slices corregistered to ADC maps. Tumour regions were classified by cellularity2 (PDAClow, PDACmed, PDAChigh) and grading (G1-G4).
Data Processing: Tumour ADCs were averaged within tumour regions of interest (ROIs) drawn on 3 adjacent slices, and the mean of the slice-means was taken as the average ADC for each tumour. Group mean ADCs were compared pairwise, correcting for multiple comparisons. The importance of high b-values to generating usable ADC maps was assessed by fitting 8 mouse images with and without the four highest acquired b-values (822 to 1528 s/mm2). The standard deviations of voxel ADCs within muscle ROIs (taken as a region with relatively uniform diffusion characteristics) were compared with a ratio paired T-test. GraphPad Prism was used for statistical testing.
Results
An example anatomical and DWI of an endogenous PDAC tumour in a mouse is shown Fig. 1.
The impact of including high b-values on ADC map image quality is illustrated in Fig. 2. The ADC map without high b-values is qualitatively much noisier. Within ROIs drawn on muscle in 8 images with with and without b-values above 800 s/mm2, the standard deviations of the ADC values were significantly higher when fit without high b-values: geometric mean of ratios (without- over with-high-b-values) 2.20 (P<0.0001).
Example PDAC tumour H&E histology images are shown in Fig. 3, illustrating tumour cellularity groups.
Tumour cellularity groups had statistically significantly different ADC: PDAClow 1.58±0.08; PDACmed 1.35±0.07; and PDAChigh 1.17 ± 0.11; (P<0.0001). G1 tumours were not found in the analyzed cohort. G2 and G3 tumours had very similar ADCs: 1.43±0.15 vs. 1.43±0.16 10-3 mm2/s. Both had statistically significantly different ADC from G4 tumours: 1.16±0.10 10-3 mm2/s (P<0.0001). These results are illustrated in Fig. 4.
Discussion
Endogenously grown PDAC tumours in mice were reliably measured with the established free-breathing DWI sequence at 7T.
Inclusion of DWI with b-values above 800 s/mm2 substantially improved the qualitative appearance (Fig. 2) and reduced variance in uniform region fit ADCs. This observation may warrant further investigation in clinical scanners.
Separation between groups by cellularity and tumour grade was similar to that achieved at 1.5 T. However, at 7T, resolution was substantially improved, without problematic increase in artifacts or distortion of images, allowing more robust detection and characterization of smaller tumours and better delineation of tumour heterogeneity.
Conclusion
We have established DWI in a 7T preclinical MRI for free-breathing abdominal imaging of mice with endogenous PDAC tumours. Inclusion of high b-values (>800 s/mm2) is necessary for reliable fitting of ADC maps.
ADC at 7T reliably distinguishes endogenous PDAC tumours of different cellularity, and will be used for future preclinical image-guided therapy trials.
Acknowledgements
We acknowledge support from the Deutsche Forschungsgemeinschaft (DFG, German Research Foundation – 391523415, SFB 824).References
1. Trajkovic-Arsic M., Heid I, Steiger K, et al. Apparent Diffusion Coefficient (ADC) predicts therapy response in pancreatic ductal adenocarcinoma. Sci. Rep. 2017; 7(1): 17038
2. Heid I, Steiger K, Trajkovic-Arsic M, et al. Co-clinical Assessment of Tumor Cellularity in Pancreatic Cancer. Clin Cancer Res. 2017; 23(6):1461-1470
Figures
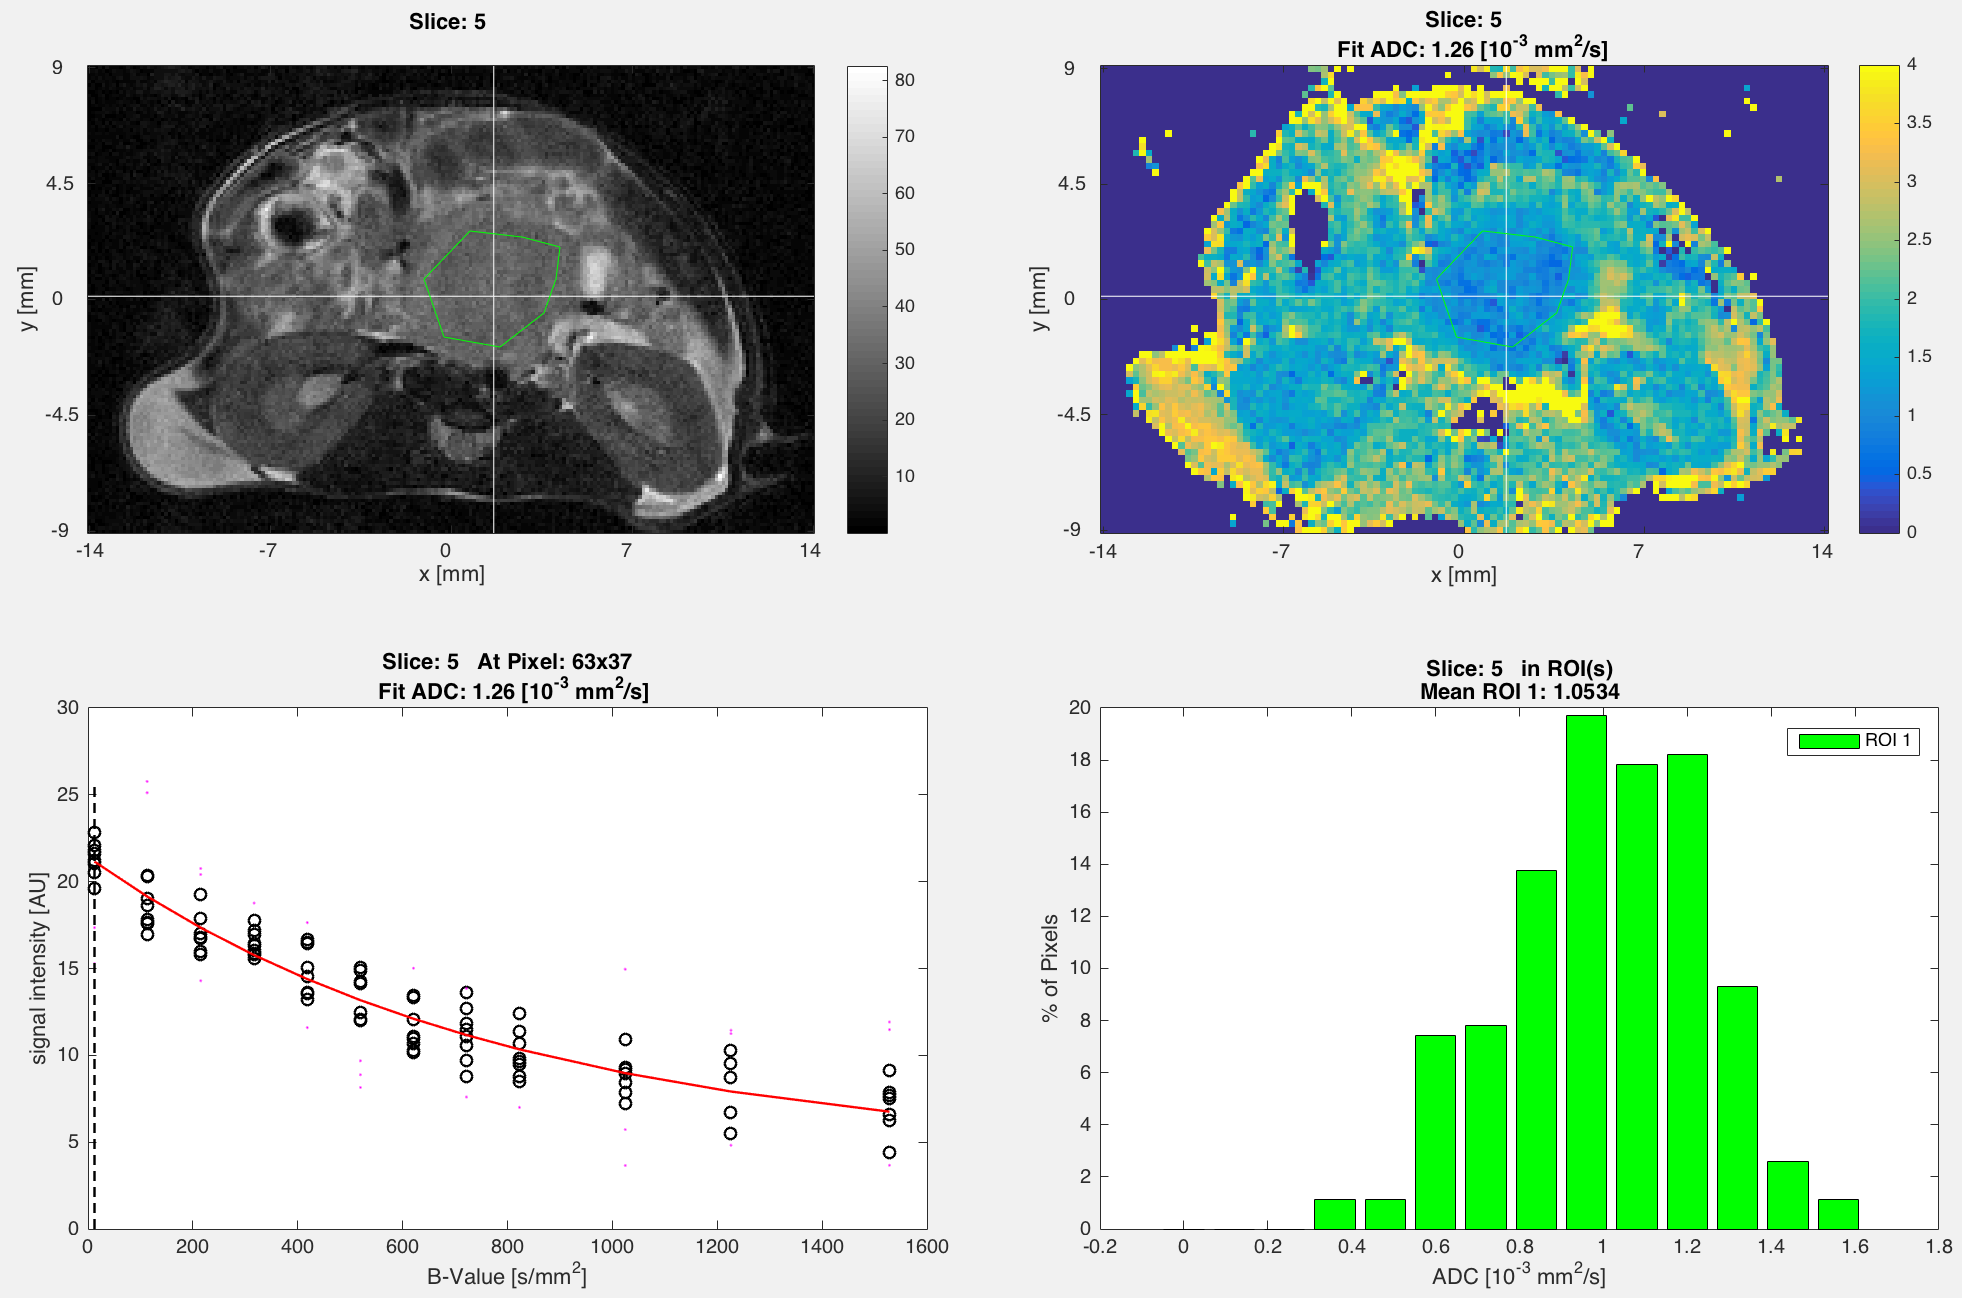
Top Left: Anatomical T2w image with ROI (green) drawn in tumour.
Top Right: Single-slice ADC map corresponding to anatomical slice, with the same ROI.
Bottom Left: Single pixel ADC fit (red curve), in pixel indicated by crosshairs (white) in top images. Black o indicate data points included in the fit, and magenta · indicate points excluded from final fit due to being outside of the fitting envelope from the initial fit curves.
Bottom Right: Histogram of single-voxel ADC values within the ROI shown in the top two images.
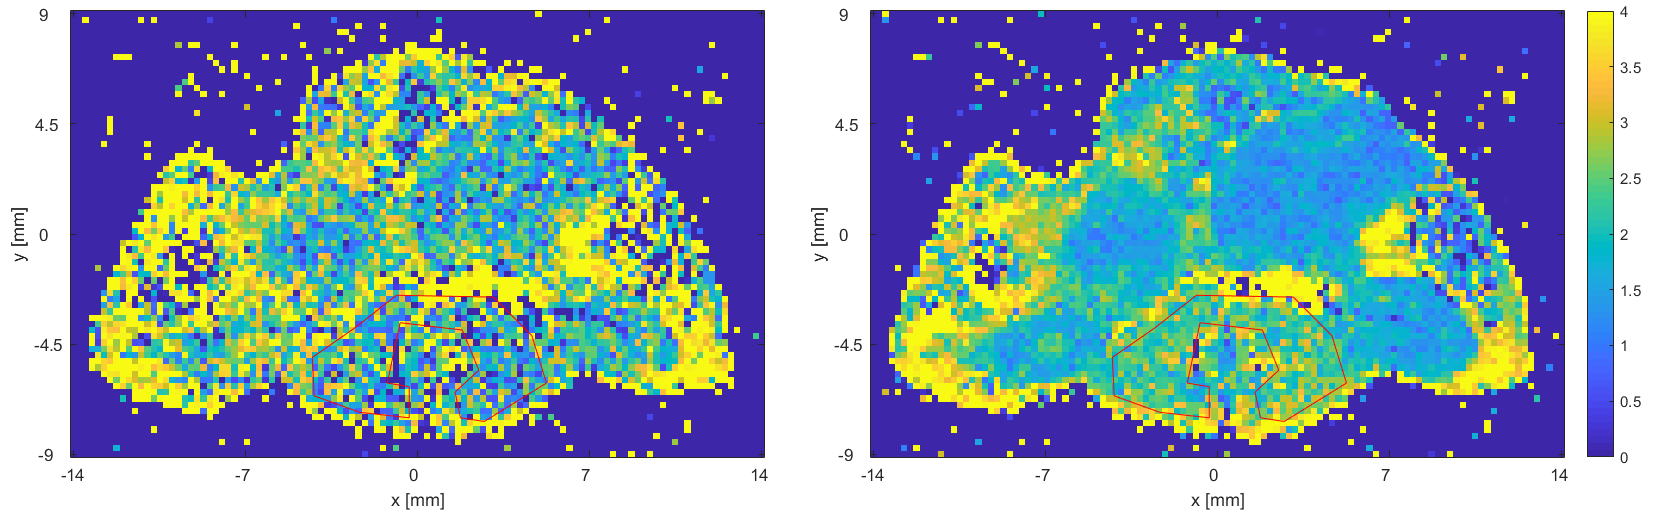
Example ADC map (10-3 mm2/s). ROI (red) is drawn in muscle, which is taken as a region of uniform diffusion characteristics.
Left: Fit without high b-values (only 12-722 s/mm2)
Right: Fit with all b-values (12-1528 s/mm2).
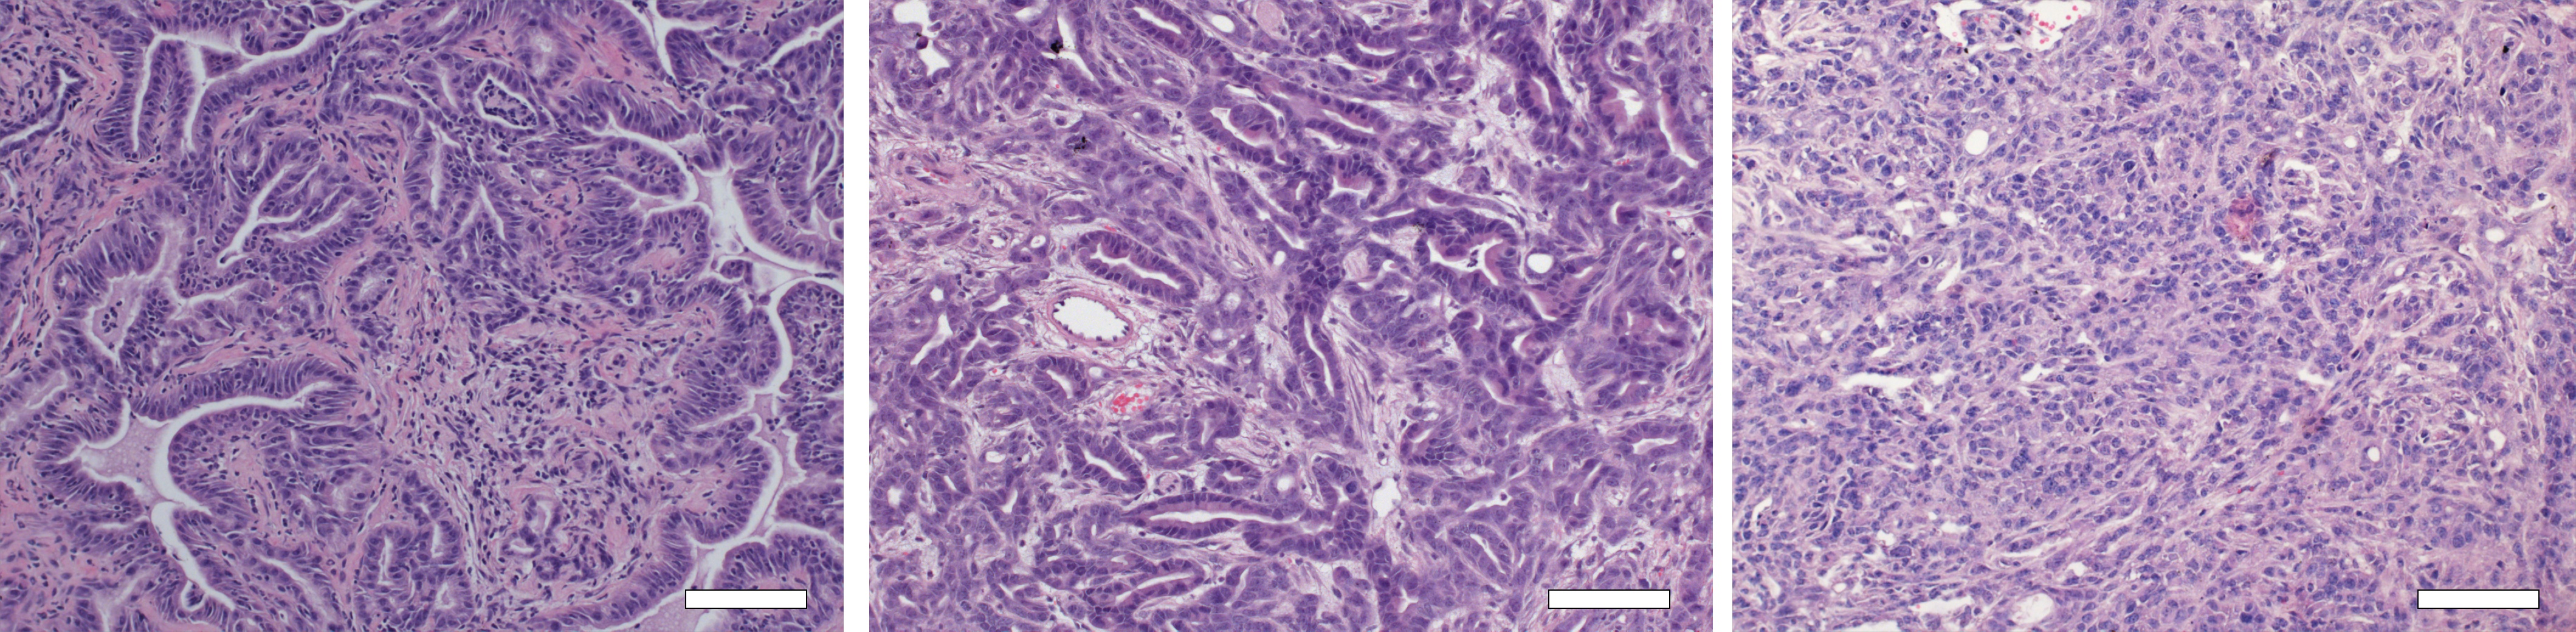
Hematoxylin and eosin (H&E) stains of PDAClow (left), PDACmed (middle), and PDAChigh (right) tumour tissue. White bars indicate 50 µm.
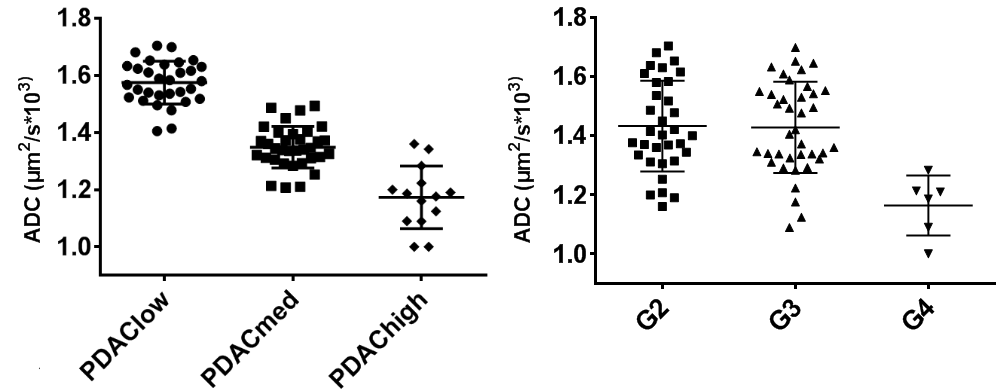
Left: ADCs grouped by tumour cellularity.
Right: ADCs grouped by histological grade.
Each point is the mean of 3 adjacent slices' ROI-mean of fit ADCs.