2366
Probing the combined effects of collagen concentration and cell density on MR diffusion and relaxivity using a model system1Cancer Research UK Imaging Centre, The Institute of Cancer Research, Sutton, United Kingdom
Synopsis
Cell-encapsulating collagen-based models can be used to investigate the relative contributions of the intra and extracellular compartments to ADC, T1 and T2. ADC is mostly affected by cell density, while T2 is influenced primarily by the collagen density; a 120% reduction in T2 was seen when collagen density was increased seven-fold, but this reduction was only 80% in cell containing collagen gels. ADC was not altered by increasing collagen density, unless cell density was also increased.
Background
Tumors are characterized by a low Apparent Diffusion Coefficient (ADC) on diffusion-weighted MRI (DWI) and an intermediate T2 signal intensity compared to normal soft tissues1. These properties have been ascribed to their higher cell density and higher free water content2. ADC of tumors has also been associated with collagen density within the extracellular matrix in some cancers3. In vivo studies describing the relative effects on ADC and T2 within tumours are reported4, but because of highly complex tissue structure, it is difficult to separate the effects of specific cell and molecular compartments.Aim
To establish the effects of cell density on ADC, T1 and T2 in association with simultaneous changes in collagen density in collagen gel-cell models.Methods
PC3 cells were cultured and counted using a hemocytometer. Cell suspensions were encapsulated within collagen gels by adding cells to collagen solution immediately after initiating collagen assembly by pH increase to pH 7. Collagen assembly was performed at 21°C , for 30 min before transferral to an incubator (37°C, 5% CO2). Assembly conditions were consistent for samples with/without cells as collagen microstructure is known to depend on assembly temperature. To generate higher cell and collagen densities, samples underwent confined compression (20 secs)5 with the use of a mould and plunger. The difference in mass pre and post compression was used to estimate the increase in collagen and cell density, assuming that only liquid escaped and that the density of the escaped liquid = 1g/cm3. Compressed samples were re-embedded within 1.6 mg/mL collagen. Cell viability following compression and MRI was confirmed using resazurin or MTT viability assays.
Imaging was performed on a 7.0 T horizontal pre-clinical magnet (Bruker Biospin, Germany), in a 3 cm birdcage coil with a 23 mm field of view (FOV). Image acquisition used Paravision 6.01 (Bruker, Germany). DWI was performed using a Stejskal and Tanner spin echo with EPI readout with 10 b-values (0-1000 mm2/s), a gradient duration and spacing of 7 and 14 ms respectively, TE = 38 ms and TR = 1500 ms, with four averages. T1 and T2 weighted imaging were performed using a TrueFISP sequence6 where 50 images were collected (TI = 5-3000 ms); TE = 1.91 ms; TR = 3800 ms.
ROIs were drawn around the entire visible uncompressed sample or compressed layer and the ADC, T1 and T2 were quantified. For the collagen only samples, where the sample was difficult to identify from the surrounding medium on T2 weighted images, ROIs were drawn on the b=1000 mm2/s image and were copied onto the ADC map.
Results
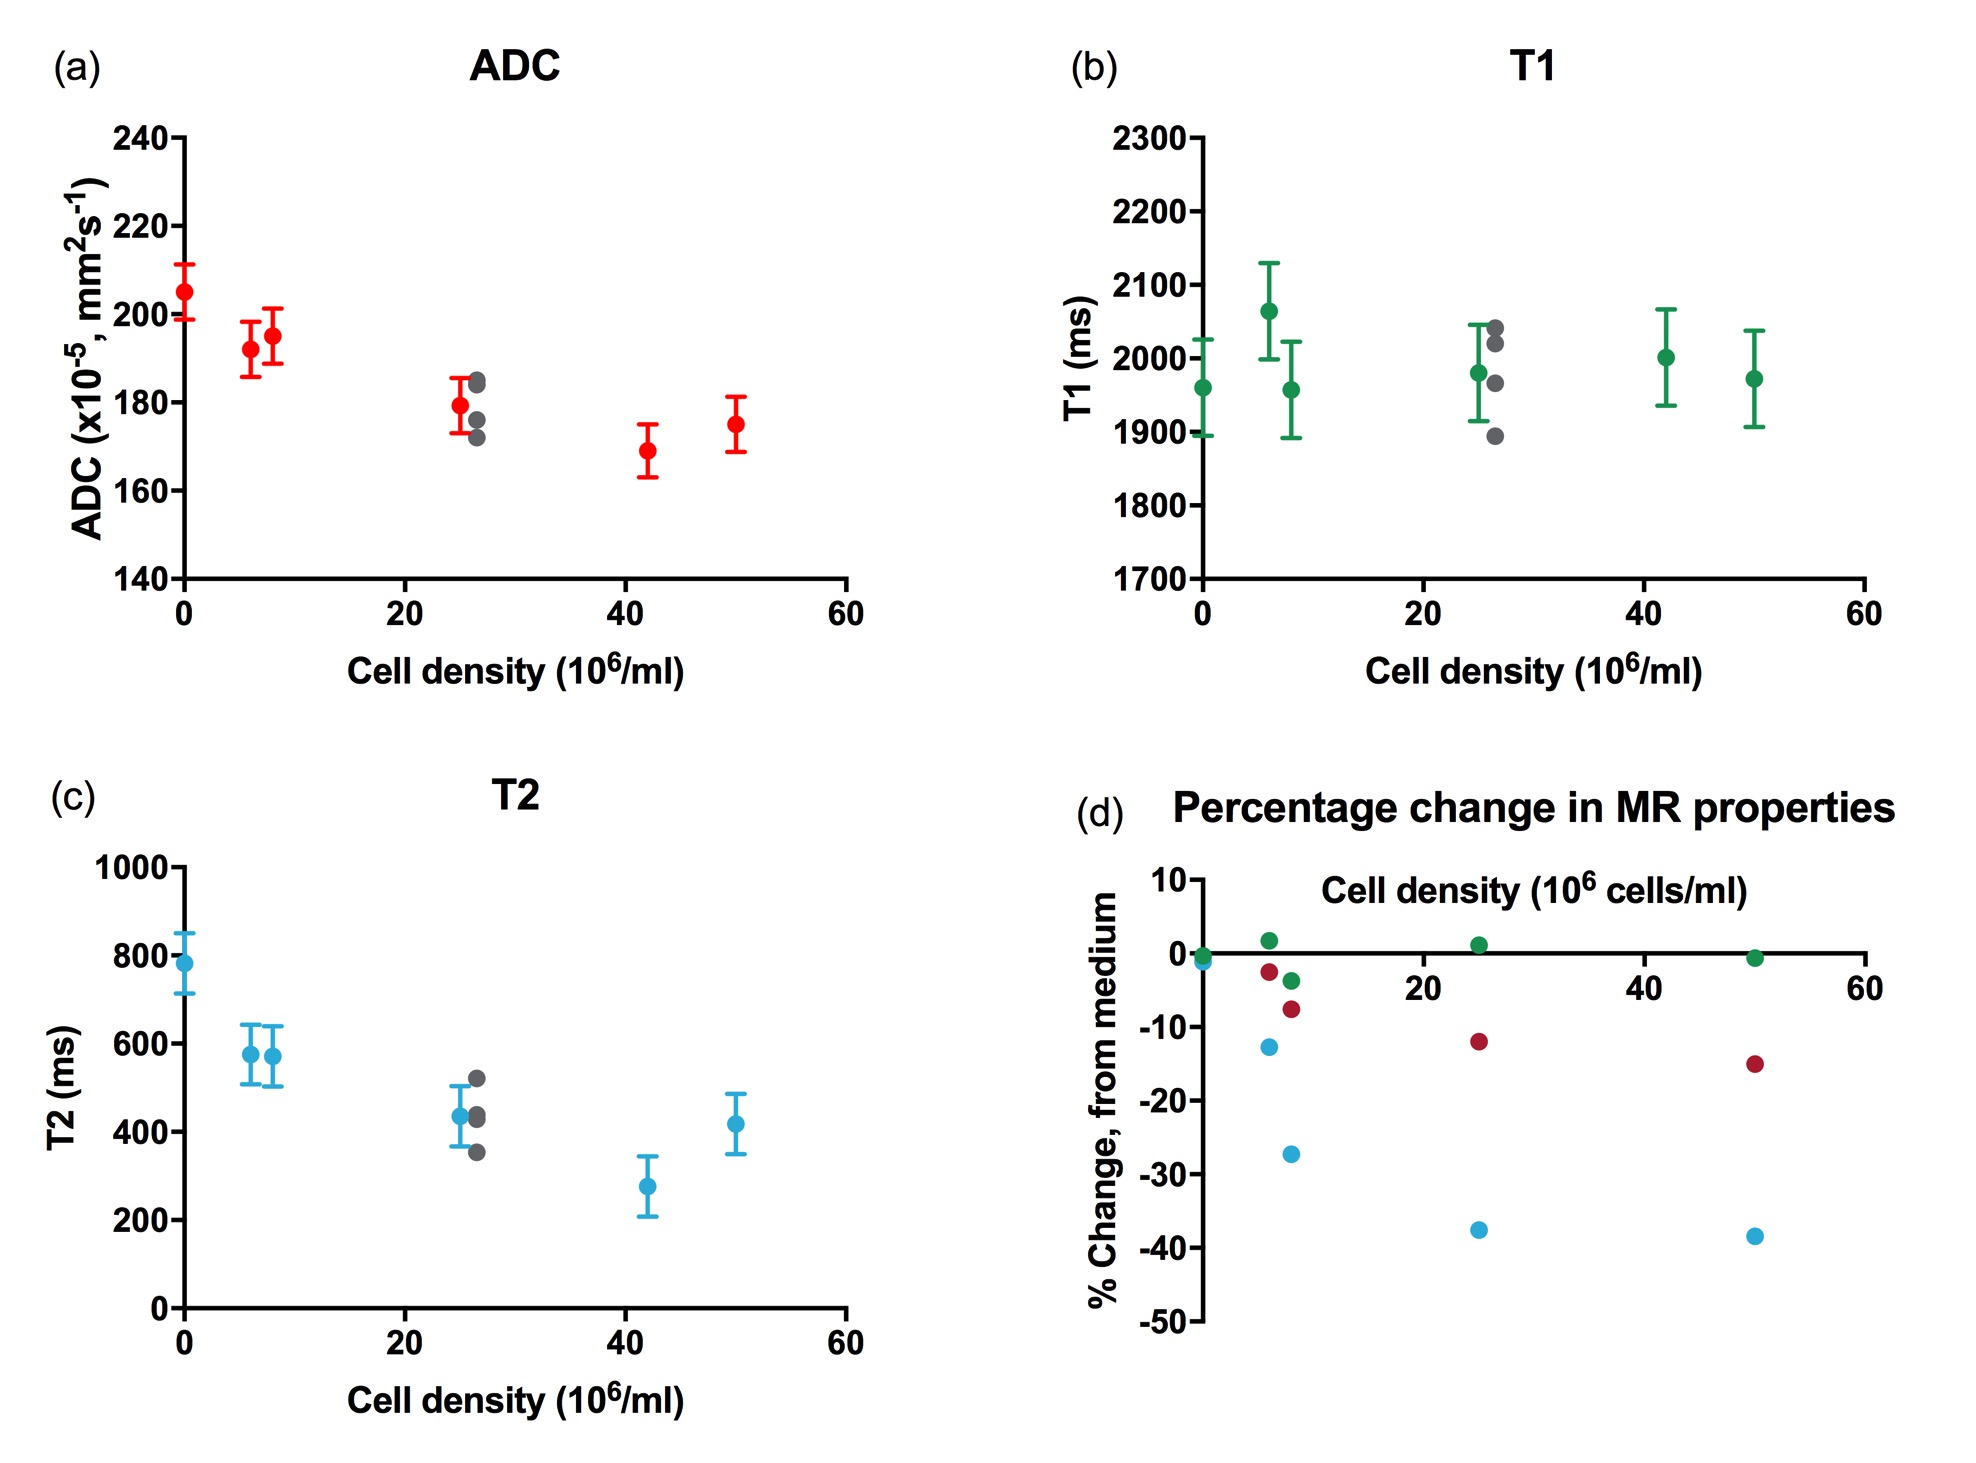
Repeatability data of the collagen-cell samples showed that ADC and T1 were stable but T2 varied. Coefficient of Variation (SD/Mean) was 3.5% for ADC, 2.6% for T1 and 15.8% for T2.
T1 did not appear to exhibit any dependence on cell density but both ADC and T2 decreased with increasing cell density. The percentage change in ADC, T1 and T2 from that of the surrounding medium in each sample vs cell density is shown in Figure 1. T2 exhibited the largest changes with increasing cell density.
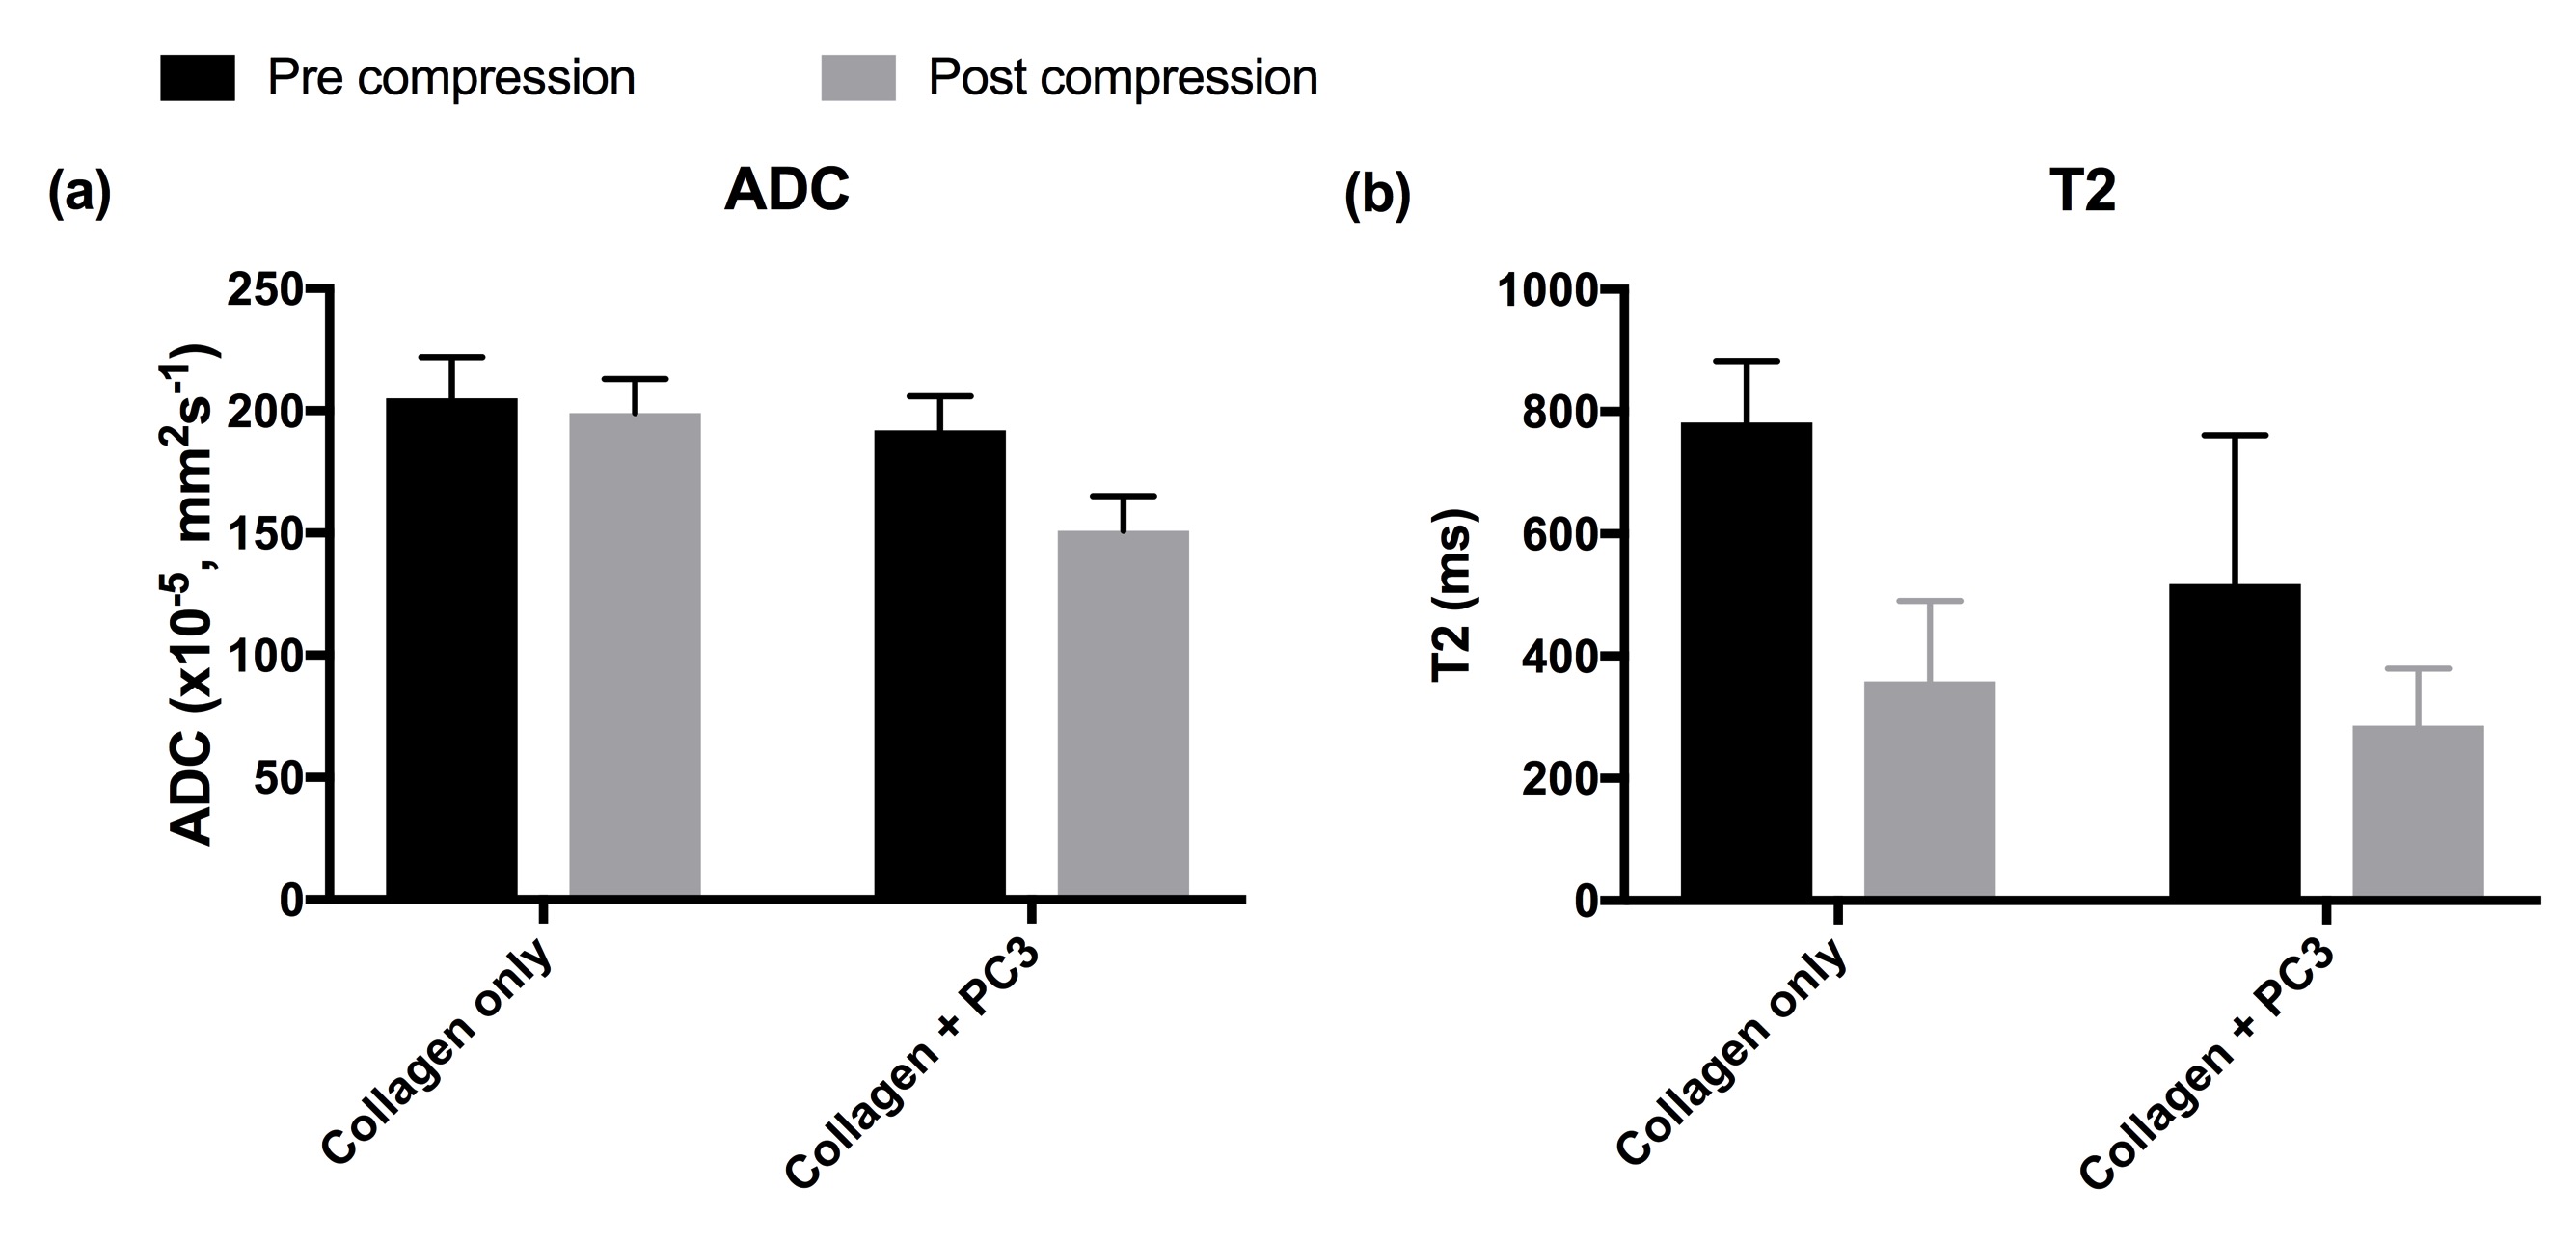
Viability of cells was maintained following compression experiments, confirmed by resazurin or MTT viability assay. Compression resulted in an estimated seven-fold increase in collagen/cell concentration (1.6 – 11.8 mg/mL collagen, 6 – 42 x106 cells/mL). The PC3-collagen sample had a lower ADC (Figure 2a) and T2 (Figure 2b) than the collagen only gels. This remained true after compression. The magnitude of the decreases in the two MR properties, however, differed between cell-containing and pure collagen gels. The change in T2 was seen in collagen-gels both with and without PC3 cells, but was larger (120% vs. 80%) in the collagen-only gel, whilst only the PC3-collagen gel exhibited a measurable decrease (20%) in ADC.
Discussion and Conclusion
Cell-encapsulating collagen-based models can be used to investigate the relative contributions of the intra and extracellular compartments to ADC, T1 and T2. ADC and T2 both decrease with increasing cell density, but while the ADC is mostly affected by cell density, the T2 is influenced primarily by the collagen density. Quantitative T2W imaging may therefore be informative on matrix microstructure particularly where collagen deposition and content is associated with enhanced migration or aggression of a tumour.Acknowledgements
CRUK support to the Cancer Imaging Centre at ICR and RMH in association with MRC and Department of Health C1060/A10334, C1060/A16464.References
1. Charles-Edwards EM, deSouza NM. Diffusion-weighted magnetic resonance imaging and its application to cancer. Cancer Imaging. 2006 Sep 13;6:135-43.
2. Surov A, Meyer HJ, Wienke A. Correlation Between Minimum Apparent Diffusion Coefficient (ADC(min)) and Tumor Cellularity: A Meta-analysis. Anticancer Res. 2017;37(7):3807-3810.
3. Hauge A, Wegner CS, Gaustad JV, et al. Diffusion-weighted MRI-derived ADC values reflect collagen I content in PDX models of uterine cervical cancer. Oncotarget. 2017 Nov 11;8(62):105682-105691.
4. Simpkin CJ, Morgan VA, Giles SL, et al. Relationship between T2 relaxation and apparent diffusion coefficient in malignant and non-malignant prostate regions and the effect of peripheral zone fractional volume. Br J Radiol. 2013 Apr;86(1024):20120469.
5. Nyga A, Loizidou M, Emberton M, et al A novel tissue engineered three-dimensional in vitro colorectal cancer model, Acta Biomaterialia. 2013; 9(8):7917-7926.
6. Oppelt A, Graumann R, Barfuß H, et al FISP- a new fast MRI sequence, Electromedica. 1986; 54(1):15-18.
Figures