2365
Longitudinal diffusion kurtosis MRI in an intracranial rat glioblastoma model1Centre for Preclinical Imaging, University of Liverpool, Liverpool, United Kingdom, 2Department of Applied Mathematics, Liverpool John Moores University, Liverpool, United Kingdom
Synopsis
Diffusion kurtosis MRI was used to evaluate the longitudinal changes in a tumor microstructure of a rat model of glioblastoma. F98 tumor cells were injected into six rat brains and imaged longitudinally 8, 11 and 14 days post-implantation. For DKI, an EPI-DTI sequence was used with 2 b-values (1000-2000 s/mm2) and 15 directions. Diffusional kurtosis parameters increased in the tumor compared to the contralateral healthy brain. No significant change with time in the tumor was observed for any diffusion or kurtosis parameters.
Introduction
Diffusion Kurtosis Imaging (DKI) has shown promise in assessing microstructural heterogeneity of gliomas and its degree of diffusion restriction1-3 by measuring the deviation of diffusivity from a Gaussian distribution. DKI has been used to grade human gliomas4, assess cellularity5, structural heterogeneity in human diseases and different rodent models6-8. However, longitudinal changes in the kurtosis parameters of the tumor in comparison to conventional DTI parameters for assessing tumor growth have not been reported. Therefore, in this study, we examined the changes in diffusion properties of the intracranial F98 tumor. Methods
Methods
Animal model: Brain tumors were induced by transcranial injection of F98 cells in the right cortex. Six F344 female (100-120 g) rats were injected with 50,000 F98 cells suspended in 5 µL PBS solution. The rat was maintained in a three-point stereotaxic frame, a burr hole was drilled through the skull 3 mm right and 3 mm posterior from the bregma, and the cells were injected 2.5 mm into the brain.
MRI: In vivo MR images were acquired longitudinally on day 8, 11 and 14 post-tumor cell implantation at 9.4T. DKI MRI was carried out using a respiratory-gated spin echo EPI-DTI sequence (TE/TR = 23/2500 ms, 5 averages, 4 EPI segments, 38 slices, matrix = 128x64, FOV = 40x20 mm, voxel resolution: 0.3x0.3x0.3 mm, b-values = 0,1000,2000 s/mm2 , δ/Δ = 4/11 ms, 15 directions).
Image processing: Diffusion and kurtosis parametric maps were processed in DKE (Medical University of South Carolina, USA). Volumes of interests corresponding to the whole tumor, peritumoral edema and the contralateral healthy cortex were manually segmented and the masks were applied to the parametric maps. The median values were extracted from each region and used for statistical analysis.
Results
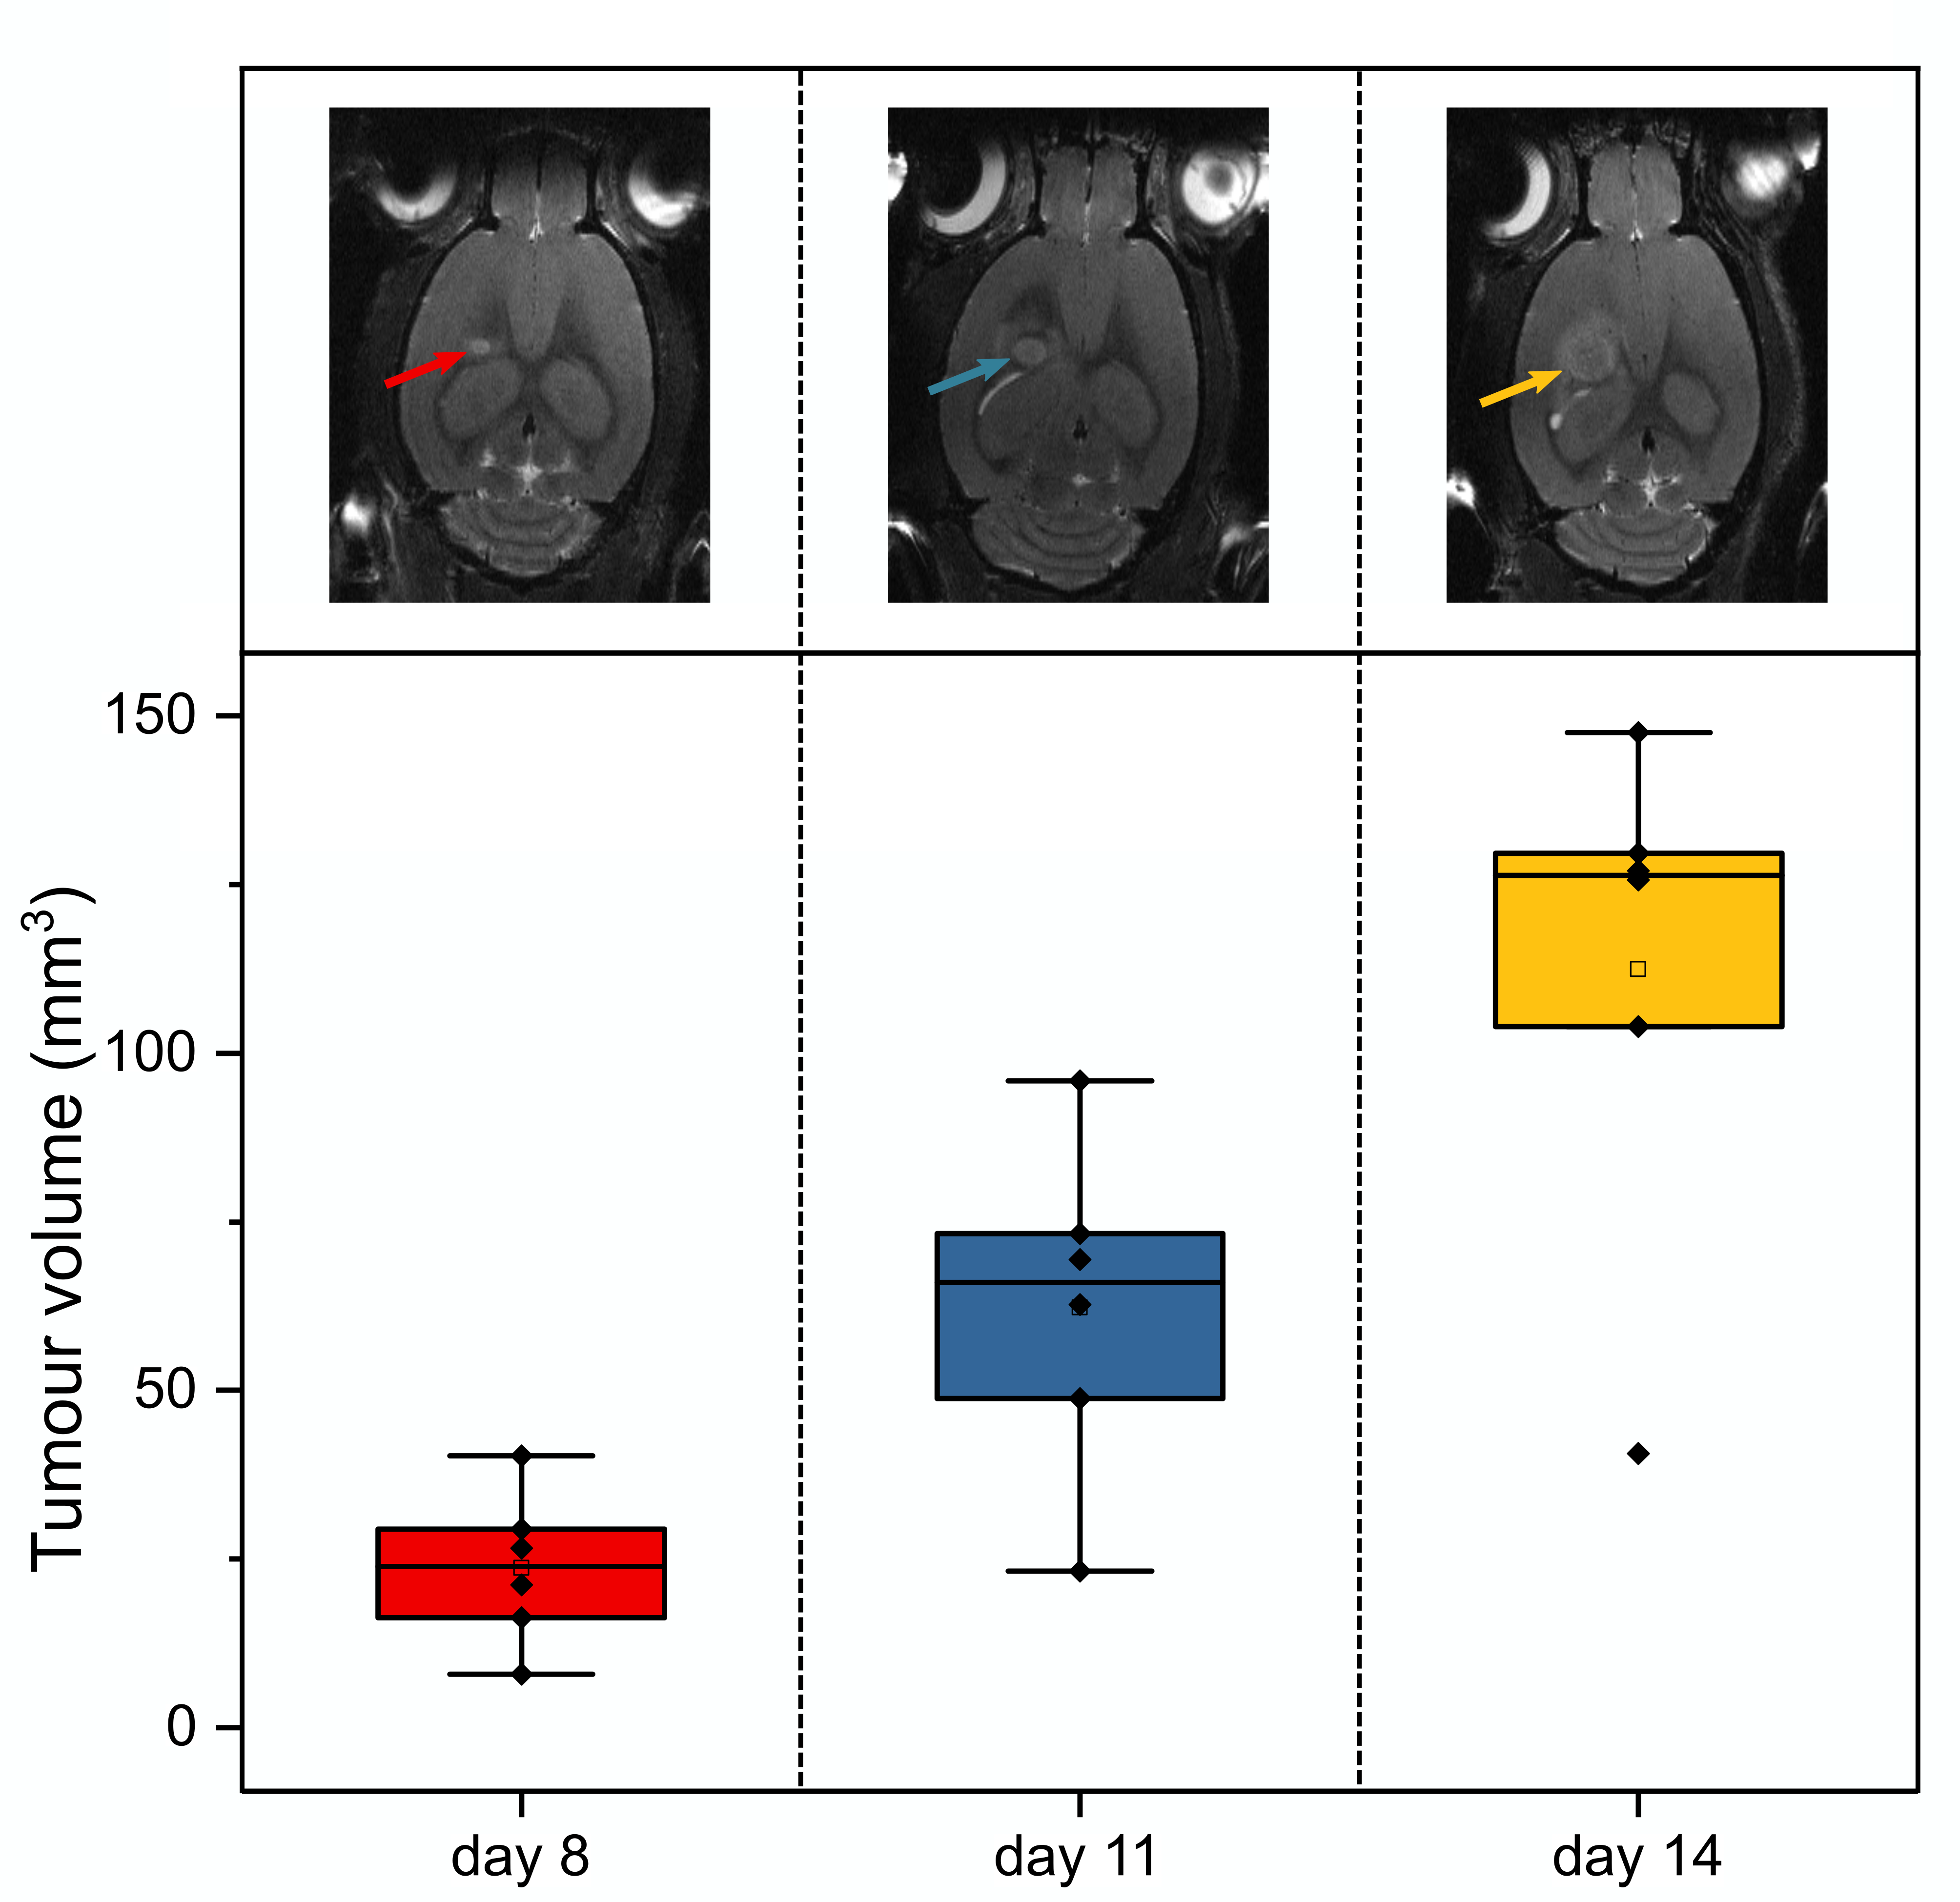
All rats developed tumors, detected on the MRI scans from one week post-cell transplantation (Figure 1). The tumor volume grew from 23.63±11.20mm3 (day 8) to 112.40±37.77mm3 (day 14).
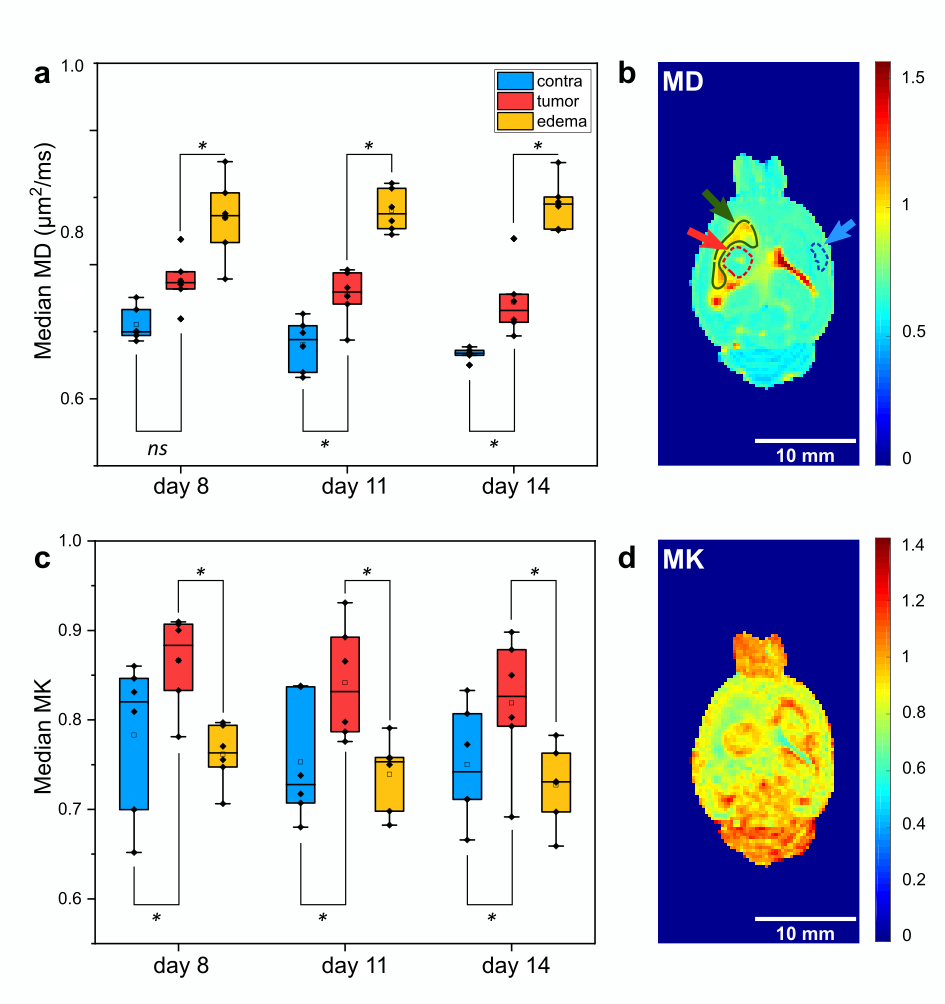
A Wilcoxon signed-rank test showed a significantly greater mean diffusivity (MD) in the tumor compared to the contralateral cortex from day 11 (Z=2.097, p=0.036) (Figure 2). The mean kurtosis (MK) was also significantly higher in the tumor compared to the contralateral cortex (Z=2.097, p=0.036 for all time points). No significant changes in MD (χ2=3, df=2, p=0.22) or MK (χ2=1.33, df=2, p=0.51) values was observed with the tumor growth.
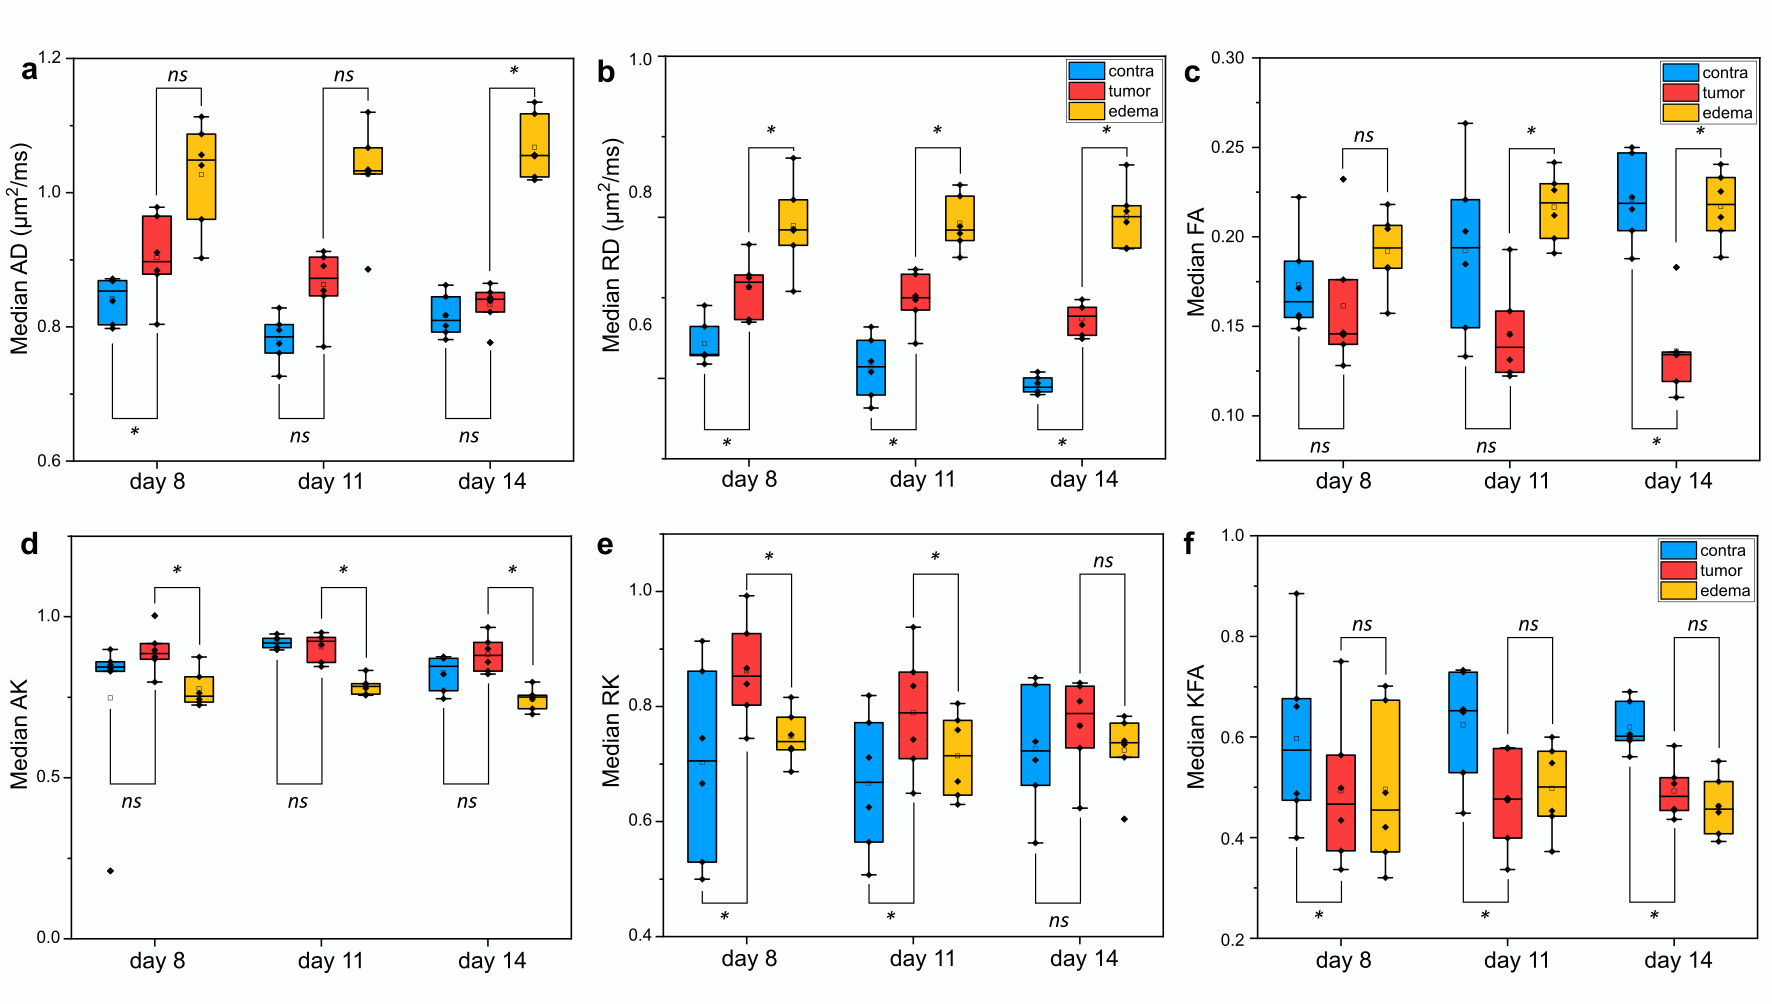
As illustrated in Figure 3, the radial diffusivity (RD) was significantly higher in the tumor than the contralateral cortex. The radial kurtosis (RK) was also significantly higher in the tumor on day 8 and day 11. No significant change was observed in the tumor axial diffusivity (AD) and kurtosis (AK) values. The fractional anisotropy (FA) was significantly lower in the tumor on day 14. Kurtosis fractional anisotropy (KFA) was significantly lower in the tumor at all time points. None of the diffusion or kurtosis parameters showed any significant change with time and tumor growth, although a trend of decreased MD and FA was noted in the tumor.
Discussion
The median diffusivity in the tumor was generally higher than the healthy contralateral cortex. This might originate from the high cellular density of the tumoral rim and the heterogeneity of the necrotic core. An increased MK was also observed in higher grade human glioma with higher cellularity9, but was also associated with inflammation and glial activity in a traumatic brain injury rat model10.
Lower FA values in the tumor indicate decreased diffusion anisotropy due to a more chaotic tumor cell organization. KFA, representing the anisotropy of the kurtosis tensor, has been recently described as useful microstructural contrast11,12. Lower KFA were observed in the necrotic center, indicating a much lower degree of tissue organization.
DKI provides information on the non-Gaussian distribution of the water diffusion and has been proposed to better characterize tumor heterogeneity than standard DTI parameters4,13. However, we did not observe any better sensitivity of DKI over DTI in separating the tumor from normal brain or the peritumoral edema. We had hypothesized that as the tumor grows, microstructural heterogeneity would increase due to hypoxia and necrosis, and would be quantifiable using DKI parameters. The lack of any significant change suggests very heterogeneous tumors at the earliest time point or that DKI is not sensitive enough in picking up these early microstructural changes.
Conclusion
The observed diffusional kurtosis profiles did separate the tumor from edema and the healthy brain tissue but did not evolve over time and might require the use of complementary imaging methods (e.g. conductivity measurements or time-dependent DTI) allowing for the separation of the intracellular and extracellular compartments, thus providing more insight on the tumoral microenvironment.Acknowledgements
Imaging data were obtained at the Centre for Preclinical Imaging (CPI) of the University of Liverpool.References
1. Fieremans E, Jensen JH, Helpern JA. White matter characterization with diffusional kurtosis imaging. NeuroImage 2011;58(1):177-188.
2. Jensen JH, Helpern JA, Ramani A, Lu H, Kaczynski K. Diffusional kurtosis imaging: The quantification of non-gaussian water diffusion by means of magnetic resonance imaging. Magnetic Resonance in Medicine 2005;53(6):1432-1440.
3. Jensen JH, Helpern JA. MRI quantification of non-Gaussian water diffusion by kurtosis analysis. NMR in Biomedicine 2010;23(7):698-710.
4. Hempel JM, Schittenhelm J, Bisdas S, Brendle C, Bender B, Bier G, Skardelly M, Tabatabai G, Castaneda Vega S, Ernemann U, Klose U. In vivo assessment of tumor heterogeneity in WHO 2016 glioma grades using diffusion kurtosis imaging: Diagnostic performance and improvement of feasibility in routine clinical practice. Journal of Neuroradiology 2018;45(1):32-40.
5. Liu H, Shen W, Zhang C, Cui Y, Li J, Zhang T, Chen W, Wang D. Diffusion kurtosis imaging evaluating epithelial–mesenchymal transition in colorectal carcinoma xenografts model: a preliminary study. Scientific Reports 2017;7(1):11424.
6. Hansen B, Shemesh N, Jespersen SN. Fast imaging of mean, axial and radial diffusion kurtosis. NeuroImage 2016;142:381-393.
7. Ding G, Chen J, Chopp M, Li L, Yan T, Davoodi-Bojd E, Li Q, Davarani SPN, Jiang Q. White matter changes after stroke in type 2 diabetic rats measured by diffusion magnetic resonance imaging. Journal of Cerebral Blood Flow & Metabolism 2015;37(1):241-251.
8. Chen X-r, Zeng J-y, Shen Z-W, Kong L-m, Zheng W-b. Diffusion Kurtosis Imaging Detects Microstructural Changes in the Brain after Acute Alcohol Intoxication in Rats. BioMed Research International 2017;2017:6.
9. Van Cauter S, Veraart J, Sijbers J, Peeters RR, Himmelreich U, De Keyzer F, Van Gool SW, Van Calenbergh F, De Vleeschouwer S, Van Hecke W, Sunaert S. Gliomas: Diffusion Kurtosis MR Imaging in Grading. Radiology 2012;263(2):492-501.
10. Zhuo J, Xu S, Proctor JL, Mullins RJ, Simon JZ, Fiskum G, Gullapalli RP. Diffusion kurtosis as an in vivo imaging marker for reactive astrogliosis in traumatic brain injury. NeuroImage 2012;59(1):467-477.
11. Hansen B, Jespersen SN. Kurtosis fractional anisotropy, its contrast and estimation by proxy. Scientific Reports 2016;6:23999.
12. Glenn GR, Helpern JA, Tabesh A, Jensen JH. Quantitative assessment of diffusional kurtosis anisotropy. NMR in Biomedicine 2015;28(4):448-459.
13. Hempel J-M, Bisdas S, Schittenhelm J, Brendle C, Bender B, Wassmann H, Skardelly M, Tabatabai G, Vega SC, Ernemann U, Klose U. In vivo molecular profiling of human glioma using diffusion kurtosis imaging. Journal of Neuro-Oncology 2017;131(1):93-101.
Figures