2364
Cluster analysis of IVIM parameter maps reveals tumor subregions of different proliferative status1Department of Radiation Physics, University of Gothenburg, Gothenburg, Sweden, 2Department of Medical Physics and Biomedical Engineering, Sahlgrenska University Hospital, Gothenburg, Sweden
Synopsis
Tumors are often heterogeneous, which can be seen with various imaging techniques. Even so, analysis based on quantitative imaging is often restrained to average tumor parameter values. In this study we used cluster analysis to identify tumor subregions based on IVIM parameter maps. The tumor subregions showed strong agreement with proliferative status as derived from histological analysis.
Introduction
Quantitative imaging techniques such as diffusion and perfusion MRI have potential not only to probe clinically relevant tumor characteristics, but also to provide their spatial distribution in vivo1. The ability to quantify tumor heterogeneity has been shown useful for, e.g., prediction of clinical outcome2.
Even though the heterogeneous nature of tumors is well known, analysis in most studies utilizing quantitative MRI is limited to average tumor parameter values, which may result in loss of important information3. To enable a more localized, but still comprehensible, analysis, the tumors can be partition into smaller subregions for further analysis4. The definition of such subregions can be based on functional information by applying, e.g., a clustering algorithm on parameter maps.
A quantitative MRI technique with great potential for tumor characterization is intravoxel incoherent motion (IVIM) analysis of diffusion-weighted imaging data. IVIM analysis provides information on perfusion and tissue water diffusion, both important markers for tumor evaluation1,5.
The aim of this study was to investigate if clustering based on IVIM parameter maps can be used to obtain tumor subregions with biological relevance.
Methods
Tumor model and MR
imaging
Fourteen mice with
human small intestine neuroendocrine tumor subcutaneous in the neck region (tumor diameter approximately 15mm)
were given non-curative
15MBq 177Lu-octreotate treatment (absorbed dose 4.0Gy)
resulting in responses ranging from reduced growth rate to significant tumor
volume reduction.
Diffusion-weighted SE-EPI images were obtained with a Bruker 7T system thirteen days after treatment, when the tumor volume was either constant or increasing after the initial therapeutic response. Imaging parameters were: b(Δ=9ms,δ=4ms)=1.4,14,25,36,56,82,108,421,751s/mm2 (5 animals) or 1.4,5,10,20,35,50,75,100,201,401,602,802s/mm2 (9 animals), TE=22ms, pixel size=320×320μm2, slice thickness=1000μm.
IVIM model fitting
IVIM parameter maps were obtained by Bayesian model fitting6 of the IVIM model:
$$S(b)=S_0((1-f)e^{-bD}+fe^{-bD^*})\quad[1]$$
where S(b) is the signal with b-value b, S0 is the signal without diffusion weighting, f is the perfusion fraction, D is the diffusion coefficient and D* is the pseudo-diffusion coefficient5.
Cluster analysis
The tumors were
manually delineated and the IVIM parameters D,
D* and f were extracted from each voxel separately and log
transformed before being fed into the clustering algorithms described below.
Data were clustered into k classes by fitting a Gaussian mixture model (GMM). The results thus consisted of k sets of prior class probabilities (P(l)), mean vectors (μl) and covariance matrices (Σl).
Similarly, data were also clustered with a Gaussian hidden Markov random field model (GHMRFM) as described previously7. The GHMRFM is similar to a GMM, but uses a prior distribution that depends on the neighboring voxels. The GHMRFM was utilized since clustering including spatial information has shown enhanced performance8.
Both clustering algorithms were also run with only D and f as input to study if D* provides additional information. Being able to exclude D* would reduce the high demands on image quality needed for estimation of D*9.
Data was chosen to be partitioned into two clusters based on goodness of fit.
Histological analysis
To study the biological relevance of the tumor
subregions obtained from cluster analysis, a
histological analysis was performed. After the MR examination the animals were
killed and tumor sections (3µm thick) were collected. Based on the clustering results, it was hypothesized that the
obtained clusters corresponded to different proliferative status. Staining was
therefore performed with Ki-67 to assess cellular proliferation. The stained tissue
sections were digitally imaged at 0.25×0.25μm2 resolution using a Leica SCN400 Slide Scanner. The tumor tissue regions were manually
delineated and segmented into proliferating or non-proliferating regions
as outlined in Figure 1.
Results and Discussion
Cluster analysis
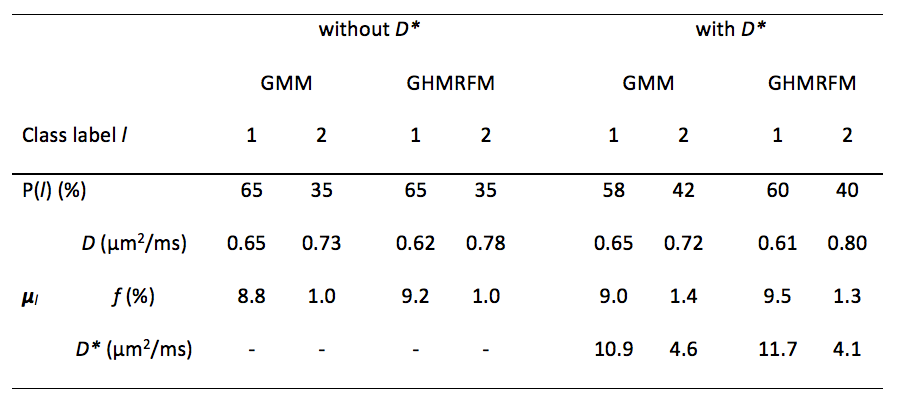
The IVIM parameters showed distributions that were well approximated by a mixture of two Gaussian distributions (Fig. 2). The two identified classes were characterized by either high perfusion and low diffusion, or low perfusion and slightly higher diffusion (Fig. 2 and Table 1), potentially corresponding to regions of high and low degree of proliferation, respectively. The resulting cluster maps showed large spatially contiguous tumor subregions (see example in Fig. 3). Inclusion of D* or spatial information only had minor effects on the clustering results (Figs. 3 and 4, and Table 1).
Histological validation
A strong agreement was found between the tumor subregions with high perfusion (indicating high supply of nutrient and oxygen) and low diffusion (potentially a marker of high cellularity) identified by clustering, and the subregions identified as proliferating by histological analysis. These results were seen both regarding spatial distribution (example in Fig. 3) and regarding size of subregions (Fig. 4).
Conclusions
This study shows that clustering based on IVIM parameter maps can identify tumor subregions that are associated with proliferative activity.Acknowledgements
The study was supported by grants from the Swedish Cancer Society and the King Gustav V Jubilee Clinic Cancer Research Foundation.References
1. Li SP, Padhani AR. Tumor response assessments with diffusion and perfusion MRI. J Magn Reson Imaging 2012;35:745–763.
2. Junttila MR, de Sauvage FJ. Influence of tumour micro-environment heterogeneity on therapeutic response. Nature 2013;501:346–354.
3. O’Connor JPB, Rose CJ, Waterton JC, Carano RAD, Parker GJM, Jackson A. Imaging intratumor heterogeneity: Role in therapy response, resistance, and clinical outcome. Clin Cancer Res 2015;21:249–257.
4. Carano RAD, Ross AL, Ross J, Williams SP, Koeppen H, Schwall RH, Van Bruggen N. Quantification of Tumor Tissue Populations by Multispectral Analysis. Magn Reson Med 2004;51:542–551.
5. Le Bihan D, Breton E, Lallemand D, Aubin ML, Vignaud J, Laval-Jeantet M. Separation of diffusion and perfusion in intravoxel incoherent motion MR imaging. Radiology 1988;168:497–505.
6. Gustafsson O, Montelius M, Starck G, Ljungberg M. Impact of prior distributions and central tendency measures on Bayesian intravoxel incoherent motion model fitting. Magn Reson Med 2018;79:1674–1683.
7. Zhang Y, Brady M, Smith S. Segmentation of brain MR images through a hidden Markov random field model and the expectation-maximization algorithm. IEEE Trans Med Imaging 2001;20:45–57.
8. Katiyar P, Divine MR, Kohlhofer U, Quintanilla-Martinez L, Schölkopf B, Pichler BJ, Disselhorst JA. A Novel Unsupervised Segmentation Approach Quantifies Tumor Tissue Populations Using Multiparametric MRI: First Results with Histological Validation. Mol Imaging Biol 2016;19:391–397.
9. Lemke A, Stieltjes B, Schad LR, Laun FB. Toward an optimal distribution of b values for intravoxel incoherent motion imaging. Magn Reson Imaging 2011;29:766–776.
Figures