2361
Getting more from less: a morphological model of diffusion in the prostate for improving the predictive power of DWI in identifying tumors.1Norwich Medical School, University of East Anglia, Norwich, NR4 7UQ, UK, United Kingdom, 2Department of Radiology, Norfolk and Norwich University Hospital, Norwich, United Kingdom
Synopsis
We constructed a morphological model of diffusion in the prostate from a limited number of diffusion-weighted images to increase the sensitivity of such diffusion imaging to the presence of prostate cancer. Estimating the measurement error (9.9%) and characterizing the prostate from a large public dataset (n=206) has shown morphological relationships (|r|>0.5) and provided distributions and relationships within the available ADC measures. A model can then be used to give expected values to test against, and enable much larger datasets to be synthesized with the aim of testing various machine learning approaches.
Introduction:
Diffusion-weighted imaging (DWI) is commonly used as an indicator for cancer in the prostate. However, DWI alone is poor at distinguishing between higher grades of cancer1. Coupling the prevalence of prostate cancer2 with the relative expense and length of MRI and comparing this to cancer screening in other sites such as breast cancer mammography, prostate cancer monitoring would clearly benefit from more efficient MRI screening, as a component of a wider program of monitoring. In this study, we aim to construct a phenomenological model for the apparent diffusion co-efficient (ADC) within prostate tissue using a limited set of diffusion-weighted images together with morphology and anatomical boundaries. The purpose of such a model would be two-fold: to produce expected values of diffusion measures to increase the sensitivity to a change in cell-density; and to use Monte-Carlo methods to create large synthetic datasets, against which the feasibility of various machine learning approaches can be tested.Methods:
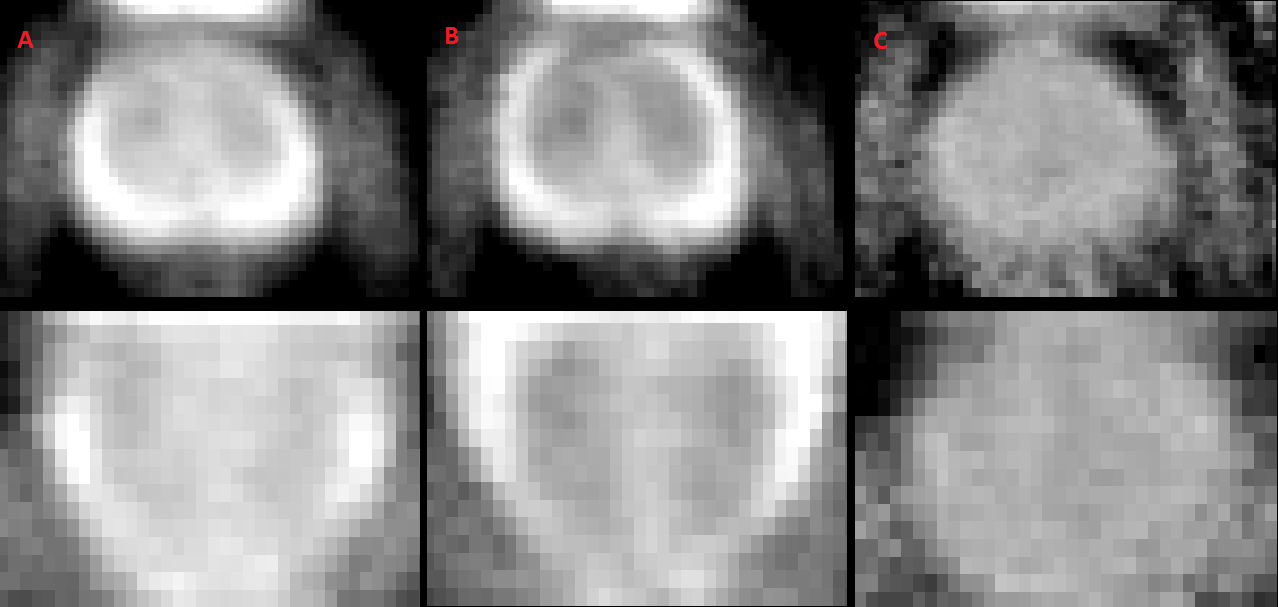
The public PROSTATEx2 challenge data3 contains T2-weighted, dynamic-contrast-enhanced, proton-density-weighted, and DWI data for 203 participants, and the positions of findings are provided (with Gleason scores) for 96 patients. We selected only the three diffusion-weighted images (50, 400 and 800 s/mm²) to provide two separate mono-exponentials: an apparent diffusion co-efficient (ADC) from b= 400, 800 and a “pseudo-ADC” from b=50,400 s/mm², expected to be sensitive to a combination of perfusion and ductal fluid signals. The respective b=0 was extrapolated to provide an additional T2-weighted image. To produce a standard prostate shape a pipeline was run to register the selected images between patients (using FSL/FLIRT4) to produce an amalgamated image (Figure 1) against which prostate anatomy could be defined. A fitting tool and GUI was then used to match the anatomy of the prostate (transition zone (TZ) and peripheral zone (PZ) with the remainder labelled anterior stroma (AS)), using both the ADC maps and b=800 s/mm² images. The matching of the shape generated by the pipeline produced regions-of-interest for each area, along with the respective parameters of morphology. In addition, finding positions were masked out to ensure only the theoretically healthy tissue was included. The morphology and respective diffusion properties were then extracted resulting in >200 parameters per prostate. The inherent variation in the ADC signals was also determined from the dataset as four patients had multiple scans, and from this a measurement error was estimated, against which each model component could be tested.Results/Discussion:
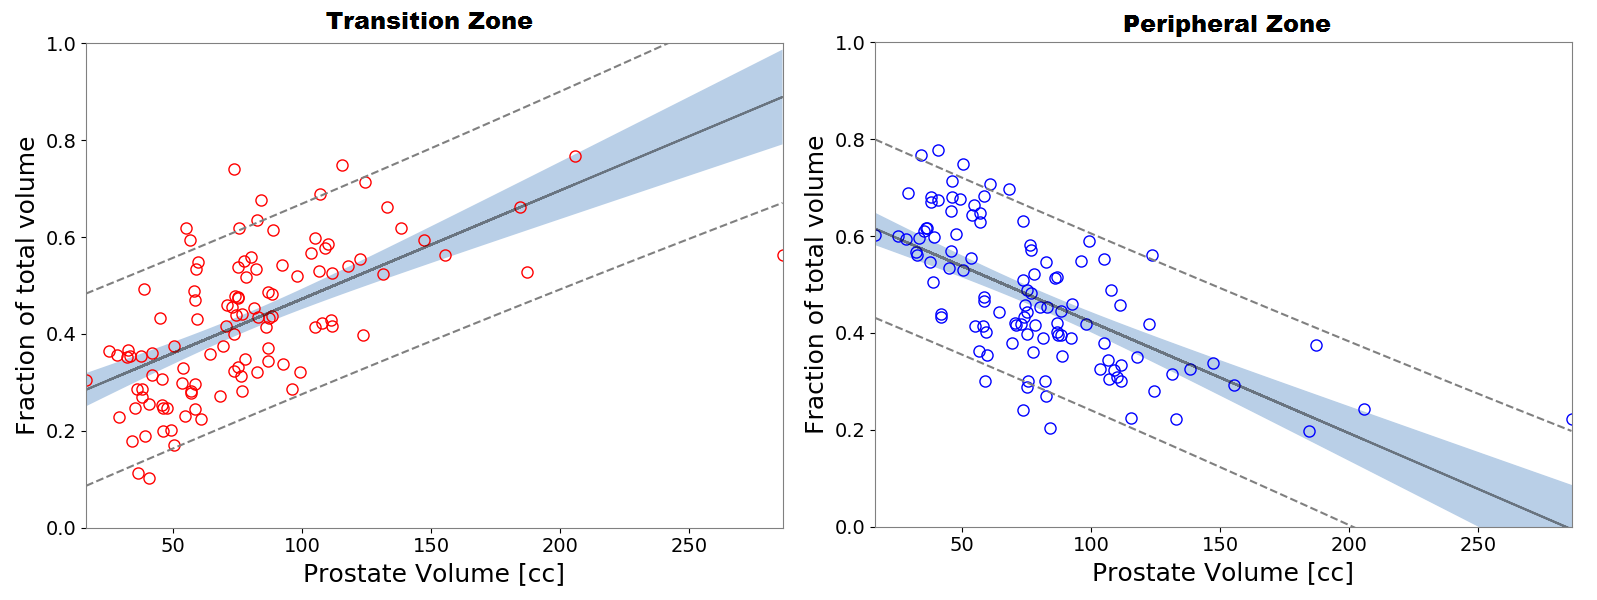
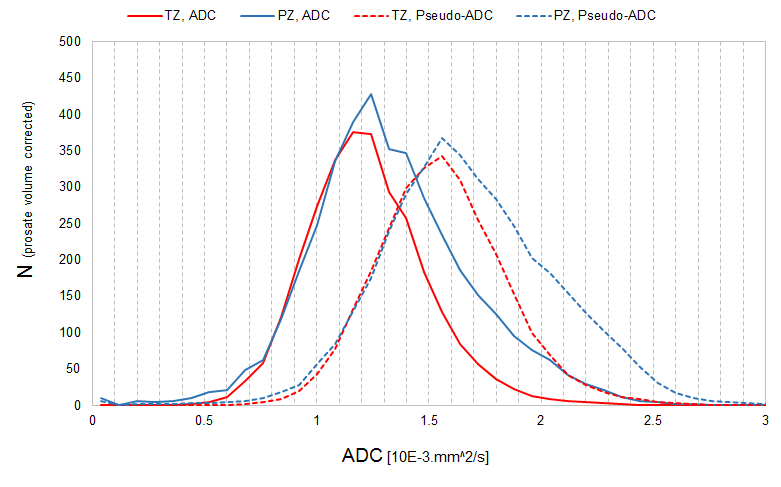
Preliminary results for 111 patients are included at this stage, to identify aspects of the processing that can inform the model, though the full dataset will be included in due course. A mean measurement error of σ = 9.9% (n=4, min: 9.1%, max: 10.7%) was established. The overall volume of the prostate was driven predominantly by the TZ (Figure 2), likely related to benign prostatic hyperplasia5, but specifically here the lateral size of the TZ dominates (Pearson correlation co-efficient r=0.639, p<<0.001). The expansion in TZ also correlates with an elevation in the standard deviation in the b=0 signals (S0) in the PZ and AS regions (r=0.527-0.631, p<<0.001), crucially above the inherent measurement error of the method. The ADC measures are independent of the morphology in these preliminary results, which suggest prediction is possible with fewer parameters. The increase in the median ADC from TZ to PZ (Figure 3) is consistent with literature results6. The two distributions of ADC below the median are consistent between volumes; this suggests that the PZ has a separate additional component to diffusion to the TZ. The PZ is responsible for 75-85% of cancers, and for higher-grade tumors, and involvement in the TZ alone is rare7, so characterizing this additional component is key. An iterative multi-component optimization model can now be produced to model the cohort of prostates in diffusion measures, anatomy and available patient demographics.Conclusion:
In this work, we have created a pipeline for the processing of a large set of prostate diffusion data and identified areas of interest for further parameterizing of the diffusion within the prostate anatomy, to inform a “standard model”. The identification of relevant parameters, and construction of new sensitive metrics is a vital first step in creation of a model.Acknowledgements
We would like to acknowledge that the data used in this research were obtained from The Cancer Imaging Archive (TCIA) sponsored by the SPIE, NCI/NIH, AAPM, and Radboud University.)References
[1] - Vargas HA, Akin O, Franiel T, Mazaheri Y, Zheng J, Moskowitz C, Udo K, Eastham J, Hricak H. Diffusion-weighted endorectal MR imaging at 3 T for prostate cancer: tumor detection and assessment of aggressiveness. Radiology. 2011 Jun;259(3):775-84
[2] - Siegel RL, Miller KD, Jemal A. Cancer Statistics, 2017. CA Cancer J Clin. 2017;67(1):7-30.
[3] - Litjens G, Debats O, Barentsz J, Karssemeijer N, Huisman H. Computer-aided detection of prostate cancer in MRI. IEEE Transactions on Medical Imaging, 2014; (33)1083-92.
[4] – Jenkinson M, Bannister PR, Brady JM, and Smith SM. Improved optimisation for the robust and accurate linear registration and motion correction of brain images. NeuroImage, 2002; 17(2):825-841.
[5] - Kaplan SA, Te AE, Pressler LB, Olsson CA. Transition zone index as a method of assessing benign prostatic hyperplasia: correlation with symptoms, urine flow and detrusor pressure. J Urol. 1995 Nov;154(5).
[6] - Langkilde F, Kobus T, Fedorov A, Dunne R, Tempany C, Mulkern RV, Maier SE. Evaluation of fitting models for prostate tissue characterization using extended-range b-factor diffusion-weighted imaging. Magn Reson Med. 2018 Apr;79(4):2346-2358.
[7] - Augustin H, Erbersdobler A, Hammerer PG, Graefen M, Huland H. Prostate cancers in the transition zone: Part 2; clinical aspects. BJU Int. 2004 Dec;94(9).
Figures