2360
Combined diffusion and perfusion MRI in Glioblastoma predicts glial stem cells proliferation and aggressiveness1UMR 1214 Toulouse Neuroimaging Center, INSERM, Toulouse, France, 2Department of Neurosurgery, University Hospital of Toulouse, Toulouse, France, 3U1037 Toulouse Cancer Research Center, INSERM, TOULOUSE, France
Synopsis
Interpretation of diffusion and perfusion MRI in the hyper-FLAIR is challenging. In this work, biopsies were extracted from 16 subjects and infiltrative tumorous stem cells were counted and cultivated intraoperatively to measure their aggressiveness. Diffusion was found to be a good predictor of the time to form tumorous neurospheres. Glioblastoma stem cells were found preferably in regions with strong perfusion, that is to say near vascular niches.
Purpose
Clinical treatment of glioblastoma is highly challenging due to the strong heterogeneity of tumorous glial cells in term of aggressiveness, radioresistance, cell subtype, and tumorous cell proportion and density. With its capacity of measuring multiple properties of the micro-environment, MRI is expected to improve the patient personalized care (surgery and chemoradiotherapy) by informing physicians about critical (or not) infiltration of tumorous cells in the tissue surrounding the active tumor (hyper-FLAIR). For instance, apparent diffusion coefficient (ADC), obtained from diffusion MRI, has been shown to provide early signs of glioblastoma recurrence [1]. Because of the limited material with histological ground truth, the interpretation of these MR properties variations is often challenging. In practice, ADC is generally associated with cell density, and cerebral blood flow, extracted from perfusion MRI, with tumorous cells activity. Actually, these measurements are not perfectly specific and independent due to confounding effects (e.g. IVIM effect or the activity of aquaporins in Diffusion; angiogenesis or blood-brain-barrier breakdown for perfusion). In this work, we extracted two biopsies, intraoperatively, from patients with glioblastoma (clinical trial NCT01872221). Biopsies were collected in two highly different hyper-FLAIR micro-environment as expected by the variation of the ratio choline over N-acetylaspartate (cho/NAA) obtained from spectroscopy MRI [2]. The proportion of infiltrative glioblastoma stem cells (GSC) were counted and put in culture in order to measure their aggressiveness.
Based on this data, a model-free approach called independent component analysis (ICA) was investigated in order to disentangle the different effects and improve the specificity of diffusion and perfusion.
Material and Methods
MRI Data acquisition. Data were acquired on 16 patients diagnosed with Glioblastoma (aged 64+/-12, 11 males), preceding surgery (Fig.1), on a 3T MRI system (ACHIEVA dStream, Philips). A 32-channel coil was used. Anatomical. The anatomical MRI protocol included a 3D T1-weighted with 15 ml Gadolinium injection, a FLAIR, and a turbo-spin-echo T2w. Diffusion. A single-shot EPI sequence was used (TR=10s, bvalue=1000, 15 directions, TE=55ms, matrix=112x112, voxel size=2×2×2 mm3, 60 slices). Perfusion. A dynamic contrast-enhanced method with an EPI sequence was used (TR/TE=1700/50 ms, FA=75°, matrix size=128×128, 22 slices, voxel size=1.75x1.75x5mm3). Spectroscopy. 2D Spectroscopy was performed using a point-resolved spectroscopy acquisition (PRESS) over 4 slices covering the lesions. matrix=8x8, resolution=1x1x1cm3.
Biopsy. Two regions in the hyper-FLAIR were extracted based on the MR spectroscopy signature (Cho/Naa>2 and Cho/Naa<2). After extraction, samples were (i) analyzed to study the percentage of GSC over the total number of cells (GSC%) and (ii) cultivated to produce neurospheres (Fig.2) after a couple of weeks (time to neurosphere formation). The GSC% is a marker of malign cells infiltration and the time-to-neurosphere formation is associated with tumorous cells aggressiveness and density.
MRI Data processing. Motion correction, registration, and maps of Apparent Diffusion Coefficient (ADC) and Cerebral Blood Flow (CBV) maps were performed using the Sisyphe Toolbox developed at our center [3]. Normalization of the CBV was done using a manually selected white matter region in the contralateral part of the tumor. ADC and rCBV were then averaged in the two ROIs of 2000 pixels around the zone of biopsy extraction.
Statistics. ADC and CBV were correlated to GSC% and to the time to grow neurospheres. In order to increase the specificity of these MR biomarkers, an ICA analysis over two components was performed in order to extract the common information associated with angiogenesis or tumorous stem cell infiltration. The training of the independent vectors was done on all voxels of the hyper-FLAIR and measures in the ROIs were then projected on these two vectors.
Results
CBV was associated with the proportion of GSC (r2=0.17, p=0.04) and ADC with time to neurospheres formation (r2=0.5, p=0.0003) (Fig.3). Other correlations were low (r2<0.12) and not significant. The second independent component improved the prediction for GSC% (r2=0.27, p=0.008).Discussion
In this study, we showed a strong relationship between ADC obtained from diffusion MRI and tumor cells aggressiveness measured with the time to neurospheres formation from human biopsies. Conversely, no correlation (r2<0.001) of ADC with GSC% was observed. This can be explained by the high permeability of glioblastoma stem cells membranes due to high AQP4 expression and activity [4], especially in Glioblastoma [5], thus increasing instead of decreasing diffusion coefficient. No correlation (r2<0.1) was observed between rCBV and the time to neurosphere formation, but rCBV was correlated with GSC% which could be explained by the fact that GSC are preferentially localized near vascular niches.Conclusion
This work improves the interpretation of ADC and rCBV biomarkers in Glioblastoma and proposes a combined metric that improve the specificity of the measurements. Reduced ADC is a good predictor of tumorous cell aggressiveness and density, while high rCBV reveals the localization of potential niches of GSC.Acknowledgements
The clinical trial (STEMRI NCT01872221) was financed by the Recherche Innovation Thérapeutique Cancérologie (RITC), and the entire project (MoGlimaging) by the Cancer Heterogeneity Tumoral Ecosystem (HTE) program.References
[1] P.D. Chang et al., AJR. American journal of roentgenology, 2017, 208, 57.
[2] A. Laprie et al., International journal of radiation oncology, biology, physics, 2008, 70, 773.
[3] F. Tensaouti, J.A. Lotterie, I. Berry, MICCAI workshop on Diffusion Modelling and the Fiber Cup, 2009.
[4] J. Badaut et al., Journal of cerebral blood flow and metabolism: official journal of the International Society of Cerebral Blood Flow and Metabolism, 2011, 31, 819.
[5] Y.-L. Lan et al., Oncotarget, 2017, 8, 32345.
Figures
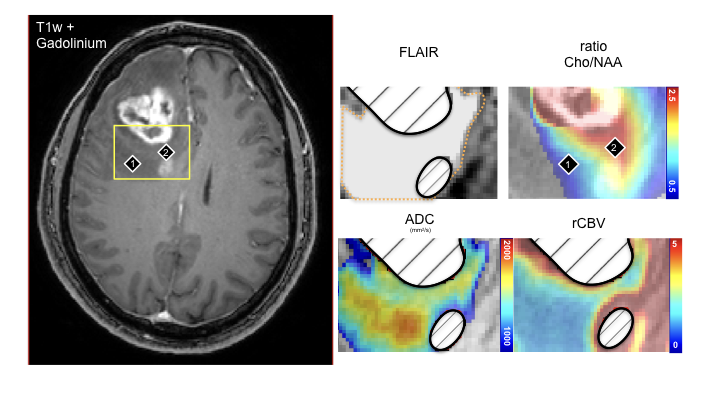
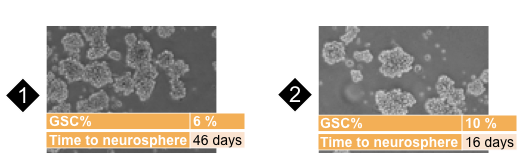
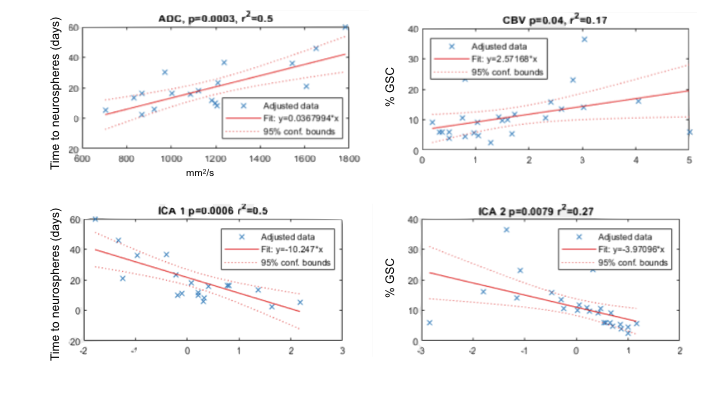
Figure 3: Top. Diffusion MRI (ADC) and perfusion MRI (rCBV) are predictors of the time to form neurosphere (tumor aggressiveness) and the proportion of glioblastoma stem cells (GSC%) respectively. GSC were present in vascular niche. bottom. Using an independent component decomposition of ADC and rCBV into two components (ICA1 and ICA2), the prediction of GSC% is improved significantly (bottom).