2358
Non-gaussian IVIM-DWI for HPV-related oropharyngeal cancer patients who received marked dose de-escalation in chemo-radiotherapy: Intra-treatment imaging response evaluation1Medical Physcis, Memorial Sloan Kettering Cancer Center, New York, NY, United States, 2Radiation Oncology, Memorial Sloan Kettering Cancer Center, New York, NY, United States, 3Radiology, Memorial Sloan Kettering Cancer Center, New York, NY, United States
Synopsis
This study aims to evaluate treatment response in human papillomavirus-related (HPV+) oropharyngeal squamous cell carcinoma using pre- treatment (TX), intra- TX week 1, 2, 3, and post-TX week 4 quantitative imaging metrics derived from non-Gaussian IVIM DWI. ADC and D showed a significant increase between pre- and post-TX week 4 in complete response (CR) group, who were treated with dose de-escalation to 30Gy chemo-radiation therapy.
Introduction
Human papillomavirus-related (HPV+) oropharyngeal squamous cell carcinoma (OPSCC) patients have exhibited better clinical outcome than their HPV-negative counterparts1. Identifying patients with tumors exquisitely responsive to chemo-radiotherapy (chemo-RT) would facilitate next-generation dose de-escalation clinical trials in head and neck (HN) cancer2. Intravoxel incoherent motion (IVIM) diffusion weighted imaging (DWI), which assumes a Gaussian nature of water diffusion, has shown promise to assess treatment response in HN cancer3-5. Heterogeneity of the tumor tissue microstructure restricts and hinders diffusion of water molecules that leans towards non-Gaussian (NG) nature 6,7. The aim of this study was to monitor treatment response using intra-treatment (TX) imaging metrics derived from NG-IVIM DWI for OPSCC patients who received dose de-escalation regime (30 Gy) for the first time rather than standard (70 Gy) chemo-RT.Methods
Patient: Our institutional
review board approved this prospective dose de-escalation clinical trial and written informed consent was obtained from
all eligible HPV (+) OPSCC patients with neck nodal metastasis prior to enrollment Between October 2015 and March
2017, 13 HPV+ OPSCC patients (median age 57 years, 11 male and 2 female) were
enrolled into the study who were treated with dose
de-escalation to 30Gy chemo-RT (during intra-TX weeks 1-3). The patients were categorized into two groups
(i.e., complete response [CR] or non-CR) based on standard-of-care imaging and
clinical follow up, performed 3–6 months after treatment completion.
DWI data acquisition: MRI protocol consisted of multi-planar T1/T2 weighted imaging followed by multi b-value DWI on a 3.0T scanner (Ingenia, Philips Healthcare, Netherlands) using neurovascular phased-array coil. The multi b-value DW images were acquired using a single shot spin echo planar imaging (SS-SE-EPI) sequence with TR/TE=4000/80 (minimum) ms, field of view (FOV)=20-24 cm, matrix=128×128, slices=8-10, slice thickness=5mm, number of excitation (NEX)=2 and b=0,20,50,80,200,300,500,800,1500,2000 s/mm2. A total of 65 DWI datasets were acquired at the pre-TX and intra- TX weeks 1, 2, 3, and post-TX week 48.
DWI data analysis: The data were fitted to (a) mono-exponential model, which calculates apparent diffusion coefficient (ADC), and (b) bi-exponential model (NG-IVIM), which provides estimate of the diffusion coefficient (D), perfusion fraction (f), pseudo diffusion coefficient (D*), and kurtosis coefficient (K) 3,4. Regions of Interest (ROIs) were delineated on the neck nodal metastases by both a radiation oncologist and neuroradiologist on the DW image (b = 0 s/mm2) using ImageJ 9. All DW data analysis was performed using in-house software MRI-QAMPER (Quantitative Analysis Multi-Parametric Evaluation Routines) written in MATLAB (MathWorks, Natick, MA). ROI analysis yielded mean and standard deviation for each coefficient, which were reported for the results. Total tumor volume was calculated from T2w images. The relative percent-change in tumor mean volume and ADC, D, D*, f, and K value between the pre-TX (week 0) and intra-TX weeks (i.e., 1,2,3, and post-TX week 4) were calculated as:
$$z_{wk-0wk}(\%) =\frac{(x_{iwk}-x_{owk})}{x_{owk}}*100$$
Statistical analysis: Wilcoxon-rank sum test was performed to compare mean total tumor volume and ADC, D, D*, f, and K within and between groups during pre-TX and intra-TX weeks ans post-TX week 4. A p-value <0.05 was considered statistically significant. Statistical computations were performed in R10.
Results
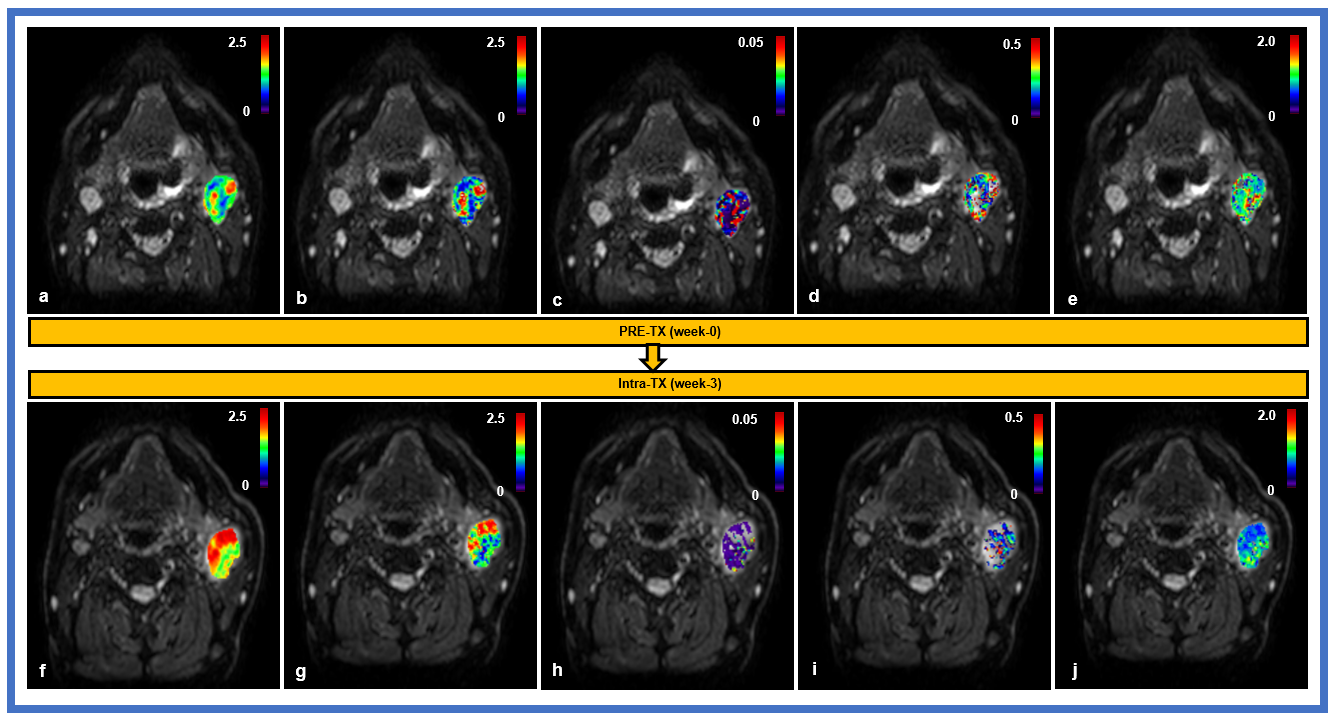
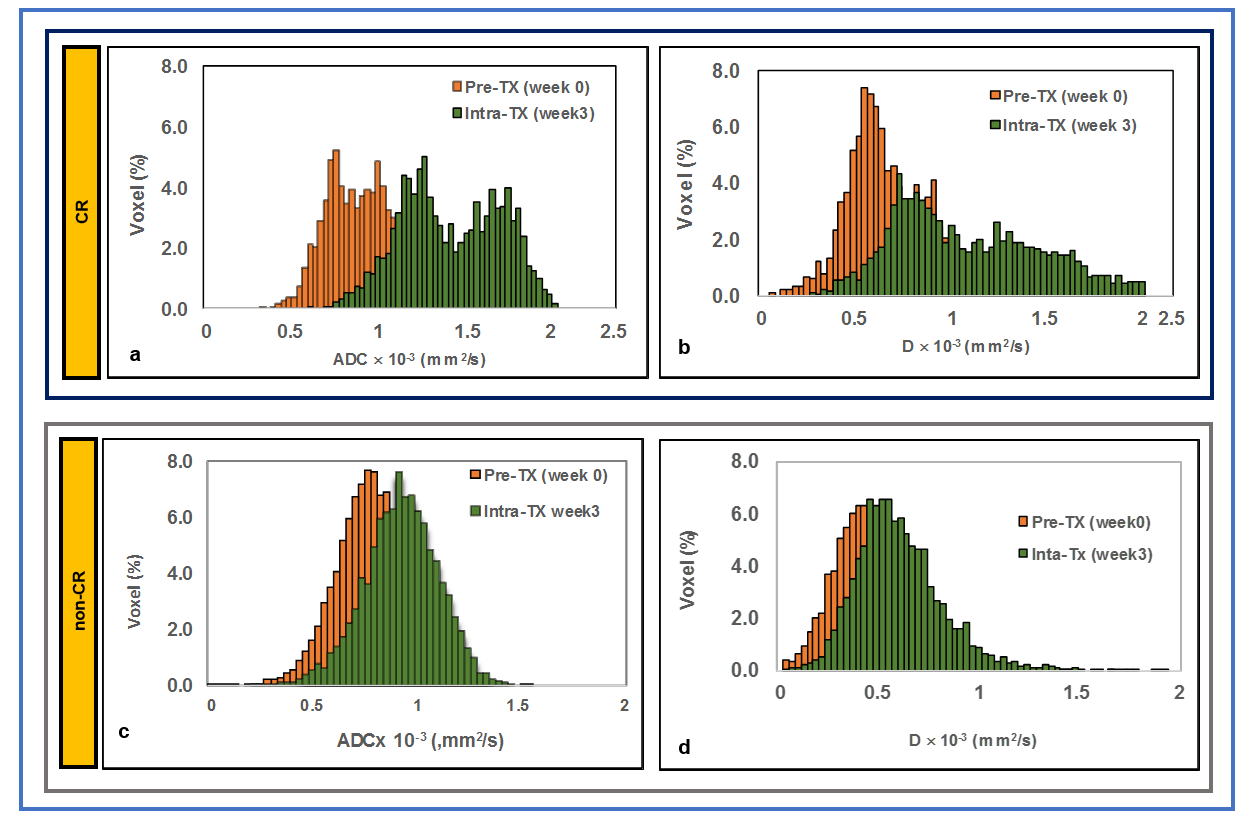
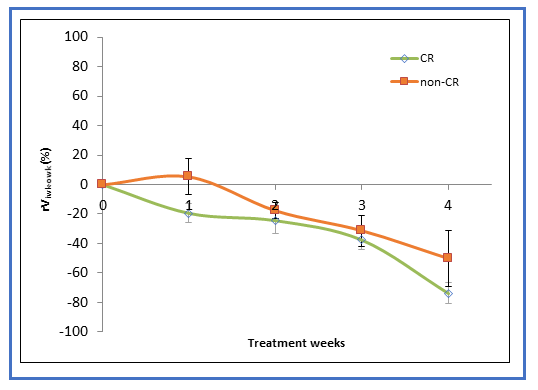
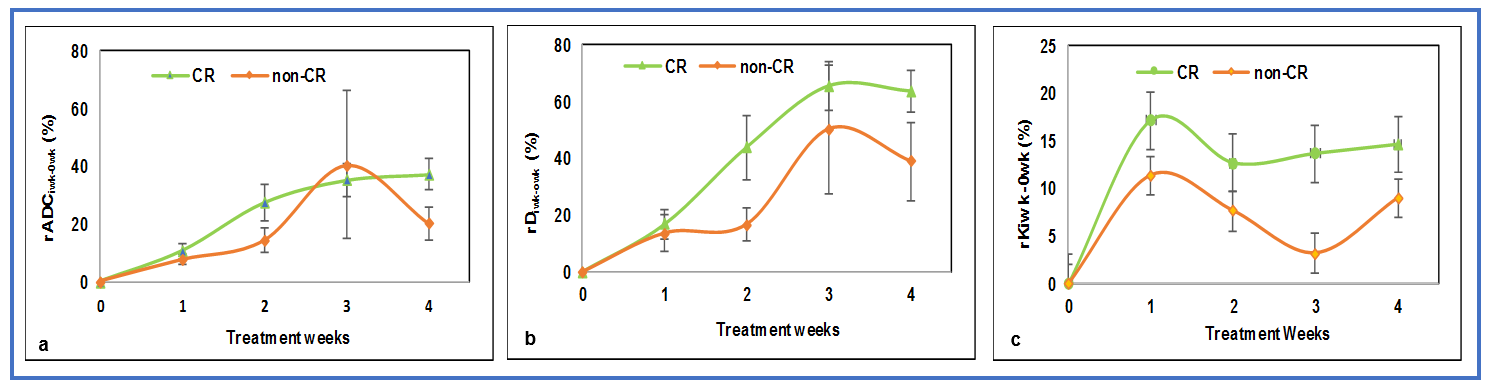
In the present study, 9 patients experienced CR and 4 patients were non-CR after dose de-escalation to 30Gy chemo-RT. Figure 1 displays T2w images and the imaging metric maps at the pre- and intra-TX week 3. Figures 2 (a) and (b) show representative ADC and D histogram plot for CR and non-CR. The mean total tumor volume percentage change (rV4wk-0wk (%)) at post-TX week 4 for CR and non-CR group were 74% and 50%, respectively (Figure 3). The rADC4wk-0wk and rD4wk-0wk were 36% and 67% in CR, whereas in non-CR group the change in the metrics were 20% and 38%, respectively (Figure 4 a and b). CR and non-CR group showed 15% and 9% change in rK4wk-0wk respectively (Figure 4c). Change in exploratory metrics rf4wk-0wk (%) and rD*4wk-0wk (%) were <13% and <1%, respectively in both CR and non-CR groups.Discussion and Conclusion
The study reports for the first-time results from OPSCC patients who were on a dose de-escalation clinical trial. The total tumor volume decreases significantly in the CR group. The linear increase in rDiwk-0wk reflects the cellularity change. A shift towards a higher ADC and/or D value(s) reflect(s) complete response in patients who were treated with dose de-escalation to 30Gy chemo‐RT. K, a surrogate marker for tissue microstructure, indicates the presence of tumor heterogeneity between the groups. NG-IVIM derived metrics may be of tremendous importance in such clinical trials by evaluating intra-treatment response. After appropriate validation in a larger HPV+ OPSCC population, these findings may be useful for dose de-escalation strategies.Acknowledgements
This work was supported by the MSKCC internal IMRAS grant and in part through the NIH/NCI Cancer Center Support Grant: P30 CA008748.References
1. Psyrri A, Rampias T, Vermorken JB. The current and future impact of human papillomavirus on treatment of squamous cell carcinoma of the head and neck. Annals of oncology : official journal of the European Society for Medical Oncology / ESMO. 2014;25(11):2101-2115.
2. O'Sullivan B, Huang SH, Siu LL, et al. Deintensification candidate subgroups in human papillomavirus-related oropharyngeal cancer according to minimal risk of distant metastasis. Journal of clinical oncology : official journal of the American Society of Clinical Oncology. 2013;31(5):543-550.
3. Le Bihan D, Breton E, Lallemand D, Grenier P, Cabanis E, Laval-Jeantet M. MR imaging of intravoxel incoherent motions: application to diffusion and perfusion in neurologic disorders. Radiology. 1986;161(2):401-407.
4. Lu Y, Jansen JF, Mazaheri Y, Stambuk HE, Koutcher JA, Shukla-Dave A. Extension of the intravoxel incoherent motion model to non-gaussian diffusion in head and neck cancer. Journal of magnetic resonance imaging : JMRI. 2012;36(5):1088-1096.
5. Ding Y, Hazle JD, Mohamed AS, et al. Intravoxel incoherent motion imaging kinetics during chemoradiotherapy for human papillomavirus-associated squamous cell carcinoma of the oropharynx: preliminary results from a prospective pilot study. NMR in biomedicine. 2015.
6. Jansen JF, Stambuk HE, Koutcher JA, Shukla-Dave A. Non-gaussian analysis of diffusion-weighted MR imaging in head and neck squamous cell carcinoma: A feasibility study. AJNR American journal of neuroradiology. 2010;31(4):741-748.
7. Jensen JH, Helpern JA. MRI quantification of non-Gaussian water diffusion by kurtosis analysis. NMR in biomedicine. 2010;23(7):698-710.
8. Paudyal R, Oh JH, Riaz N, et al. Intravoxel incoherent motion diffusion-weighted MRI during chemoradiation therapy to characterize and monitor treatment response in human papillomavirus head and neck squamous cell carcinoma. Journal of magnetic resonance imaging : JMRI. 2017;45(4):1013-1023.
9. ImageJ [computer program]. Bethesda, Maryland, USA: U. S. National Institutes of Health; 1997-2016.
10. R: A Language and Environment for Statistical Computing [computer program]. Vienna, Austria: R Foundation for Statistical Computing: URL http://www.R-project.org; 2013.
Figures