2357
Quantitative ADC measurement of breast cancer with ssEPI and reduced FOV diffusion weighted imaging techniques1Imaging Physics, MD Anderson Cancer Center, Houston, TX, United States, 2Diagnostic Radiology, MD Anderson Cancer Center, Houston, TX, United States, 3Breast Medical Oncology, MD Anderson Cancer Center, Houston, TX, United States, 4Cancer Systems Imaging, MD Anderson Cancer Center, Houston, TX, United States
Synopsis
The goal of this study was to assess differences in quantitative ADC of breast cancer between ssEPI and rFOV DWI techniques. The two techniques were used to acquire breast DWI images in 27 patients at three different time points during their neoadjuvant chemotherapy. Tumor ADC from the two techniques at baseline and mid-treatment scans show strong correlation and minimal bias. However, tumor ADC from the two techniques at pre-surgery correlated more moderately and showed a slight bias. The relative and absolute changes in ADC at mid-treatment or pre-surgery from baseline showed only moderately-strong non-parametric correlation between the two techniques.
Introduction
Diffusion weighted imaging (DWI) and quantitative apparent diffusion coefficient (ADC) are reported useful for diagnosis and treatment response assessment in breast cancer1,2. Although more commonly used, single-shot Echo Planar Imaging (ssEPI) based DWI of the breast may suffer from geometric distortion, ghosting, and fat suppression failure due to field inhomogeneity. These limitations can be alleviated with reduced field of view (rFOV) DWI, which achieves a shortened EPI readout through selective excitation for the same spatial resolution3. In this study, we investigate whether and how much the quantitative ADC measurement of breast cancer may be affected by acquiring and analyzing the images using the two different DWI techniques on the same group of patients.Methods
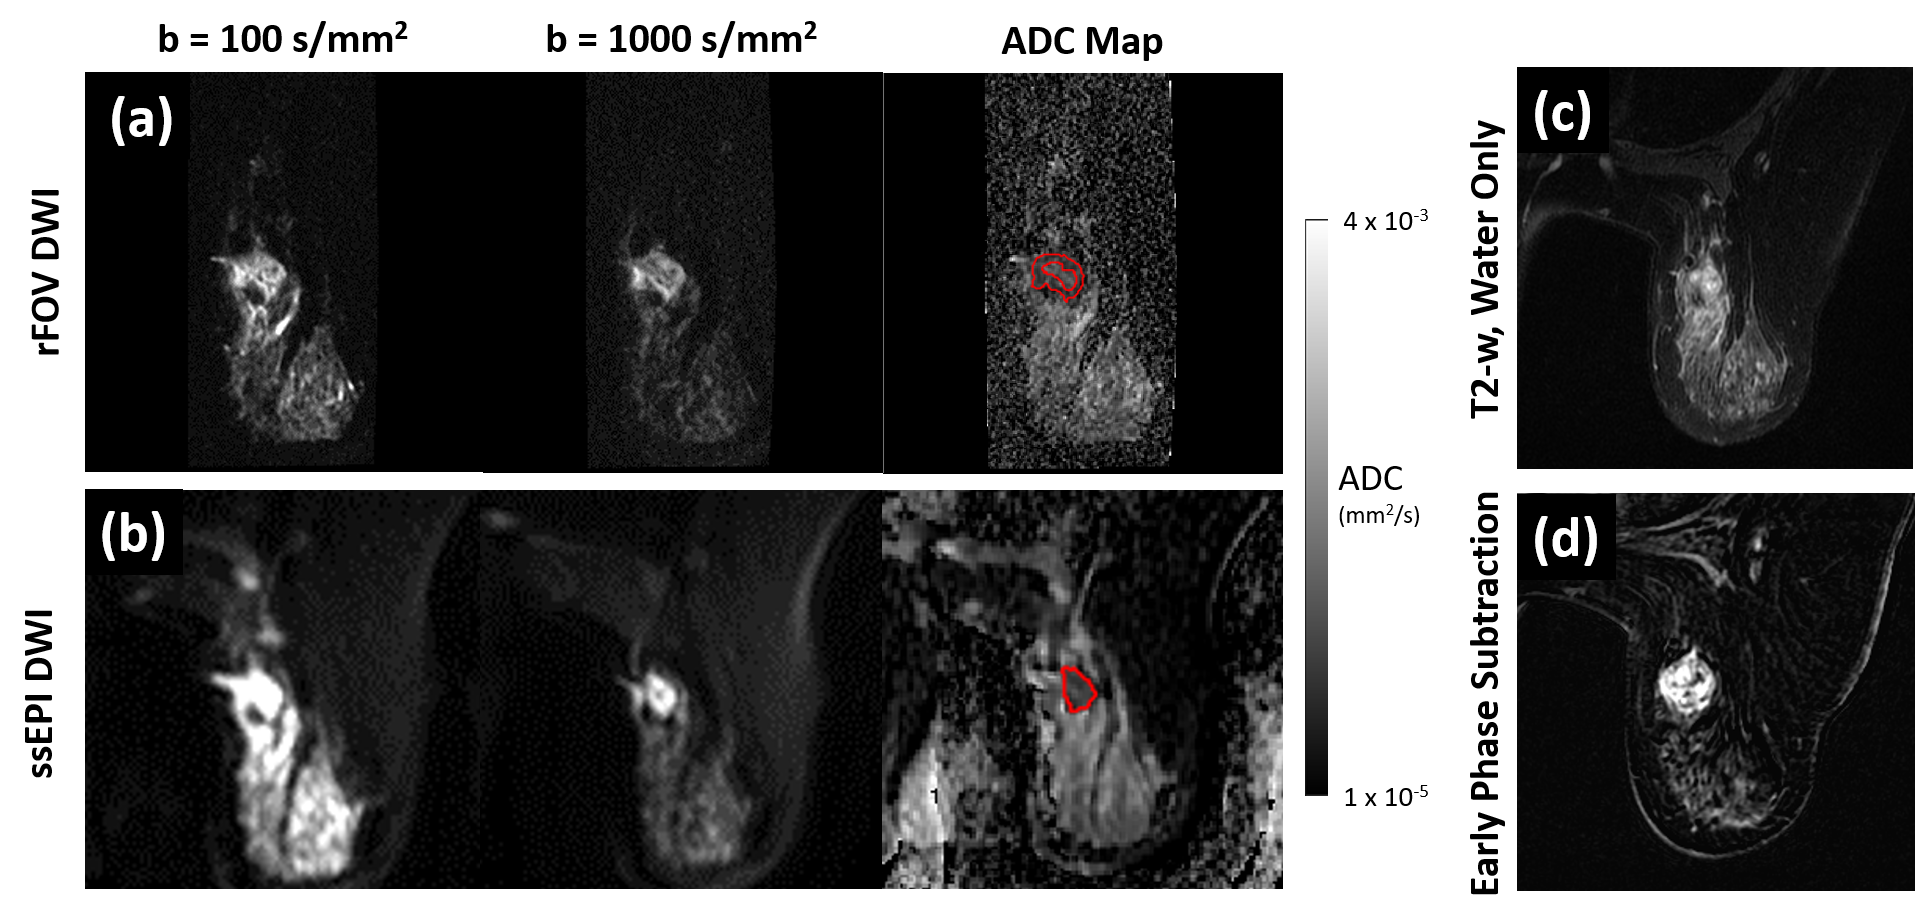
Twenty-seven patients with biopsy-confirmed triple negative breast cancer (TNBC) were included in this IRB approved study. Patients underwent three MRI exams before and along the course of their neoadjuvant chemotherapy (NAC): at baseline (BL) before NAC, at mid-treatment (MT) after completion of four cycles of NAC, and before surgery (preS) after completion of NAC. All MR exams were performed on a single 3.0 T GE MR750w scanner and included anatomic T2w scans, gadolinium contrast enhanced (CE) scans, and two axial DWI scans: ssEPI DWI (Fig. 1a) and rFOV DWI (Fig. 1b). The typical scan parameters for ssEPI DWI were: b-values=100,1000s/mm2,FOV=30x30cm, slice thickness=5mm, TR/TE=5000/70ms, matrix=128x192. The typical scan parameters for rFOV DWI were: b-values=100,1000s/mm2, FOV=16x8cm, slice thickness=4.0mm, TR/TE=5000/75.3ms, matrix=160x80.
ADC maps were generated using a mono-exponential model. Tumor contouring was performed by an experienced radiologist using an in-house GUI-based software. Lesions were first identified using CE images and the entire volume of the tumor was contoured on b=1000 s/mm2 images. Necrotic areas, peritumoral edema and biopsy clip artifact were excluded from contours based on CE images. After contouring, mean ADC of the tumor volume was extracted. Relative and absolute changes in mean ADC relative to the BL exam were calculated for MT and preS exams.
Mean ADC from BL, MT and preS exams were compared between ssEPI and rFOV DWI scans using Pearson’s correlation. Additionally, correlations were examined using linear least-squares (LLS) fitting to assess possible bias in ADC measurements between scan techniques. Correlation of relative and absolute changes in mean volume ADC between the two techniques was assessed using non-parametric Spearman’s correlation.
Results
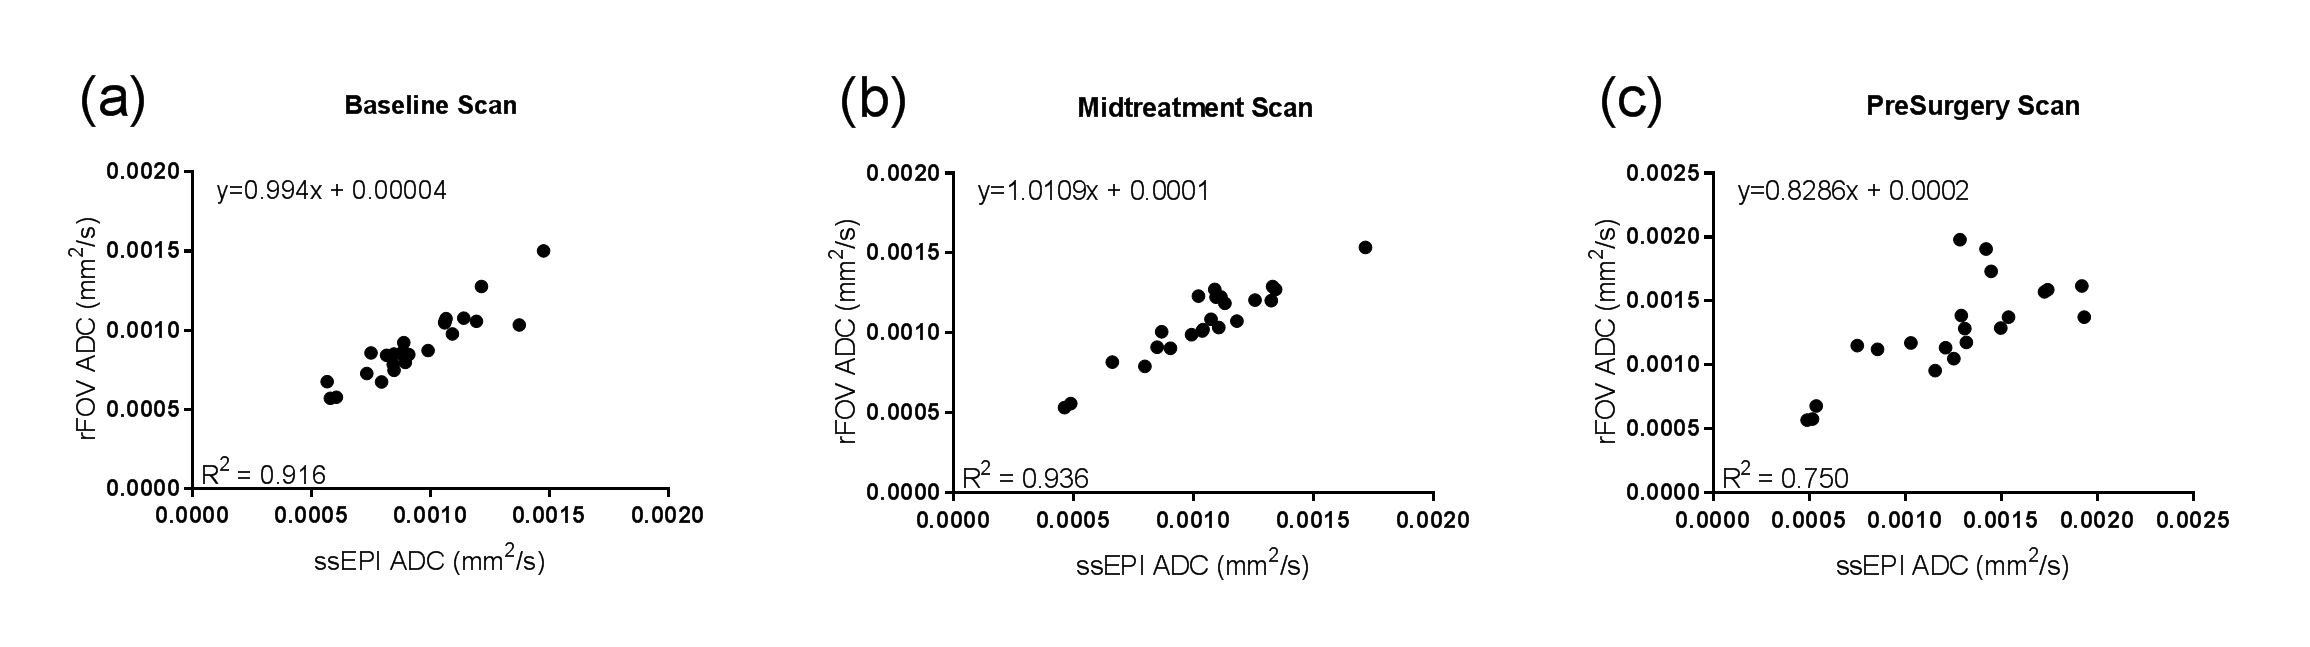
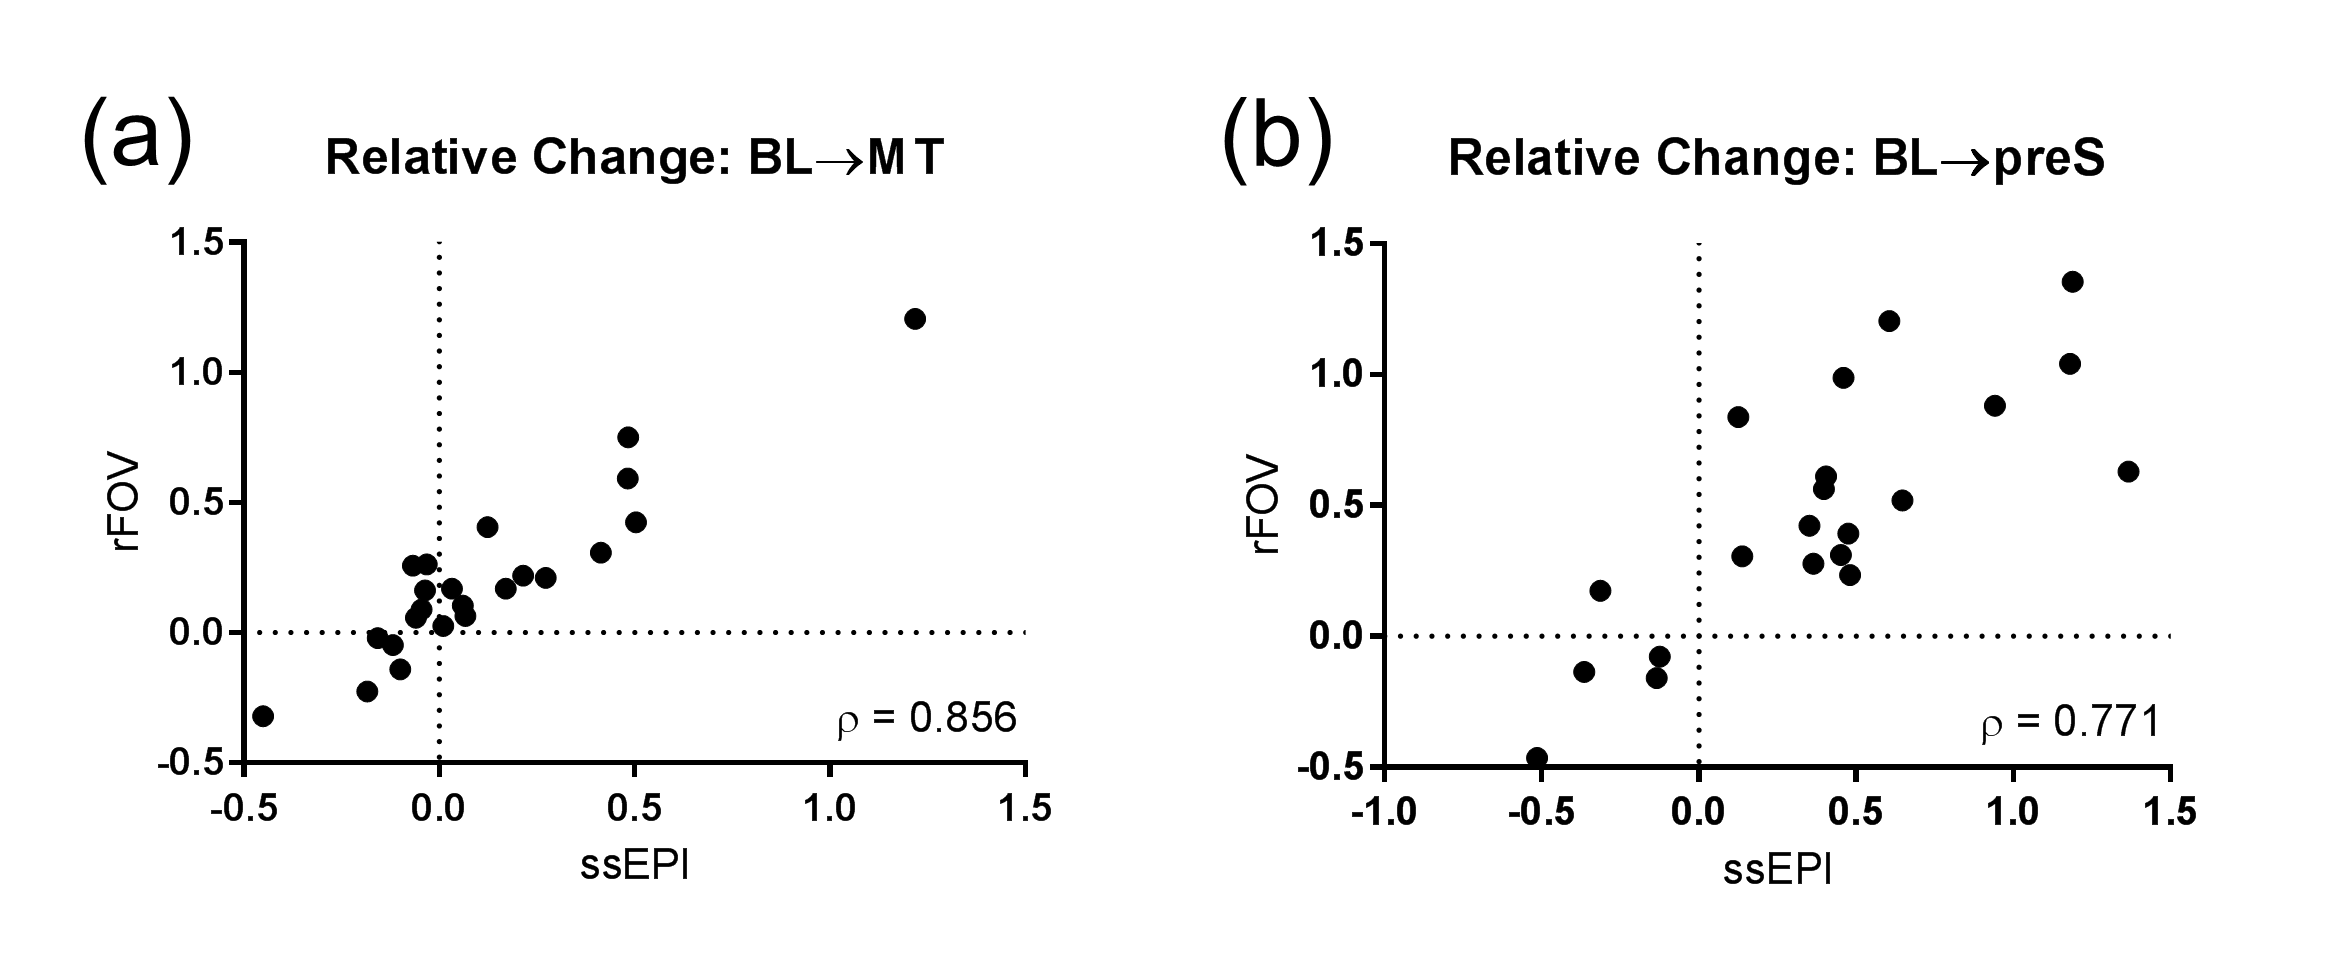
Mean ADC from ssEPI and rFOV DWI scans were very highly correlated at BL (Fig. 2a) and MT (Fig. 2b) scans but more moderately correlated at the preS scan (Fig. 2c), (Pearson R2 = 0.92, 0.96, 0.75, respectively). LLS fitting showed that rFOV DWI measured mean ADC with a slight bias as compared to ssEPI DWI, although the slope varies across scans (slope = 0.99, 1.0, 0.83 for BL, MT, and preS exams, respectively). Relative changes in ADC measurements were more moderately correlated between ssEPI and rFOV scans (Spearman’s ρ = 0.86, 0.77 for MT/BL in Fig. 3a and preS/BL in Fig. 3b, respectively). Absolute changes in ADC were also more moderately correlated between ssEPI and rFOV scans (Spearman’s ρ = 0.84, 0.75 for MT/BL and preS/BL, respectively).Discussion
Quantitative tumor ADC showed very high correlation between ssEPI and rFOV DWI at the BL and MT exams but only a moderately-high correlation at the preS exam. A bias between techniques was noted at the preS exam. The quantitative ADC changes between the different time points showed only moderately-high non-parametric correlation between the two techniques. Therefore, our results indicate that applications using quantitative ADC measurement of breast cancer need to take into account the technique used for acquisition. It is possible that one technique may provide a better indicator for assessing treatment response than the other. These findings are important and warrant further investigation and validation.Acknowledgements
No acknowledgement found.References
1. Zhang L, Tang M, Min Z, Lu J, Lei X, Zhang X. Accuracy of combined dynamic contrast-enhanced magnetic resonance imaging and diffusion-weighted imaging for breast cancer detection: a meta-analysis. Acta radiologica (Stockholm, Sweden : 1987). 2016;57(6):651-660.
2. Partridge SC, Zhang Z, Newitt DC, et al. Diffusion-weighted MRI findings predict pathologic response in neoadjuvant treatment of breast cancer: the ACRIN 6698 multicenter trial. Radiology. 2018:180273.
3. Saritas EU, Cunningham CH, Lee JH, Han ET, Nishimura DG. DWI of the spinal cord with reduced FOV single-shot EPI. Magnetic resonance in medicine. 2008;60(2):468-473.
Figures