2352
Evaluating the effectiveness of preload in mitigating the leakage effect of dynamic contrast susceptibility MRIXin Li1, Seymur Gahramanov2, Ramon F Barajas3, and Edward A Neuwelt4
1Advanced Imaging Research Center, Oregon Health & Science University, Portland, OR, United States, 2Department of Neurosurgery, University of New Mexico, Albuquerque, NM, United States, 3Diagnostic Radiology, Oregon Health & Science University, Portland, OR, United States, 4Neurology, Oregon Health & Science University, Portland, OR, United States
Synopsis
Dynamic Susceptibility Contrast (DSC) Magnetic Resonance Imaging (MRI) with low molecular weight Gadolinium based contrast agent (GBCA) is often confounded by GBCA’s leakage into intersitium space. Thus, pre-DSC injection of GBCA (preload) is often used to mitigate the underestimation of relative cerebral blood volume (rCBV) due to the leakage of GBCA. Here, we present results to demonstrate that preload is generally effective. However, small dose effect could still be expected in the process.
Purpose
Though widely adopted for brain perfusion measurement, Dynamic Susceptibility Contrast (DSC) MRI with low molecular weight gadolinium based contrast agent (GBCA) is often confounded by GBCA’s leakage into interstitium space. An additional pre-DSC injection of GBCA (preload) is often used to mitigate the underestimation of relative cerebral blood volume (rCBV) due to GBCA leakage. Here, we use a linearization approach to uniquely quantify GBCA leakage rate constant and show that the preload practice is generally effective in mitigating the leakage effect in DSC with GBCA.Method
Eight female athymic nude rats (weight, 200–240 g) were anesthetized with intraperitoneal injection of ketamine (60 mg/kg) and diazepam (7.5 mg/kg) for stereotactic inoculation of U87MG cells. MRIs were performed 13 days after tumor implantation. DSC images were acquired with a gradient-echo sequence using the following parameters: TR/TE/FA, 31 ms/5.0 ms/6°; 3.2 x 3.2 cm2 field of view, 128 x 128 matrix, and three contiguous 1-mm-thick sections. After an initial 30-second baseline acquisition, 60 μL bolus of gadodiamide (Omniscan) was injected (3 mL/min) via a tail vein catheter with an infusion pump, followed by 240 μL saline flush. Three consecutive DSC MRI acquisitions were performed with ~ 5 minutes between two adjacent runs. Each previous GBCA injection thus served as a preload for the subsequent DSC scan. We term the first DSC-MRI without GBCA preload as “no-preload”, the second DSC as “single-dose preload”, and the third as “double-dose preload”. Based on the simple assumption that the extravasating and intravascular GBCA introduced R2* change can be linearly combined,1,2 the pixel ΔR2* time-course is given in Eq. (1), $$\triangle R_2^*(t)=K_{1} \cdot\triangle\overline{R_2^*(t)} - K_{2}\int_{0}^{t}\triangle\overline{R_2^*(t')} dt'\ (1) $$ where ΔR2* represents the pixel time-course for R2* change, K1 and K2 are proportional constants for intravascular and extravasating contributions to ΔR2*, respectively. $$$ \triangle\overline{R_2^*} $$$ approximates relative blood R2* change by combining signal changes from all non-leaking brain tissue pixels.2 Using a method3,4 similar to Gjedde-Patlak linearization,4,5 we divide Eq. (1) by $$$\triangle\overline{R_2^*(t)}$$$ then graph the transformed right-hand-side term vs. that associated to the K2 term (see Fig. 2 labels for expressions). If a linear portion exists in the graph, we can identify a leakage rate constant, KL, as the slope of that segment. Similar to that of Gjedde-Patlak plot, KL is only calculated from the linear portion after the transformation.Results
Fig. 1a shows the three normalized DSC signal time-courses for one animal. Only the “no-preload” time-course (red) shows the apparent leakage effect with a portion of post-GBCA signal increases above baseline. In 1b, color-matched ΔR2* time-courses were plotted for the 1a signals. Only the no-preload ΔR2* time-course falls below zero. 1b inset shows a post-GBCA DSC image. Fig. 2 plots results after the linearization (symbols) of a different animal, and their respective linear regression lines. The magnitude of the leakage rate constant (KL) is much larger without preload, while differences for the ones with preloads are generally much smaller and closer to zero. Fig. 3. summarizes the lesion ROI KL values from all animals. The leakage rate is much greater than zero without preload. On the other hand, neither of the mean KL value for s. d. or d. d. preload is significantly different from zero with p-values of 0.41 and 0.075, respectively.Discussion
Using a linearization approach similar to the Gjedde-Patlak linearization, a unique pseudo first-order leakage rate constant, KL, is defined for DSC with GBCA. Therefore, the KL approach can provide a systematic way in investigating the effectiveness of the preload method in mitigating the leakage effect in DSC rCBV quantification. The results here show that the mean KL values from eight animals are not significantly differ from zero, underscoring the generally effective preload approach. Still, with a p-value from the double dose preload at only 0.075, it is likely that injection timing and preload dose still could play a non-negligible role in the overall rCBV quantification.Acknowledgements
Grant Support: R01- NS33618, R01-NS34608, and the Walter S. and Lucienne Driskill Foundation.References
1. Weisskoff et al. Proc. Int. Soc. Magn. Reson. Med. 2, 279 (1994). 2. Boxerman, Schmainda, Weisskoff, AJNR Am. J. Neuroradiol. 27, 859-867 (2006). 3. Li, Varallyay, Gahramonov, Rooney, and Neuwelt, Proc. Intl. Soc. Mag. Reson. Med. 22, 0724 (2014). 4. Li, Varallyay, Gahramanov, Fu, Rooney, Neuwelt, NMR Biomed. 30, 1-9 (2017). 5. Gjedde, J. Neurochem. 36,1463-1471 (1981). 6. Patlak, Blasberg, Fenstermacher, J. Cereb. Blood Flow Metab. 3, 1-7 (1983).Figures
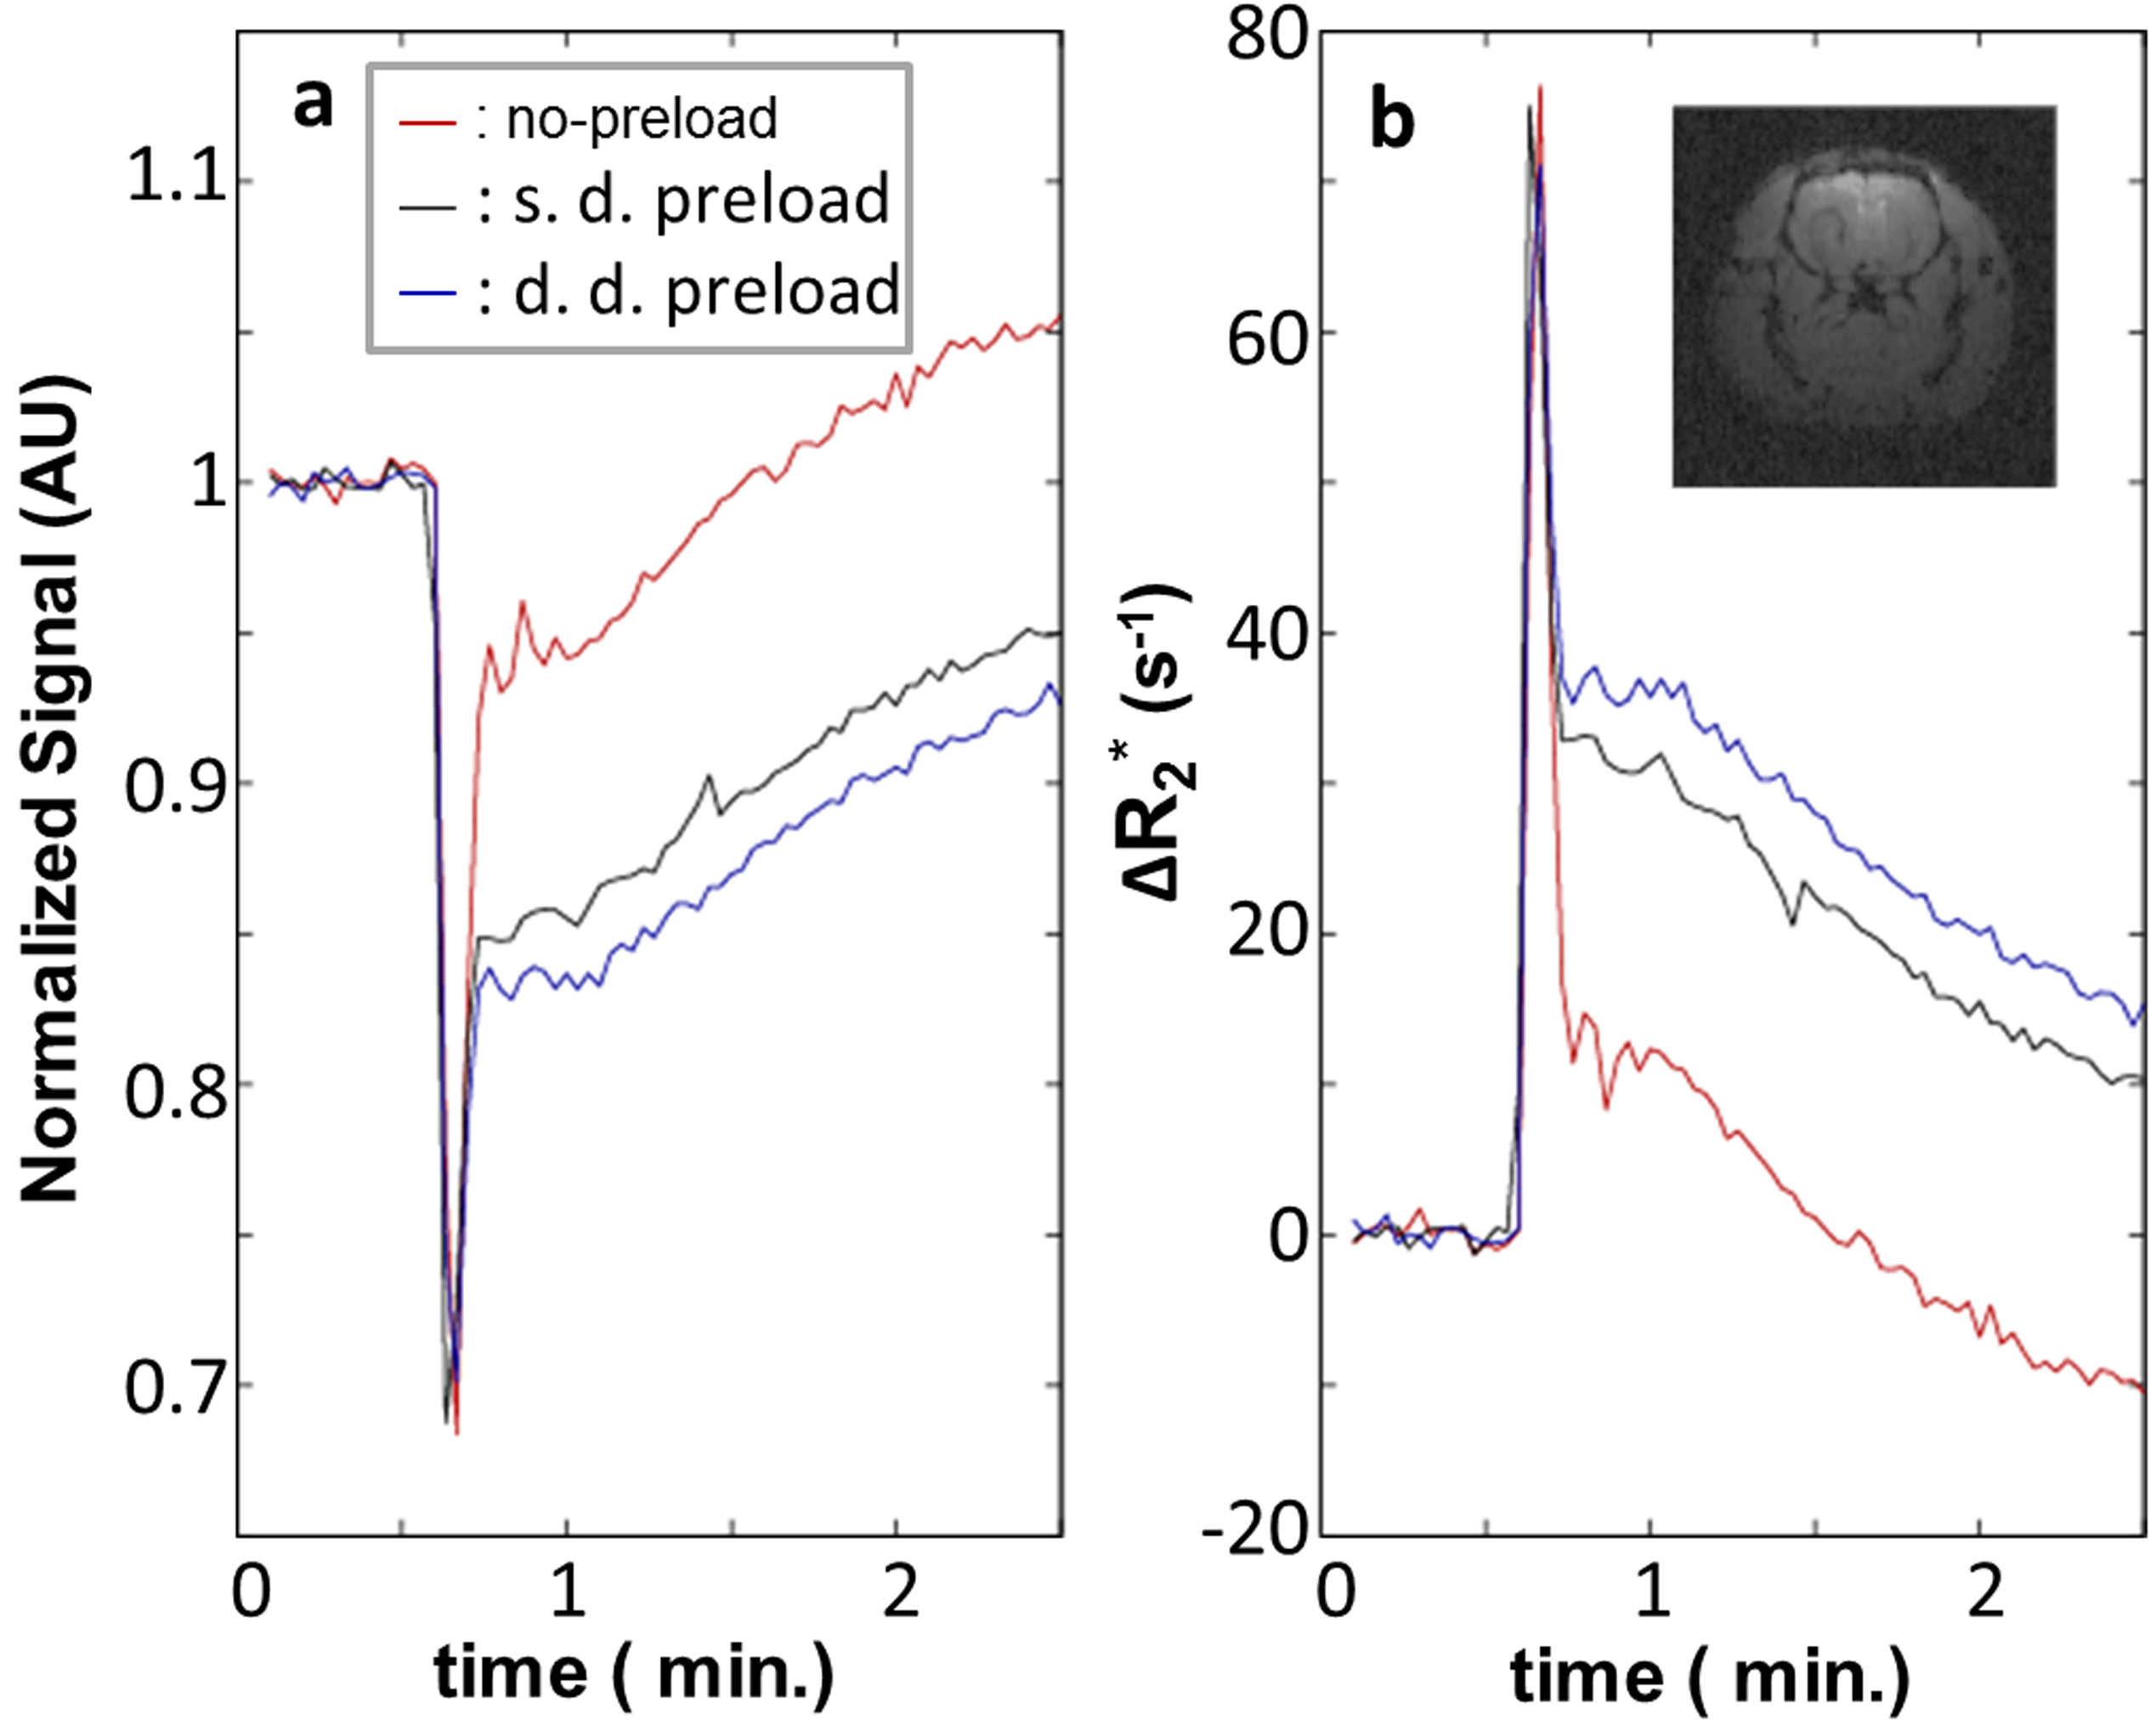
Figure 1. a shows normalized DSC signal time-courses
for no-preload (red), single dose preload (dark gray), and double dose preload
(blue) from a small tumor region of interest (ROI). b,
color-matched ΔR2* time-courses were plotted for the
signals shown in a. Inset shows a post-CR DSC image.
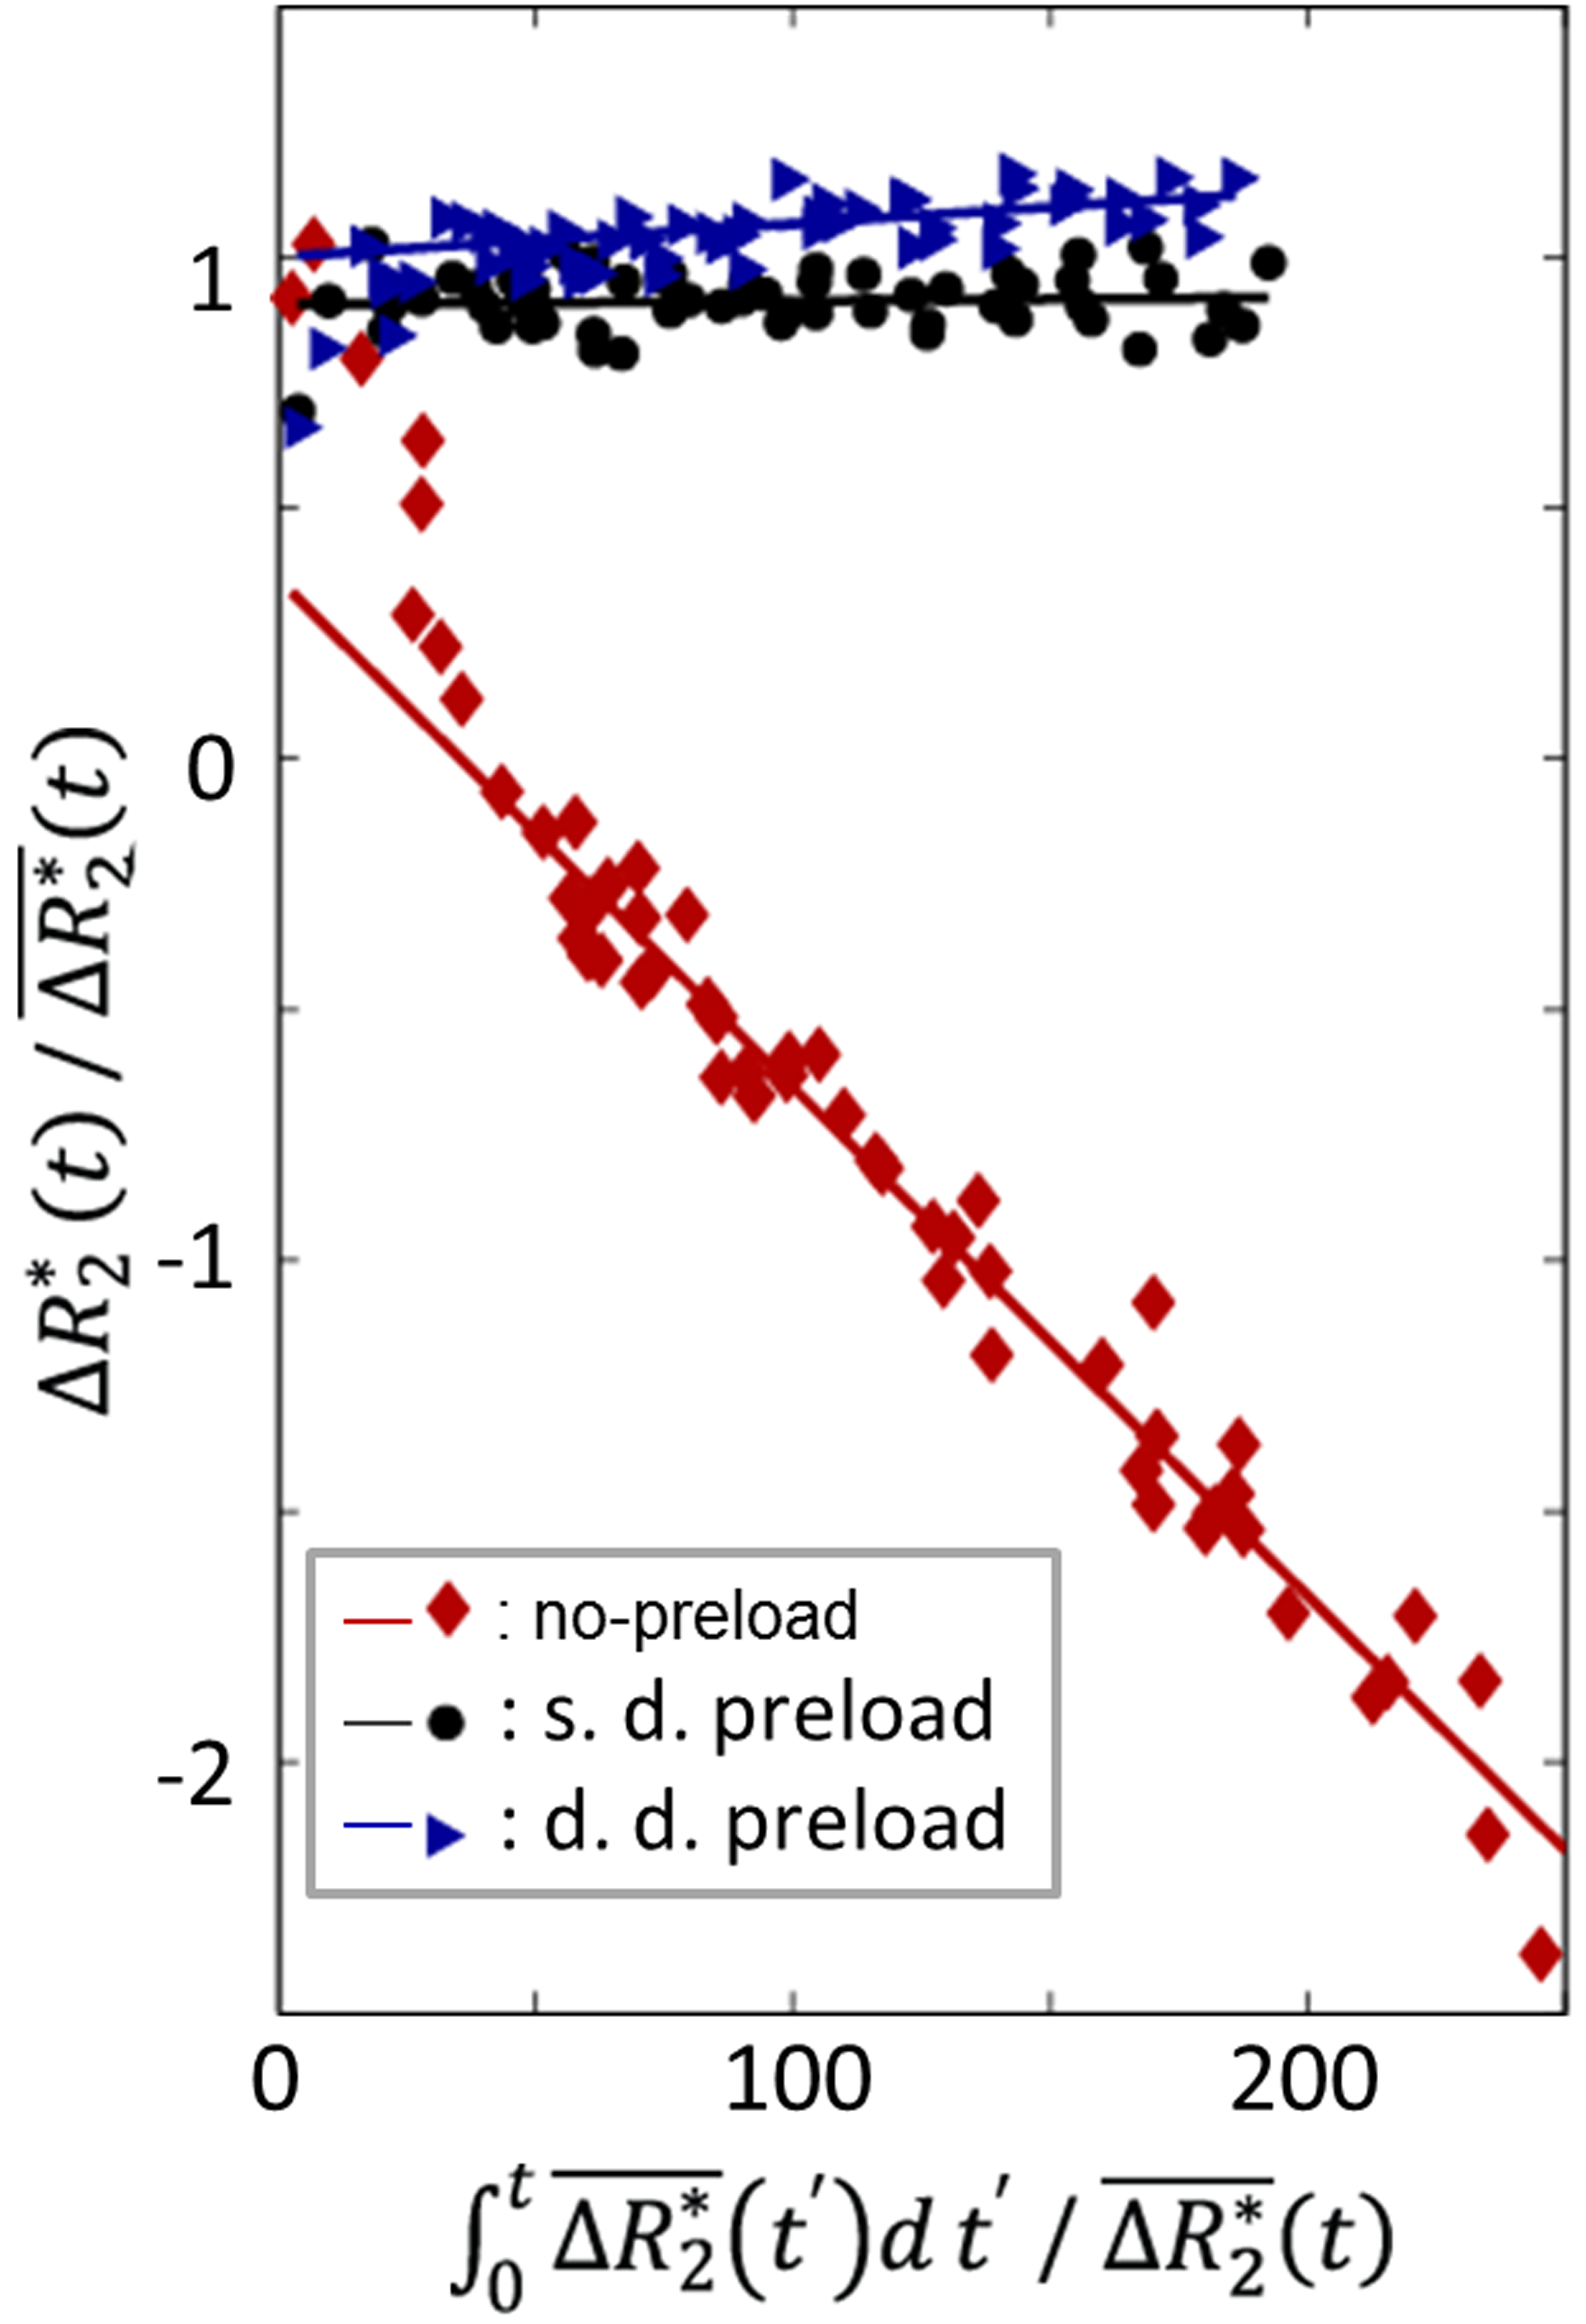
Figure 2. Results after the linearization transform (symbols) of a different animal, and
their respective linear regression lines are plotted. Compared to those derived from with
preload, the magnitude of the leakage rate constant (KL) is much
larger without preload. Differences among the ones with preloads are generally
much smaller and close to zero.
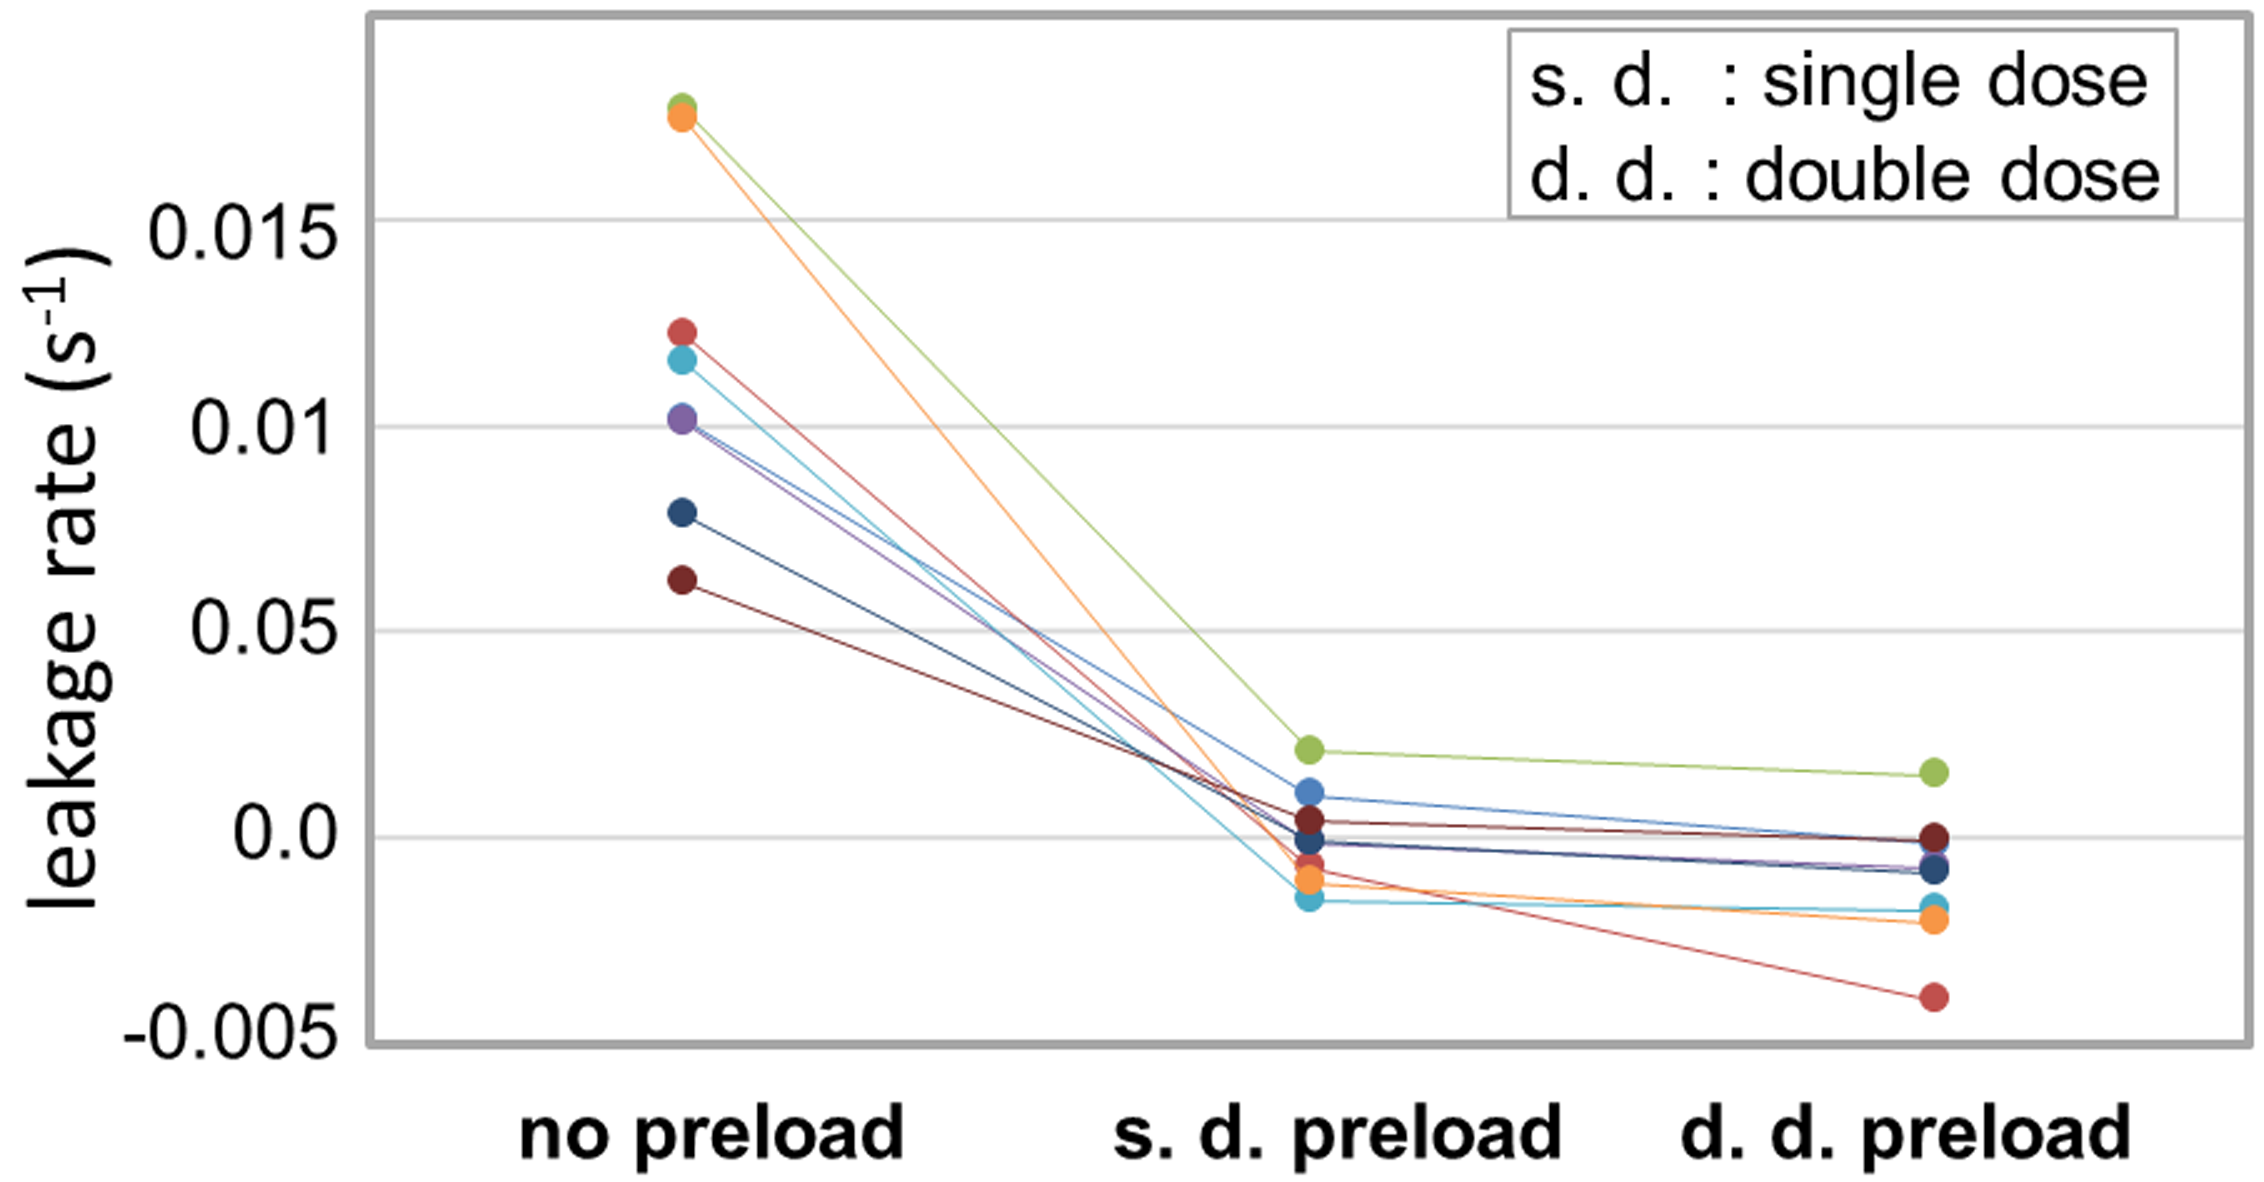
Figure 3. The lesion ROI KL values from all animals are summarized. The leakage rate is much
great without preload. The s. d. and d. d. preload values are similar, with a potential small downward trend from s. d. preload to d. d. preload. But neither of the mean KL value for
s. d. or d. d. preload is significantly different from zero.