2351
IDH Genotypes Differentiation in Glioblastomas Using DWI and DSC-PWI in the Enhancing and Peri-Enhancing Region1Department of Radiology, First Affiliated Hospital of Fujian Medical University, Fuzhou, Fujian, China, 2Scientific Marketing, SIEMENS Healthcare, Diagnostic Imaging, Shanghai, China
Synopsis
The purpose of this study is to evaluate the contribution of DWI and DSC-PWI in the peri-enhancing region for discriminating glioblastomas IDH genotypes. Further, the diagnostic value of this two MR techniques were compared with those in the enhancing portion. Features of conventional MRI, rADCmin-t, rADCmin-p, rCBVmax-t and rCBVmax-p were compared between IDH-m and IDH-w glioblastomas. IDH-mutated glioblastomas tended to present in frontal lobes and younger patients. Both rCBVmax-t and rCBVmax-p show significant difference between two subgroups, while rADCmin-t and rADCmin-p do not. The results showed that the accuracy of rCBVmax-p is higher than that of rCBVmax-t in the diagnosis of IDH-m glioblastomas. rCBVmax-p may have a better diagnostic value than rCBVmax-t in predicting IDH glioblastomas genotypes.
Introduction
Glioblastomas (GBMs) are the most common primary malignant brain tumors with grim prognosis in adults. The IDH gene status plays a crucial role in treatment of the patients with GBMs (1). MRI have been widely used for gliomas grading and genotyping (2, 3). The purpose of this study was to evaluate the contribution of DWI and DSC-PWI in the peri-enhancing region for discriminating glioblastomas IDH genotypes, and the diagnostic value when compared with those in the enhancing portion.Method
Based on the inclusion criteria (a. histopathologic diagnosis of GBMs, b. a known IDH status, c. pre-operative conventional MRI, DWI and DSC-PWI), 75 cases (10 cases of IDH-m GBMs and 65 cases of IDH-w GBMs) were enrolled. MR imaging examinations were performed on a 3T MR scanner (MAGNETOM Verio and Skyra, Siemens Healthcare, Erlangen, Germany). DWI was performed with a spin-echo echo-planar imaging sequence. The imaging parameters were as follows: TR/TE = 8200/102 ms, NEX = 2, FOV = 220 ×220, matrix = 192×192, b-values = 0 and 1000 s/mm2. ADC map was inline calculated by the MR imaging system. DSC-PWI was conducted with a gradient-recalled T2*-weighted echo-planar imaging sequence. The imaging parameters were as follows: TR/TE = 1000–1250/54 ms, flip angle = 35°, NEX = 1, FOV = 220×220, matrix = 128×128. Gadobenate dimeglumine (0.1 mmol/kg) was injected intravenously at a rate of 5 mL/s.
Tumors were assessed in terms of location, tumor size, single or multiple/satellite, contrast enhancement pattern, necrosis, cyst degeneration, hemorrhage, tumor border, edema, and mid-line shift.
For the evaluation of DWI data, ADC values were measured by placing regions of interests (ROIs) on the ADC maps. First, at least five non-overlapping ROIs (size > 10 mm2) were placed inside the tumor, and the minimum ADC values (ADCmin-t) were taken into consideration. The locations of selected ROIs were determined from the enhancing solid portion of the lesion (identified on the contrast-enhanced T1W image), avoiding hemorrhagic, cystic, necrotic parts, and large vessels. Second, 5 ROIs were placed inside the peri-enhancing region (defined as peritumoral non-enhancing region with FLAIR hyperintensity, <1cm), and the minimum ADC (ADCmin-p) was also recorded. Third, relative ADC (rADC) was determined as the ratio of the minimum ADC divided by the reference ADC in the contralateral normal-appearing white matter (CNWM). Both the relative ADCmin-t (rADCmin-t) and the relative ADCmin-p (rADCmin-p) were calculated.
Maps of CBV were obtained by applying a single-compartment model and an automated arterial input function. Measurement of rCBV was performed with the same method used for ADC measurement. The relative maximum rCBV in the enhancing portion (rCBVmax-t) and peri-enhancing area (rCBVmax-p) were recorded.
Results
The mean age of the IDH-w patients was significantly higher than that of the IDH-m patients (P = 0.008). Patients with IDH-m GBMs tended to present in the frontal lobes in this study. However, IDH mutational status did not correlate with other conventional MRI features.
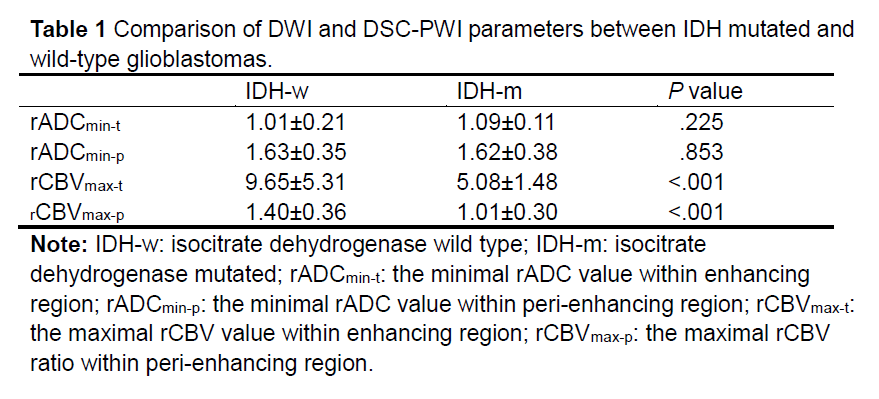
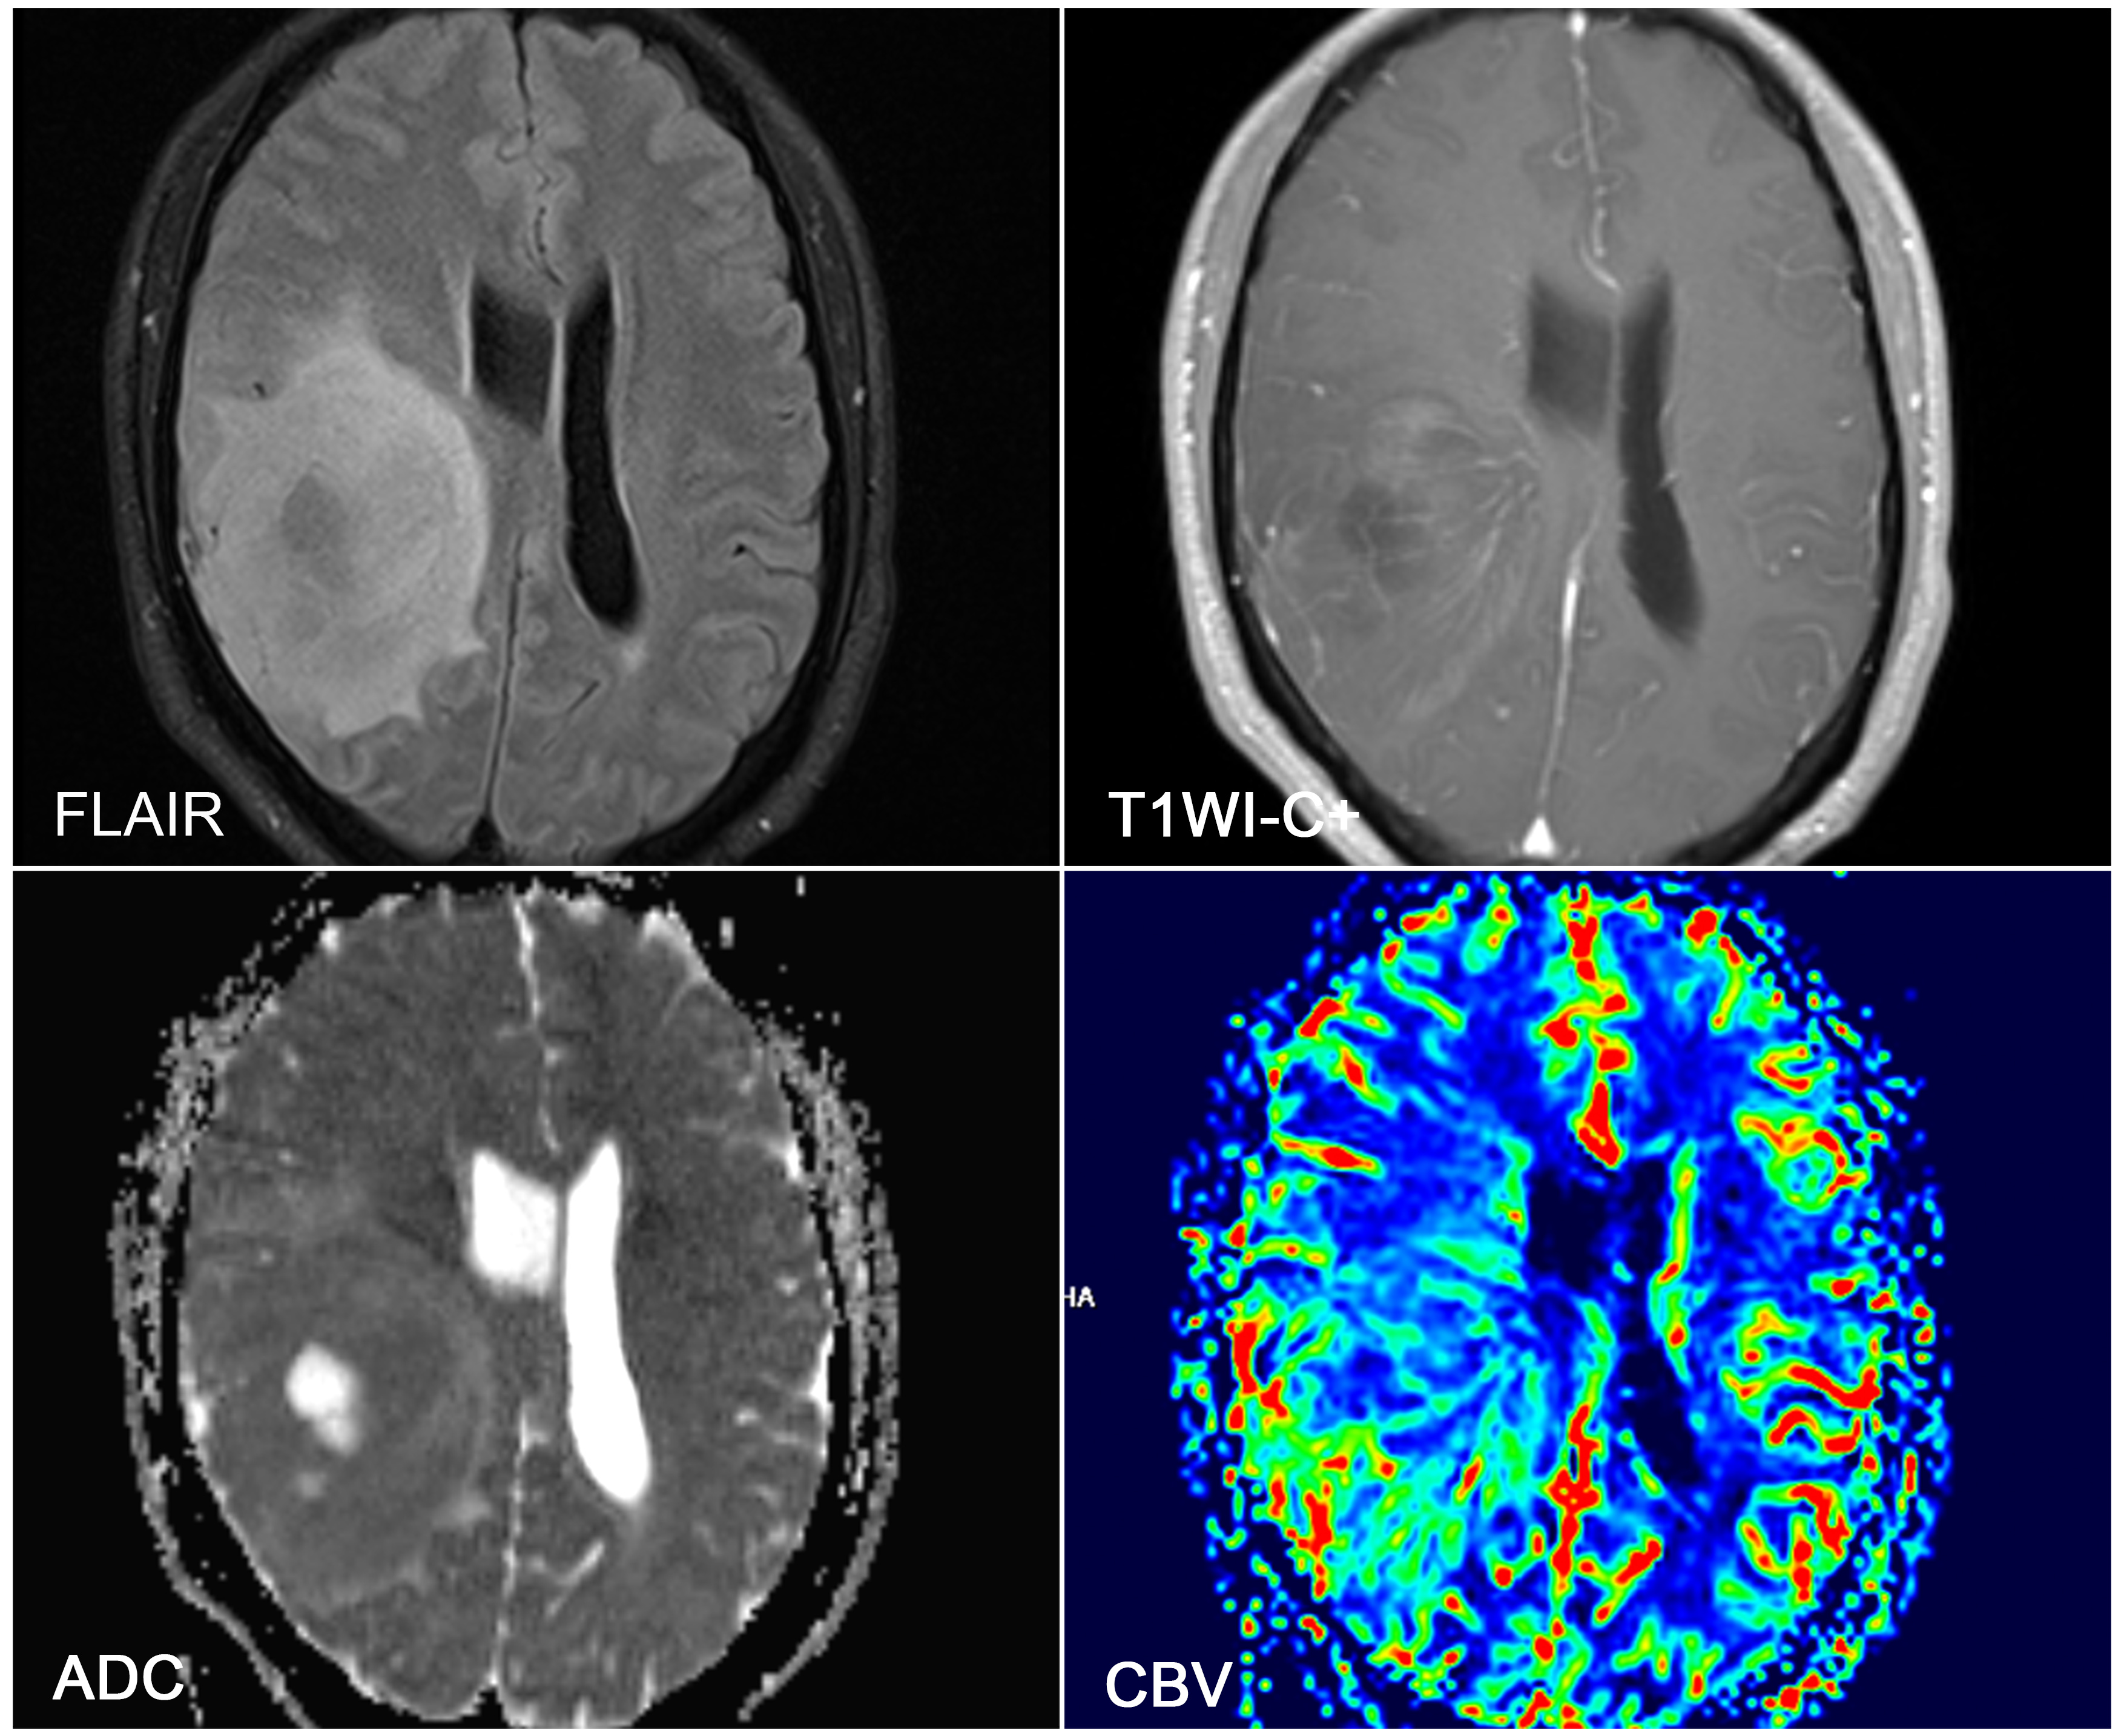
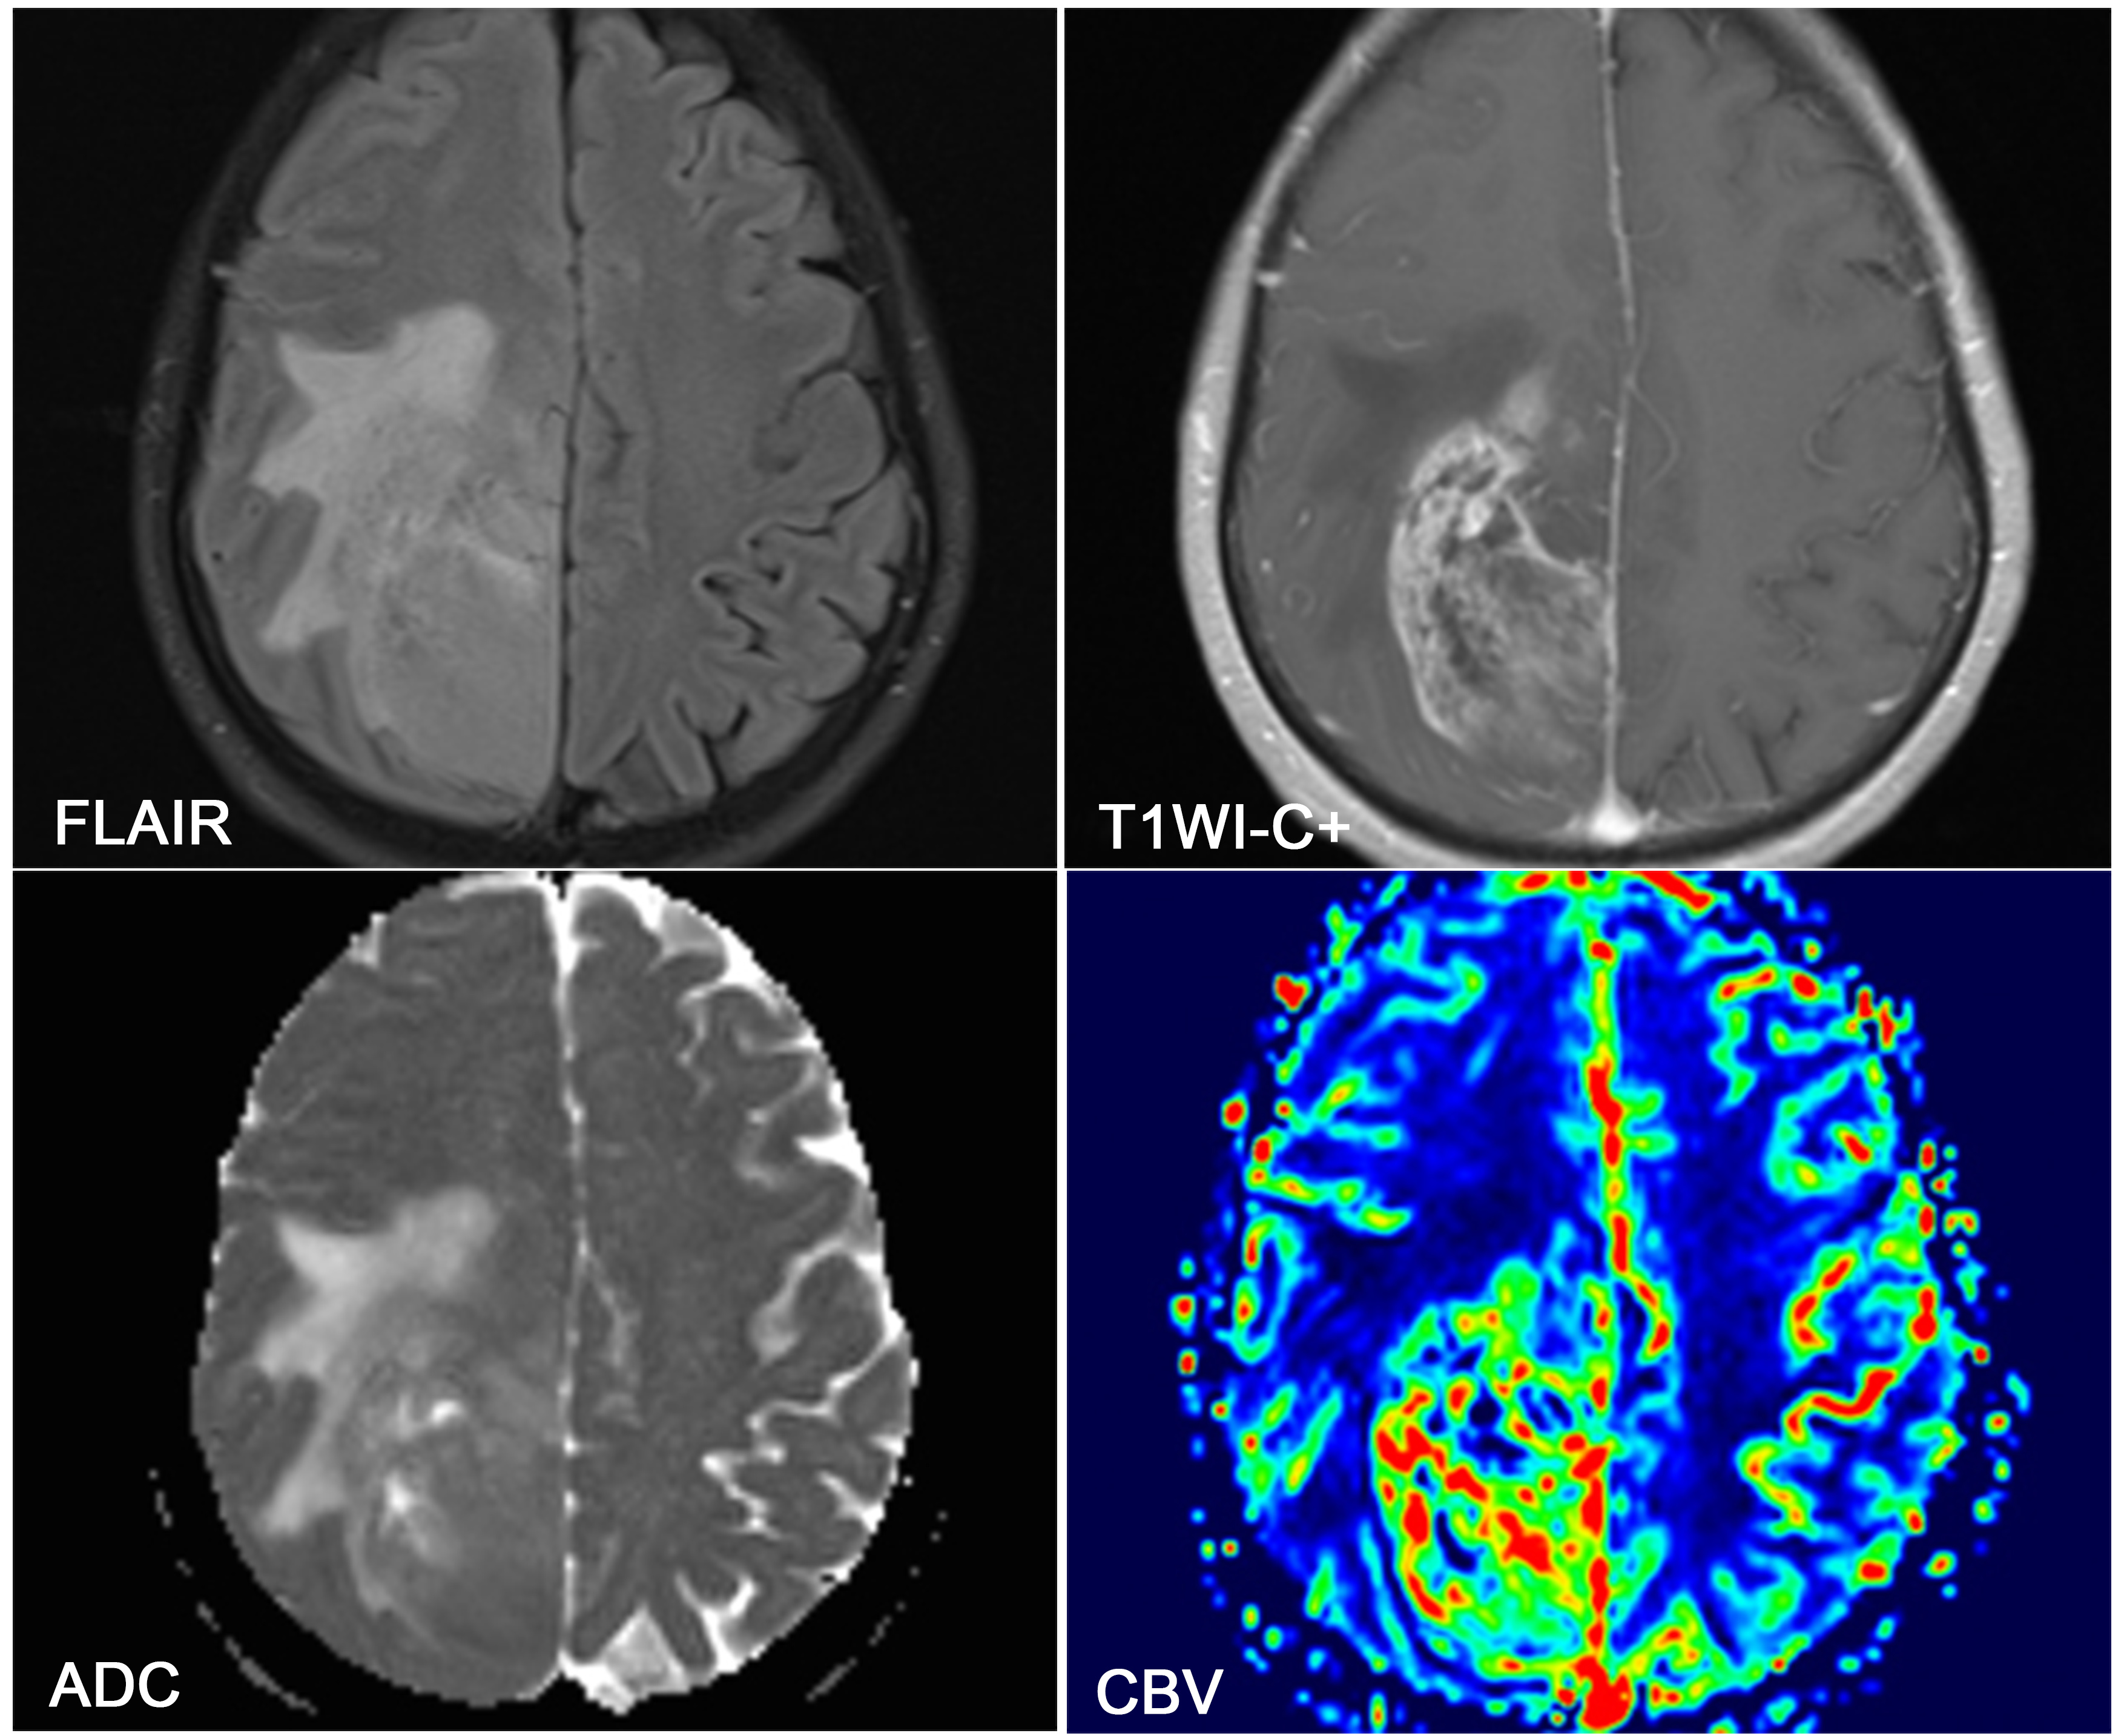
The rADCmin-t, rADCmin-p, rCBVmax-t and rCBVmax-p ratios with respect to different IDH mutational status are given in Table 1, Figures 1 and 2. Both rCBVmax-t and rCBVmax-p were significantly higher in patients with IDH-w GBMs than those with IDH-m GBMs. However, neither rADCmin-t nor rADCmin-p showed a significant difference between IDH-m and IDH-w GBMs.
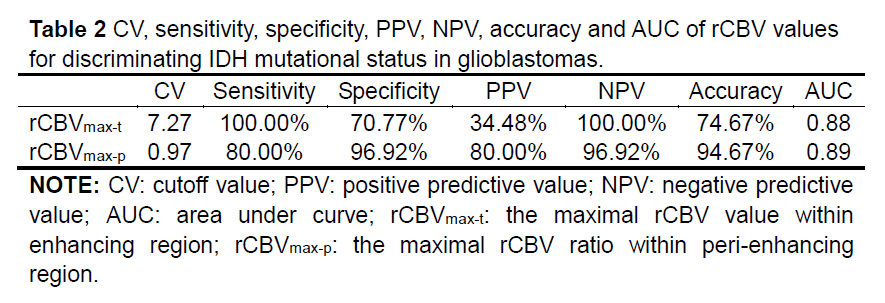
The results of ROC analysis are shown in Table 2. Both rCBVmax-t and rCBVmax-p ratios yielded good predictive power (AUC >0.80). In addition, the accuracy of rCBVmax-p ratios (94.67%) in the diagnosis of IDH-m GBMs was higher than that of rCBVmax-t ratios (74.67%).
Discussion and Conclusion
The results of the present study suggest that rCBVmax-p and rCBVmax-t can be a useful parameter for detecting IDH mutation in GBMs. On the basis of ROC curve analysis, the rCBVmax-p performs better than rCBVmax-t for detecting IDH mutation. Therefore, the conclusion of this study is that the rCBVmax-p in the peri-enhancing region showed a better diagnostic value than rCBVmax-t in the contrast-enhancing region to predict IDH genotypes of glioblastomas.Acknowledgements
No acknowledgement found.References
1. Hartmann C, Hentschel B, Wick W, et al. Patients with IDH1 wild type anaplastic astrocytomas exhibit worse prognosis than IDH1-mutated glioblastomas, and IDH1 mutation status accounts for the unfavorable prognostic effect of higher age: implications for classification of gliomas. Acta neuropathologica. 2010;120(6):707-18.
2. Kickingereder P, Sahm F, Radbruch A, et al. IDH mutation status is associated with a distinct hypoxia/angiogenesis transcriptome signature which is non-invasively predictable with rCBV imaging in human glioma. Scientific reports. 2015;5:16238.
3. Sonoda Y, Shibahara I, Kawaguchi T, et al. Association between molecular alterations and tumor location and MRI characteristics in anaplastic gliomas. Brain Tumor Pathol. 2015;32(2):99-104.
Figures